U.S. Department of Transportation
Federal Highway Administration
1200 New Jersey Avenue, SE
Washington, DC 20590
202-366-4000
Table IN-4
October 2011
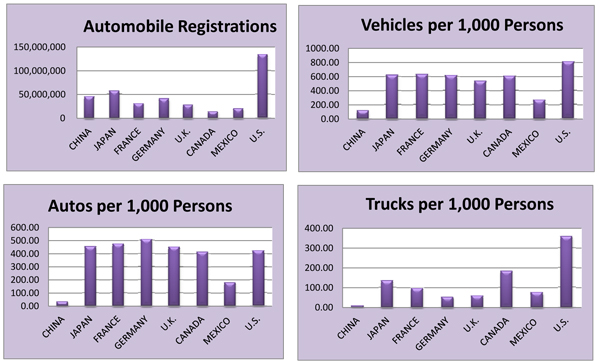
| ASIA | EUROPE | NORTH AMERICA | ||||||
|---|---|---|---|---|---|---|---|---|
| CHINA |
JAPAN |
FRANCE |
GERMANY |
U.K. |
CANADA |
MEXICO |
U.S. |
|
| Number of Automobiles | 46,307,202 | 57,902,835 | 31,050,000 | 41,737,627 | 28,459,000 | 14,172,168 | 20,523,704 | 133,648,199 |
| Number of Motorcycles and Mopeds |
95,842,780 | 3,517,115 | 3,532,000 | 3,762,561 | 1,292,000 | N/A | 1,201,046 | 8,165,545 |
| Number of Buses | 2,557,083 | 228,295 | 85,000 | 76,433 | 179,000 | N/A | 337,391 | 857,001 |
| Number of Trucks (Includes SUVs and Vans) |
13,793,410 | 17,045,250 | 6,300,000 | 4,344,960 | 3,723,000 | 6,317,658 | 8,842,518 | 112,159,250 |
| Total Vehicles (all) | 158,500,475 | 78,693,495 | 40,967,000 | 49,921,581 | 33,653,000 | 20,489,826 | 30,904,659 | 254,829,995 |
| Automobiles per 1000 Persons |
34.6 | 457.8 | 476.9 | 512.3 | 453.9 | 416.5 | 180.5 | 426.7 |
| Motorcycle and Mopeds per 1000 Persons |
71.7 | 27.8 | 54.3 | 46.2 | 20.6 | 0.0 | 10.6 | 26.1 |
| Buses per 1000 Persons |
1.9 | 1.8 | 1.3 | 0.9 | 2.9 | N/A | 3.0 | 2.7 |
| Trucks per 1000 Persons |
10.3 | 134.8 | 96.8 | 53.3 | 59.4 | 185.6 | 77.8 | 358.1 |
| Total Vehicles per 1000 Persons |
118.6 | 622.2 | 629.3 | 612.7 | 536.7 | 602.1 | 271.8 | 813.6 |
1/ SOURCES: Country data provided by the "World Road Statistics - 2011" of the International Road Federation, and United States data from "Highway Statistics 2010" table MV-1 of the Federal Highway Administration.
2/ SUVs and Vans in the United States are included in Truck Registrations.
3/ China includes Hong Kong.