U.S. Department of Transportation
Federal Highway Administration
1200 New Jersey Avenue, SE
Washington, DC 20590
202-366-4000
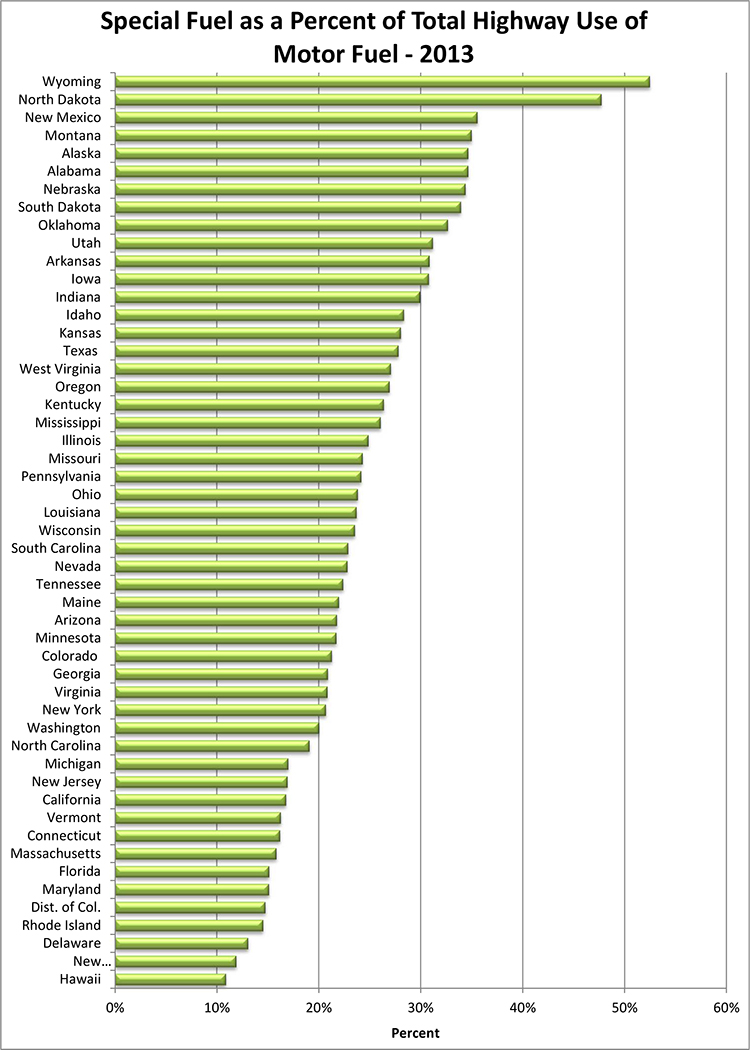
| STATE | % DIESEL |
|---|---|
| Wyoming | 52.44% |
| North Dakota | 47.71% |
| New Mexico | 35.53% |
| Montana | 34.98% |
| Alabama | 34.63% |
| Alaska | 34.63% |
| Nebraska | 34.37% |
| South Dakota | 33.91% |
| Oklahoma | 32.63% |
| Utah | 31.15% |
| Arkansas | 30.84% |
| Iowa | 30.77% |
| Indiana | 29.90% |
| Idaho | 28.32% |
| Kansas | 28.01% |
| Texas | 27.78% |
| West Virginia | 27.04% |
| Oregon | 26.91% |
| Kentucky | 26.35% |
| Mississippi | 26.04% |
| Illinois | 24.85% |
| Missouri | 24.28% |
| Pennsylvania | 24.13% |
| Ohio | 23.80% |
| Louisiana | 23.68% |
| Wisconsin | 23.51% |
| South Carolina | 22.85% |
| Nevada | 22.79% |
| Tennessee | 22.36% |
| Maine | 21.94% |
| Arizona | 21.75% |
| Minnesota | 21.70% |
| Colorado | 21.25% |
| Georgia | 20.86% |
| Virginia | 20.82% |
| New York | 20.66% |
| Washington | 20.00% |
| North Carolina | 19.05% |
| Michigan | 16.97% |
| New Jersey | 16.90% |
| California | 16.76% |
| Vermont | 16.25% |
| Connecticut | 16.18% |
| Massachusetts | 15.81% |
| Florida | 15.11% |
| Maryland | 15.09% |
| Dist. of Col. | 14.73% |
| Rhode Island | 14.52% |
| Delaware | 13.03% |
| New Hampshire | 11.88% |
| Hawaii | 10.86% |

