U.S. Department of Transportation
Federal Highway Administration
1200 New Jersey Avenue, SE
Washington, DC 20590
202-366-4000
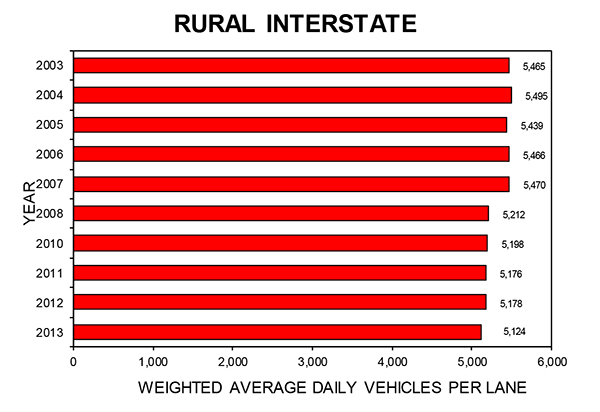
| Year | Vehicles |
|---|---|
| 2003 | 5,465 |
| 2004 | 5,495 |
| 2005 | 5,439 |
| 2006 | 5,466 |
| 2007 | 5,470 |
| 2008 | 5,212 |
| 2010 | 5,198 |
| 2011 | 5,176 |
| 2012 | 5,178 |
| 2013 | 5,124 |
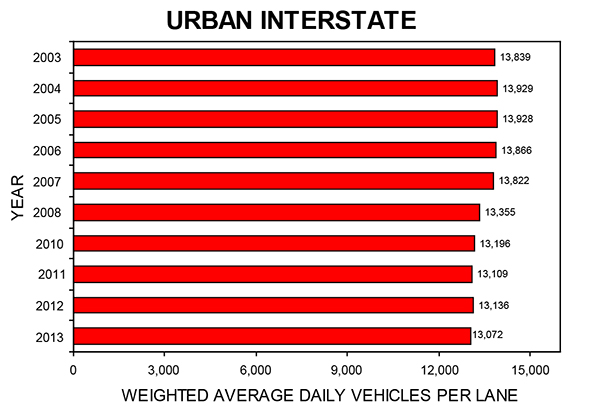
| Year | Vehicles |
|---|---|
| 2003 | 13,839 |
| 2004 | 13,929 |
| 2005 | 13,928 |
| 2006 | 13,866 |
| 2007 | 13,822 |
| 2008 | 13,355 |
| 2010 | 13,196 |
| 2011 | 13,109 |
| 2012 | 13,136 |
| 2013 | 13,072 |
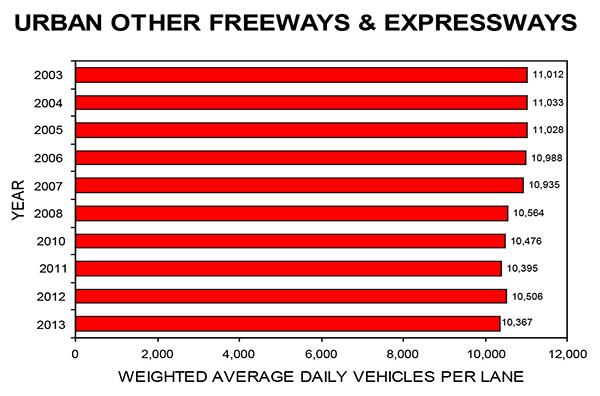
| Year | Vehicles |
|---|---|
| 2003 | 11,012 |
| 2004 | 11,033 |
| 2005 | 11,028 |
| 2006 | 10,988 |
| 2007 | 10,935 |
| 2008 | 10,564 |
| 2010 | 10,476 |
| 2011 | 10,395 |
| 2012 | 10,506 |
| 2013 | 10,367 |
(1) 2009 data unavailable.

