U.S. Department of Transportation
Federal Highway Administration
1200 New Jersey Avenue, SE
Washington, DC 20590
202-366-4000
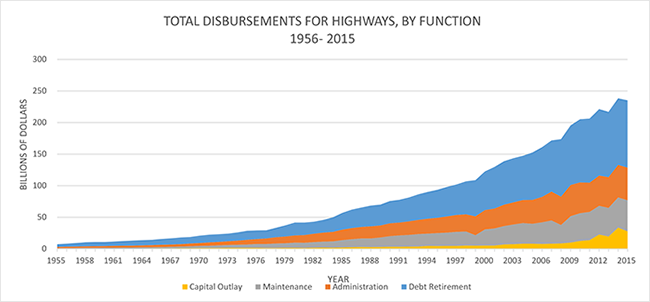
(Billions of Dollars)
| Year | Capital Outlay | Maintenance | Administration, Highway Law Enforcement, and Bond Interest |
Debt Retirement |
|---|---|---|---|---|
| 1945 | 0.37 | 0.80 | 0.26 | 0.27 |
| 1946 | 0.80 | 0.93 | 0.31 | 0.26 |
| 1947 | 1.41 | 1.08 | 0.37 | 0.26 |
| 1948 | 1.79 | 1.28 | 0.38 | 0.27 |
| 1949 | 2.15 | 1.35 | 0.42 | 0.27 |
| 1950 | 2.30 | 1.42 | 0.44 | 0.32 |
| 1951 | 2.53 | 1.56 | 0.47 | 0.34 |
| 1952 | 2.89 | 1.65 | 0.51 | 0.34 |
| 1953 | 3.33 | 1.73 | 0.56 | 0.35 |
| 1954 | 4.11 | 1.80 | 0.67 | 0.41 |
| 1955 | 4.33 | 1.88 | 0.73 | 0.41 |
| 1956 | 5.02 | 2.09 | 0.83 | 0.42 |
| 1957 | 5.65 | 2.21 | 0.95 | 0.53 |
| 1958 | 6.35 | 2.37 | 1.08 | 0.54 |
| 1959 | 6.66 | 2.48 | 1.14 | 0.61 |
| 1960 | 6.29 | 2.64 | 1.23 | 0.60 |
| 1961 | 6.80 | 2.73 | 1.30 | 0.67 |
| 1962 | 7.39 | 2.84 | 1.40 | 0.68 |
| 1963 | 7.89 | 2.92 | 1.51 | 0.73 |
| 1964 | 8.25 | 3.06 | 1.67 | 0.75 |
| 1965 | 8.37 | 3.29 | 1.80 | 0.86 |
| 1966 | 9.25 | 3.52 | 2.02 | 0.92 |
| 1967 | 9.66 | 3.77 | 2.27 | 0.97 |
| 1968 | 10.35 | 4.00 | 2.51 | 1.07 |
| 1969 | 10.37 | 4.33 | 2.90 | 1.17 |
| 1970 | 11.58 | 4.72 | 3.29 | 1.25 |
| 1971 | 12.31 | 5.11 | 3.78 | 1.28 |
| 1972 | 12.28 | 5.43 | 4.22 | 1.27 |
| 1973 | 12.17 | 5.95 | 4.67 | 1.41 |
| 1974 | 13.10 | 6.57 | 5.00 | 1.45 |
| 1975 | 14.40 | 7.29 | 5.52 | 1.49 |
| 1976 | 13.93 | 7.74 | 6.08 | 1.57 |
| 1977 | 13.08 | 8.61 | 6.49 | 1.28 |
| 1978 | 14.94 | 9.79 | 7.12 | 1.37 |
| 1979 | 17.61 | 10.57 | 7.51 | 1.43 |
| 1980 | 20.34 | 11.45 | 8.30 | 1.46 |
| 1981 | 19.73 | 12.17 | 8.53 | 1.20 |
| 1982 | 19.05 | 13.32 | 8.91 | 1.69 |
| 1983 | 20.22 | 14.24 | 9.53 | 1.87 |
| 1984 | 23.12 | 15.01 | 10.18 | 1.64 |
| 1985 | 26.65 | 16.59 | 11.56 | 2.15 |
| 1986 | 29.23 | 17.64 | 12.73 | 2.51 |
| 1987 | 30.74 | 18.15 | 13.72 | 2.79 |
| 1988 | 32.96 | 19.11 | 13.75 | 2.68 |
| 1989 | 33.14 | 18.95 | 15.16 | 2.83 |
| 1990 | 35.15 | 20.37 | 16.94 | 3.21 |
| 1991 | 36.15 | 20.38 | 17.91 | 3.28 |
| 1992 | 37.81 | 21.54 | 18.55 | 3.47 |
| 1993 | 40.48 | 22.60 | 19.68 | 3.63 |
| 1994 | 42.38 | 23.55 | 19.71 | 4.55 |
| 1995 | 44.23 | 24.32 | 20.45 | 4.48 |
| 1996 | 46.81 | 25.56 | 21.12 | 4.59 |
| 1997 | 48.36 | 26.78 | 22.18 | 4.63 |
| 1998 | 52.31 | 27.17 | 22.35 | 5.15 |
| 1999 | 57.23 | 30.00 | 16.67 | 4.91 |
| 2000 | 61.32 | 30.64 | 25.63 | 5.11 |
| 2001 | 65.97 | 31.68 | 27.17 | 5.09 |
| 2002 | 68.79 | 33.89 | 29.01 | 6.95 |
| 2003 | 70.00 | 35.01 | 31.20 | 7.39 |
| 2004 | 70.27 | 36.33 | 32.88 | 8.01 |
| 2005 | 75.16 | 37.88 | 31.58 | 8.07 |
| 2006 | 78.68 | 40.43 | 34.31 | 7.65 |
| 2007 | 81.10 | 45.76 | 36.86 | 8.03 |
| 2008 | 91.14 | 44.97 | 29.28 | 8.48 |
| 2009 | 94.53 | 49.43 | 41.89 | 9.73 |
| 2010 | 100.18 | 48.77 | 44.09 | 12.28 |
| 2011 | 101.61 | 46.31 | 44.80 | 13.71 |
| 2012 | 105.20 | 47.99 | 45.48 | 22.65 |
| 2013 | 103.43 | 48.65 | 45.49 | 19.46 |
| 2014 | 105.45 | 51.59 | 47.93 | 33.45 |
| 2015 | 106.54 | 51.82 | 49.18 | 27.66 |

