U.S. Department of Transportation
Federal Highway Administration
1200 New Jersey Avenue, SE
Washington, DC 20590
202-366-4000
Office of Highway Policy Information
Federal Highway Administration
May 2020
| Vehicle Class | Compound Annual Growth Rates | |||||
|---|---|---|---|---|---|---|
| Pessimistic Economic Growth Outlook* | Baseline Economic Growth Outlook* | Optimistic Economic Growth Outlook* | ||||
| 2018 - 2038 (20 Year) |
2018 - 2048 (30 Year) |
2018 - 2038 (20 Year) |
2018 - 2048 (30 Year) |
2018 - 2038 (20 Year) |
2018 - 2048 (30 Year) |
|
| Light-Duty Vehicles | 0.9% | 0.6% | 1.1% | 0.8% | 1.4% | 1.1% |
| Single-Unit Trucks | 1.3% | 1.6% | 1.9% | 2.2% | 2.2% | 2.5% |
| Combination Trucks | 1.0% | 1.1% | 1.3% | 1.3% | 1.5% | 1.5% |
| Total | 1.0% | 0.7% | 1.2% | 0.9% | 1.5% | 1.2% |
* See the following sections for detailed descriptions of the Baseline and alternative economic outlooks.
The Federal Highway Administration’s Spring 2020 long-term forecasts of nationwide VMT are based on long-term economic and demographic outlooks produced by the economic forecasting firm IHS Markit.[1] FHWA’s national VMT forecasts are produced using statistical models that incorporate a variety of factors affecting historical variation in motor vehicle use; these models are then used to develop forecasts that begin in 2019 and extend through 2048. The following sections highlight the IHS Baseline forecasts of key economic and demographic factors that influence future growth in passenger and freight travel, and discuss their effect on the resulting VMT forecasts. Following this is a brief discussion of the alternative forecasts of U.S. economic performance provided by IHS and their potential implications for future VMT growth.
Table 2 summarizes the IHS Spring 2020 long-term Baseline forecast of the key measures of U.S. economic activity used to develop FHWA’s VMT forecasts.[2] The U.S. population is projected to grow by 0.6% annually over the 30-year forecast period, a rate well below its 1.0% annual increase over the previous 30 years. Aggregate economic output, measured by real GDP (2012$) is anticipated to increase 2.0% annually through 2048, which is also lower than the yearly growth rate the U.S. economy has experienced in recent decades.
| Demographic and Economic Indicators | Historical Growth Rate[3] | Forecast Growth Rate: 2018-48 |
|---|---|---|
| U.S. Population[4] | 1.0% | 0.6% |
| Total GDP (Real 2012$) |
2.6% | 2.0% |
| Disposable Personal Income per Capita (Real 2012$) |
1.7% | 1.6% |
| Imports and Exports of Goods (Real 2012$) |
5.4% | 3.3% |
| Consumption of Other Non-Durable Goods[5] (Real 2012$) |
3.2% | 3.3% |
| Gasoline Price per Gallon (Real 2012$) |
0.7% | -0.3% |
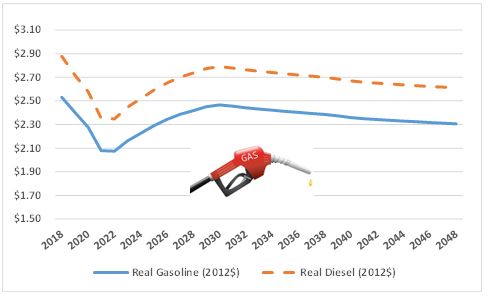
The IHS baseline forecast projects that growth in disposable personal income per capita will average 1.6% annually over the 30-year forecast period, close to its 1.7% average annual growth rate over the past few decades. Growth in the import and exports of goods and consumption of other non-durable goods sectors should outpace overall economic growth, as Table 2 also shows. Gasoline prices are expected to decrease in the near term before rebounding to an average of $2.34 per gallon (2012$) by the mid-2030s, and then gradually decline through the remainder of the forecast period. Figure 1 presents the long run forecasts of constant-dollar prices of gasoline and diesel.
Figure 1. Price per Gallon of Diesel and Gasoline (2018-2048, 2012$)
Under the IHS Baseline economic outlook, steady long-term growth in employment, business investment, and productivity are expected, leading to continuing gradual increases in real economic output (Gross Domestic Product) and real disposable income. In addition, after increasing during the coming decade, energy prices are projected to gradually decline. These trends combine with moderate population growth to generate sustained increases in both passenger vehicle and truck travel, although at significantly slower rates than those experienced in recent decades.
In 2018, travel by light–duty vehicles–including automobiles and light-duty trucks used primarily for passenger travel—amounted to nearly 2.9 trillion miles, an increase of about 0.7% from 2017. Use of light-duty vehicles accounts for nearly 91% of total U.S. motor vehicle travel. As Table 3 reports, growth in light-duty VMT is projected to average 1.1% per year from 2018–2038. Over the following decade, however, growth in light–duty vehicle travel is expected to moderate, so that throughout the entire 30-year forecast period it is projected to average only about 0.8% per year.
| Vehicle Class | Compound Annual Growth Rates | |
|---|---|---|
| 2018 – 2038 (20 Year) |
2018 – 2048 (30 Year) |
|
| Light-Duty Vehicles | 1.1% | 0.8% |
| Single-Unit Trucks | 1.9% | 2.2% |
| Combination Trucks | 1.3% | 1.3% |
| Total | 1.2% | 0.9% |
Truck travel in the U.S reached 305 billion miles in 2018, increasing by 2.4% from 2017 and accounting for almost all of the remaining 10% of U.S. motor vehicle use.[6] Table 3 shows that truck travel is projected to grow more rapidly than light-duty vehicle travel under the Baseline economic outlook, and that this growth is also expected to be sustained during the last decade of the forecast period.
Growth in VMT by single-unit trucks is projected to average 1.9% and 2.2% per year for the 20- and 30-year forecast periods, reflecting continued growth in construction activity, distribution and delivery of consumer goods, and other economic activities that depend heavily on local trucking. VMT by combination trucks is also expected to grow steadily throughout this period, reflecting the outlook for sustained growth in shipping-intensive sectors of the economy: U.S. goods manufacturing and international trade. Combination truck VMT is projected to increase by 1.3% annually over the entire 30-year forecast period.
Finally, Table 3 reports that aggregate VMT by all vehicle classes is projected to grow at an average annual rate of 1.2% over the 20 years from 2018–38. Reflecting the projected slowing of growth in passenger vehicle use during the last decade of the forecast period, growth in total VMT is expected to average 0.9% annually for the entire 30-year forecast period.
Over the past two decades, sudden and unexpected changes in vehicle use such as those observed during the 2008–09 recession and more recently in response to the economic impact of the COVID-19 pandemic have highlighted the uncertainty surrounding forecasts of future growth in motor vehicle travel. Important sources of such uncertainty include concerns about prospects for future economic growth, alternative interpretations of the causes of recent declines in vehicle ownership and use (particularly among younger Americans), and the potential effects on vehicle use of dramatic innovations in technology such as the advent of autonomous vehicles. To acknowledge this uncertainty, FHWA provides a range of alternative forecasts for future VMT growth that reflect uncertainty about the outlook for future economic growth, travel behavior, and vehicle technology.[7]
To develop these alternative forecasts, FHWA used projections of population growth, U.S. economic output and its composition, growth in personal income, and energy prices from the Optimistic and Pessimistic scenarios reported as part of IHS' Spring 2020 30-year economic outlook.
The VMT forecasting model attempts to capture dual effects of income growth on household and business travel using light-duty vehicles. On one hand, rising income increases the demand to participate in economic, social, and recreational activities outside the home, which gives rise to increased demand for travel. Meanwhile, rising incomes also increase the effective cost of time spent driving, and thus dampen travel demand.
FHWA’s alternative forecast of higher total VMT growth relies on IHS’ Optimistic economic outlook, which projects stronger growth in productivity, labor force participation, employment, and business investment levels than under the Baseline outlook. These factors—combined with a more robust housing sector and lower energy prices—produce stronger growth in real GDP, goods production, and disposable income than in the Baseline outlook. In turn, under the Optimistic economic outlook, these developments generate significantly faster growth in freight shipments and truck VMT.
Under this more optimistic economic growth scenario, passenger vehicle VMT is predicted to outpace the baseline outlook over both the 20- and 30-year forecast periods. The relatively modest effect of more rapid economic growth on passenger travel is primarily a result of the specification of FHWA’s model specification. It attempts to account for the effect of continued growth in personal income on the value of time spent traveling, and the dampening influence that rising values of travel time are ultimately expected to have on travel demand as personal disposable income continues to increase.[8]
In contrast, FHWA’s alternative forecast of lower growth in vehicle use reflects the Pessimistic economic outlook from IHS’ Spring 2020 forecast. This alternative outlook predicts weaker growth in productivity, labor force participation, and business investment, together with higher interest rates and more rapid price inflation. These factors, combined with less robust activity in the housing sector and higher energy prices, dampen projected future growth in real GDP and personal income relative to the Baseline economic outlook. Under this scenario, slower economic growth leads to lower demand for personal travel, so that passenger vehicle use increases primarily as a result of U.S. population growth. At the same time, slower growth in goods manufacturing, freight shipments, and construction activity dampen growth in truck use compared with the levels projected in the Baseline forecast.
To illustrate the important differences in future economic trends affecting vehicle use among the alternative economic outlooks, Figures 2–4 below compare forecast growth in real GDP, personal disposable income, and gasoline prices in the Pessimistic and Optimistic scenarios to the Baseline outlook. As shown in Figure 2 , real GDP is anticipated to grow about 2.4% per year over the 30-year forecast period under the Optimistic outlook, compared to close to 2.0% annual growth projected for the Baseline scenario, and is projected to average only about 1.5% annually in the Pessimistic scenario.
Figure 2. Real GDP Growth under Alternative Economic Outlooks
(30-Year Average Annual Growth)
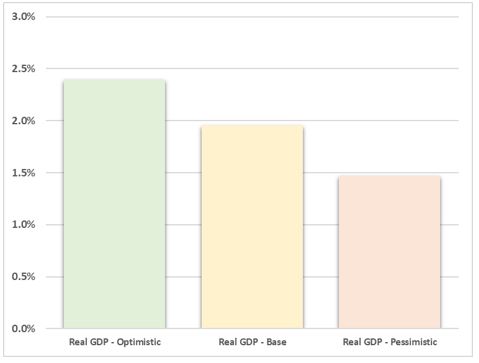
Figure 3 shows that growth in real personal disposable income per capita is forecast to be nearly identical for the Baseline and Optimistic 30 year outlooks, averaging about 1.6% per year under both scenarios. In contrast, growth in personal disposable income under the Pessimistic outlook is expected to be slightly slower, averaging 1.4% annually. Finally, Figure 4 illustrates that inflation-adjusted retail gasoline prices are expected to decrease by about 0.7% and 0.3% annually under the Optimistic and Baseline outlooks respectively, whereas the Pessimistic economic outlook predicts average yearly growth in gasoline prices of 0.2%.
Figure 3. Growth in Real Personal Disposable Income per Capita under Alternative Economic Outlooks
(30-Year Average Annual Growth)
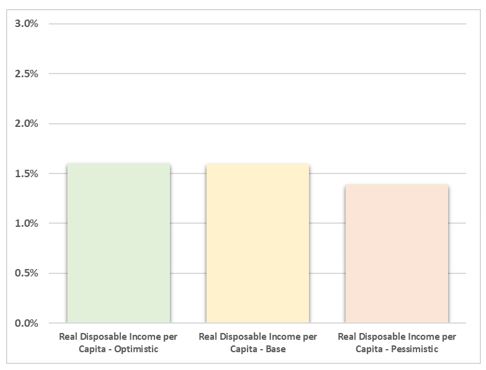
Figure 4. Changes in Real Gasoline Prices under Alternative Economic Outlooks
(30-Year Average Annual Change, scale resized)
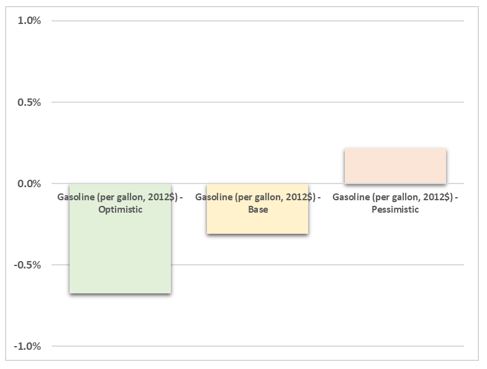
Table 4 reports alternative forecasts of future growth in VMT under the Optimistic and Pessimistic economic outlooks; the range between them again reflects the effect of uncertainty about future economic growth. These alternative outlooks have a pronounced effect on the forecast of future growth in light-duty vehicle use during the first 20-year period, with the difference ranging from 1.2% in the optimistic scenario to 0.9% under the pessimistic scenario. This range tightens slightly during the last ten years of the forecast period; however, as the countervailing effect of income growth incorporated in the model tends to maintain the forecasts within a certain range.
In contrast, the difference between the forecasts of 20- and 30-year growth in truck travel between the Optimistic and Pessimistic economic outlooks is much larger, since they reflect fundamentally differing outlooks for the investment and manufacturing sectors of the U.S. economy. Because light-duty vehicles account for the largest share of total VMT, however, the long-term 30-year forecast of total VMT varies only within a comparatively narrow range between the Optimistic and Pessimistic economic outlooks.
| Vehicle Class | Compound Annual Growth Rates | |||
|---|---|---|---|---|
| Pessimistic Economic Outlook | Optimistic Economic Outlook | |||
| 2018 - 2038 (20 Year) |
2018 - 2048 (30 Year) |
2018 - 2038 (20 Year) |
2018 - 2048 (30 Year) |
|
| Light-Duty Vehicles | 0.9% | 0.6% | 1.4% | 1.1% |
| Single-Unit Trucks | 1.3% | 1.6% | 2.2% | 2.5% |
| Combination Trucks | 1.0% | 1.1% | 1.5% | 1.5% |
| Total | 1.0% | 0.7% | 1.5% | 1.2% |
Volpe, The National Transportation Systems Center, U.S. Department of Transportation has performed the modeling underlying these forecasts and provided technical assistance to the Federal Highway Administration.
[1] http://www.ihs.com/index.aspx
[2] The spring economic forecasts were completed prior to the COVID-19 outbreak affecting the U.S. economy and its outlook.
[3] Historical data: 1988 through 2018
[4] The IHS population forecast is based on the Census Bureau's long-term population projections.
[5] Other non-durable goods refers to commodities such as pharmaceutical and other medical products, recreational items, household supplies, and magazines and newspapers.
[6] Motorcycles and buses, which are excluded from the forecasts reported in Table 3, together accounted for only about 1% of all U.S. motor vehicle travel during 2018.
[7] Uncertainty about future VMT growth arising from the potential for fundamental changes in travel behavior or vehicle technology is likely to be resolved only with the passage of time, the availability of more detailed information about personal travel, and experience with real-world deployment of advanced vehicle technologies. Thus FHWA's forecasts of future VMT growth do not attempt to incorporate these sources of uncertainty.
[8] For more information on the VMT models, please refer to the technical document at: http://www.fhwa.dot.gov/policyinformation/tables/vmt/vmt_model_dev.cfm

