U.S. Department of Transportation
Federal Highway Administration
1200 New Jersey Avenue, SE
Washington, DC 20590
202-366-4000
Office of Highway Policy Information
Federal Highway Administration
September 2025
FHWA projects total VMT by all vehicle types to grow at an average rate of 0.7% annually over the 20-year period through 2043 (Table 1). For the entire 30-year forecast period, the average annual growth rate is projected to be slightly lower (0.6%), as VMT growth is expected to slow gradually during the latter half of the forecast period. This outlook represents a move towards more moderate growth rates and gradual convergence of VMT with population growth, particularly when compared to the 2.0% annual VMT growth experienced between 1989 and 2019.
Under the baseline (most likely scenario) outlook, travel by light-duty vehicles, the largest category of total motor vehicle travel, is forecast to grow at an average annual rate of 0.6% between 2023 and 2043 (Table 1). Light-duty vehicle VMT is expected to grow at a more moderate rate between 2043 and 2053, reducing annual average growth over the entire 30-year forecast period to 0.5%. Combination truck VMT is projected to grow at average annual rates of 1.0% and 0.9% over the 20- and 30-year forecast horizons, respectively. Growth in travel by single-unit trucks is projected to average 2.1% per year over the 20-year forecast period and 2.0% annually over the full 30-year period.
Under the alternative forecasts of U.S. economic growth reflected in the S&P Global pessimistic and optimistic economic outlooks, the 20-year forecast of annual growth in total VMT ranges from 0.5% to 1.0%, while the 30-year forecast of annual growth ranges from 0.4% to 0.9% per year
*See the following sections for detailed descriptions of the baseline and alternative economic outlooks.
The Federal Highway Administration Spring 2025 long-term forecasts of nationwide VMT are based on long-term economic and demographic outlooks produced by the economic forecasting firm S&P Global Market Intelligence. FHWA’s national VMT forecasts are produced using statistical models that incorporate a range of factors affecting historical growth in motor vehicle use; these models are then used to develop VMT forecasts for each vehicle class that begin in 2024 and extend through 2053.1 The following two sections highlight the S&P Global baseline forecasts of key economic and demographic factors expected to influence future growth in passenger and freight travel, and discuss their effects on the resulting VMT forecasts. Following this is a brief discussion of the alternative forecasts of U.S. economic performance provided by S&P Global and their potential implications for future VMT growth.
Table 2 summarizes the S&P Global Spring 2025 long-term baseline forecast of the key measures of U.S. economic activity used to develop FHWA’s VMT forecasts. U.S. population is projected to grow by 0.2% annually over the 30-year forecast period, a rate well below its 1.0% annual increase over the previous 30 years. Aggregate economic output, measured by real GDP (expressed in constant 2017$), is anticipated to increase 1.7% annually through 2053, significantly slower than the 2.5% yearly growth rate the U.S. economy has experienced in recent decades.
| Demographic and Economic Indicators | Historical Growth Rate2 | Forecast Growth Rate: 2023-2053 |
|---|---|---|
| U.S. Population3 | 1.0% | 0.2% |
| Total GDP (2017$) | 2.5% | 1.7% |
| Disposable Personal Income per Capita (2017$) | 1.7% | 2.0% |
| Imports and Exports of Goods (2017$) | 5.2% | 2.1% |
| Consumption of Other Non-Durable Goods4 (2017$) | 3.1% | 2.3% |
| Gasoline Price per Gallon (2017$) | 1.1% | -0.6% |
The S&P Global baseline forecast projects that growth in disposable personal income per capita will average 2.0% annually over the 30-year forecast period, slightly higher than its historical average.5 Growth in imports and exports of goods and consumption of other non-durable goods are both projected to be somewhat slower than in recent decades but are nevertheless projected to continue outpacing overall economic growth. Gasoline prices (pictured in Figure 1 below) peaked in 2022 before declining as oil markets rebalanced, and are projected to stabilize in the early 2030s, resulting in an average price of $2.72 per gallon (2017$) between 2023 and 2053.
Figure 1. Price per Gallon of Diesel and Gasoline (2019-2053, 2017$)

The S&P Global baseline economic outlook projects steady long-term growth in employment, business investment, and productivity, leading to continuing increases in real economic output (GDP) and real disposable income. In addition, after increasing in the near-term, energy prices are projected to decline gradually. These trends, combined with moderating population growth, are expected to generate sustained increases in both passenger vehicle and truck travel, although at significantly slower rates than in previous decades.
As shown in Table 3, light-duty VMT growth is projected to average 0.6% per year from 2023 through 2043. Over the following decade, VMT growth is expected to slow, resulting in an average of about 0.5% growth over the entire 30-year forecast.
Single-unit truck VMT growth is projected to average 2.1% and 2.0% per year for the 20-year and 30-year forecast periods, respectively, reflecting ongoing growth of economic activity in construction, distribution and delivery of consumer goods, and other areas of the economy that depend heavily on local trucking. Combination truck VMT is also expected to increase, reflecting the outlook for sustained growth in domestic goods manufacturing and international trade which are two of the most shipping-intensive sectors of the U.S. economy. Combination truck VMT is projected to increase by 1.0% per year between 2023 and 2043 and by 0.9% annually over the entire 30-year forecast period.
Finally, aggregate VMT by all vehicle classes is projected to grow at an average annual rate of 0.7% over the 20 years from 2023 to 2043 (Table 3). Reflecting the projected slowing of travel demand during the last decade of the forecast period, growth in total VMT is expected to average 0.6% annually over the entire 30-year forecast period.
Over the past two decades, sudden and unexpected changes in vehicle use, such as those observed during and following the 2008-2009 recession, have highlighted the uncertainty surrounding forecasts of future growth in motor vehicle travel. Important sources of continuing uncertainty include prospects for future economic growth, shifting trends in remote working, alternative interpretations of the causes of recent declines in vehicle ownership and use, and the potential impacts on travel activity from dramatic innovations in technology such as the advent of autonomous vehicles. To acknowledge this uncertainty, FHWA provides a range of alternative forecasts for future VMT growth that reflect uncertainty about the outlook for future economic growth and recognizes that economic growth represents only one of many potentially important sources of uncertainty about future travel activity.
To develop these alternative forecasts, FHWA uses projections of population growth, U.S. economic output and its composition, growth in personal income, and energy prices from the optimistic and pessimistic scenarios reported as part of the S&P Global Spring 2025 30-year economic outlook.
FHWA’s alternative forecast of higher total VMT growth relies on the S&P Global Spring 2025 optimistic economic outlook, which projects stronger growth in labor force participation, employment, business investment, and productivity relative to the baseline outlook. These factors—combined with a more robust housing sector and lower energy prices—produce stronger growth in real GDP, goods production, and disposable income than in the baseline outlook. In turn, these developments generate significantly faster growth in freight shipments and truck VMT. Under this more optimistic economic growth scenario, with higher personal disposable income growth, light-duty VMT is also predicted to outpace the baseline outlook over both the 20- and 30-year forecast periods.
In contrast, FHWA’s alternative forecast of lower growth in VMT reflects the pessimistic economic outlook from the S&P Global Spring 2025 forecast. This alternative outlook predicts weaker growth in productivity, labor force participation, and business investment, together with higher interest rates and more rapid price inflation. Combined with less robust activity in the housing sector and higher energy prices, these factors dampen projected future growth in real GDP and personal income relative to the baseline economic outlook. Under this scenario, although slower economic growth and higher fuel prices leads to lower demand for personal travel, light-duty VMT increases primarily as a result of U.S. population growth. At the same time, higher fuel prices coupled with slower growth in goods manufacturing, freight shipments, and construction activity dampen growth in truck VMT compared to the levels projected under the baseline forecast.
To illustrate the important differences in future economic conditions affecting VMT among the alternative economic outlooks, the figures below compare forecast growth in real GDP (Figure 2), personal disposable income (Figure 3), and gasoline prices (Figure 4) in the pessimistic and optimistic scenarios to the baseline outlook. As Figure 2 shows, real GDP is anticipated to grow about 2.1% per year over the 30-year forecast period under the optimistic outlook, compared to 1.7% annual growth projected for the baseline scenario, and only 1.2% annual growth in the pessimistic scenario.
Figure 2. Projected Growth in Real GDP under Alternative Economic Outlooks
(Compound Annual Growth Rate, 2023-2053)
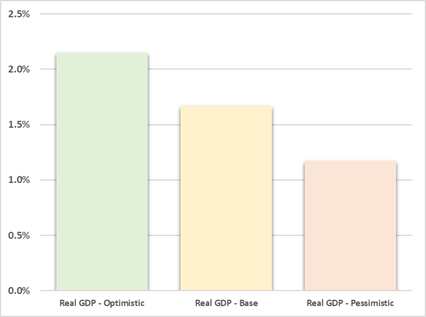
Figure 3 shows that growth in real personal disposable income per capita is forecast to average 2.2% annually in the optimistic 30-year outlook, with the baseline outlook averaging 2.0% per year. In contrast, growth in real personal disposable income under the pessimistic outlook is expected to average only 1.7% annually.
Figure 3. Projected Growth in Real Personal Disposable Income per Capita under Alternative Economic Outlooks
(Compound Annual Growth Rate, 2023-2053)
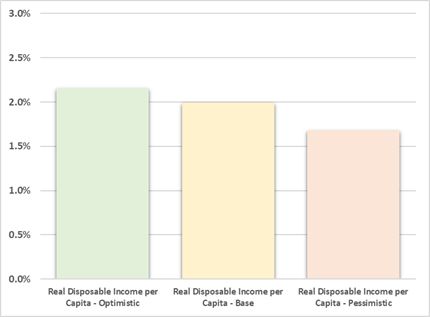
Figure 4. Projected Growth in Real Gasoline Prices per Gallon under Alternative Economic Outlooks
(Compound Annual Growth Rate, 2023-2053)
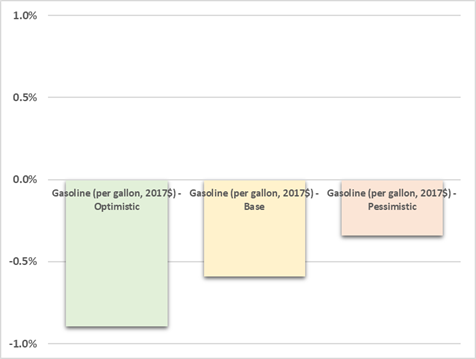
Figure 4 illustrates that inflation-adjusted retail gasoline prices are expected to decrease by about 0.9% annually under the optimistic 30-year outlook, and to decrease by 0.6% and 0.3% annually under the baseline and pessimistic outlooks, respectively.
Table 4 reports alternative forecasts of future growth in VMT under these optimistic and pessimistic economic outlooks; the range between them reflects the effect of uncertainty about future economic growth. As the table shows, these alternative outlooks have a pronounced effect on the forecast of future growth in light-duty VMT through 2053, which ranges from a high of 0.8% annually in the optimistic scenario to only 0.3% per year under the pessimistic scenario.
The difference between the forecasts of 20- and 30-year growth in truck travel between the optimistic and pessimistic economic outlooks is even larger, as they reflect fundamentally differing outlooks for U.S. consumption, investment, trade, and manufacturing. Because light-duty vehicles account for the largest share of total VMT, the long-term 30-year forecast of combined VMT by trucks and personal vehicles varies within a comparatively narrow range between the optimistic and pessimistic economic outlooks.
1 For more information on the VMT models, please refer to the technical document at: http://www.fhwa.dot.gov/policyinformation/tables/vmt/vmt_model_dev.cfm
2 The historical data period used for comparison is 1989 through 2019.
3 The S&P Global population forecast is based on the Census Bureau’s long-term population projections.
4 The indicator for other non-durable goods includes consumption of commodities such as pharmaceutical and other medical products, recreational items, household supplies, and magazines and newspapers.
5 The specification of the VMT forecasting model attempts to reflect the dual effects of income growth on household travel using light-duty vehicles. On one hand, rising income increases the demand to participate in economic, social, and recreational activities outside the home, which causes increased demand for travel by household members. Meanwhile, rising incomes increase the effective cost of time spent driving and thus dampen travel demand.

