U.S. Department of Transportation
Federal Highway Administration
1200 New Jersey Avenue, SE
Washington, DC 20590
202-366-4000
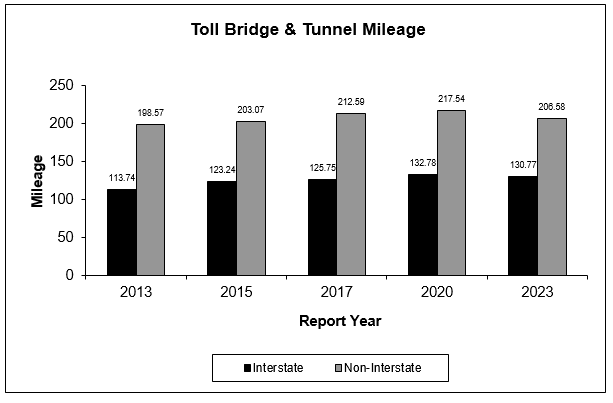
Toll Bridges & Tunnels |
||
|---|---|---|
Year |
Interstate |
Non-Interstate |
| 2013 | 113.74 | 198.57 |
| 2015 | 123.24 | 203.07 |
| 2017 | 125.75 | 212.59 |
| 2020 | 132.78 | 217.54 |
| 2023 | 130.77 | 206.58 |
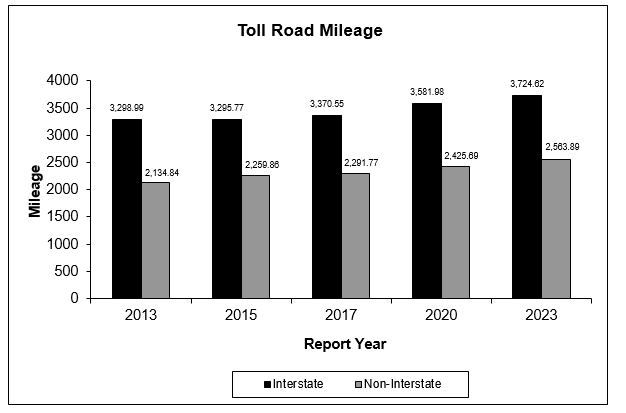
Toll Road Mileage |
||
|---|---|---|
Year |
Interstate |
Non-Interstate |
| 2013 | 3,298.99 |
2,134.84 |
| 2015 | 3,295.77 |
2,259.86 |
| 2017 | 3,370.55 |
2,291.77 |
| 2020 | 3,581.98 |
2,425.69 |
| 2023 | 3,724.62 |
2,563.89 |
Toll Mileage Trends -- 2011 to 2023
(Interstate and Non-Interstate Bridges, Tunnels, and Roads)