U.S. Department of Transportation
Federal Highway Administration
1200 New Jersey Avenue, SE
Washington, DC 20590
202-366-4000


Skip to content
Facebook iconYouTube iconTwitter iconFlickr iconLinkedInInstagram

Federal Highway Administration Research and Technology
Coordinating, Developing, and Delivering Highway Transportation Innovations

 
REPORT
This report is an archived publication and may contain dated technical, contact, and link information
Back to Publication List        
Publication Number:  FHWA-HRT-12-048    Date:  November 2013
Publication Number: FHWA-HRT-12-048
Date: November 2013


Pavement Marking Demonstration Projects: State of Alaska and State of Tennessee

APPENDIX B. PAVEMENT MARKING RETROREFLECTIVITY DEGRADATION GRAPHS

This appendix contains graphs showing the retroreflectivity degradation of each test section that has lasted at least 1 year. The y-axes on the graphs represent retroreflectivity (mcd/m2/lux), and the x-axes represent the marking's age in days since application. For more specific marking information, refer to appendix A. Note that the y-axes vary in scale between the graphs.
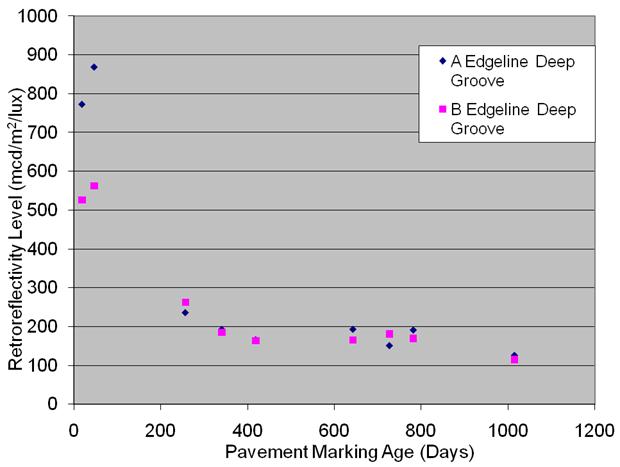
ALASKA TEST DECK

This graph shows the retroreflectivity degradation for section 5 AK a and 5 AK b on the Alaska test deck. Retroreflectivity level ranging from 0 to 1,000 mcd/m2/lux is on the y-axis, and pavement marking age from 0 to 1,200 days is on the x-axis for A and B edge line deep grooves. On day 0, the A groove is shown at a higher retroreflectivity level than the B groove. Both decrease significantly to about the same level on day 200 and then continue to gradually decrease until day 1,000.
Figure 70. Graph. Retroreflectivity degradation sections 5 AK a and 5 AK b
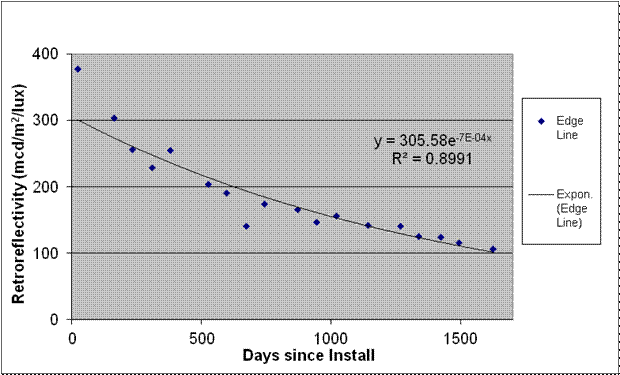
NASHVILLE, TN, TEST DECK

This graph shows the retroreflectivity degradation for section 1 TN-N on the Nashville, TN, test deck. Retroreflectivity ranging from 0 to 400 mcd/m2/lux is on the y-axis, and days since installation is on the x-axis from 0 to 1,700 days for edge line and exponential edge line. On day 0, the edge line is shown at a higher retroreflectivity level than the exponential edge line. Both decrease gradually at the same rate until day 1,700. Two equations are on the graph, as follows: y equals 305.58e raised to the power of -7E minus 04x and R squared equals 0.8991.
Figure 71. Graph. Retroreflectivity degradation section 1 TN-N
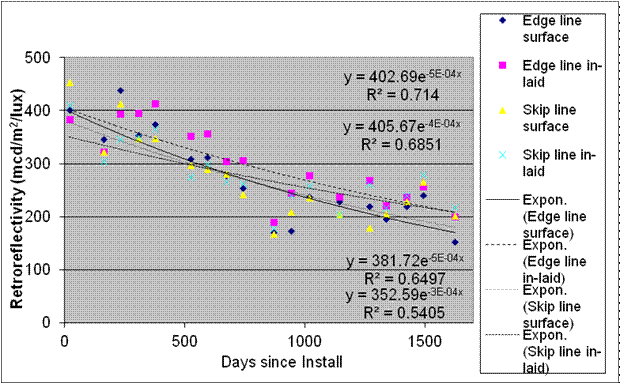
This graph shows the retroreflectivity degradation for section 2 TN-N on the Nashville, TN, test deck. Retroreflectivity is on the y-axis ranging from 0 to 500 mcd/m2/lux, and days since installation is on the x-axis from 0 to 1,700 days for edge line surface, edge line inlaid, skip line surface, skip line inlaid, exponential edge line surface, exponential edge line inlaid, exponential skip line surface, and exponential skip line inlaid. On day 0, the skip line surface is shown at a slightly higher retroreflectivity level. All decrease gradually at the same rate until day 1,700. Four sets of equations are on the graph. The first set includes the following: y equals 402.69e raised to the power of -5E minus 04x and R squared equals 0.714. The second set includes the following: y equals 405.67e raised to the power of -4E minus 04x and R squared equals 0.6851. The third set includes the following: y equals 381.72e raised to the power of -5E minus 04x and R squared equals 0.6497. The fourth set includes the following: y equals 352.59e raised to the power of -3E minus 04x and R squared equals 0.5405.
Figure 72. Graph. Retroreflectivity degradation section 2 TN-N
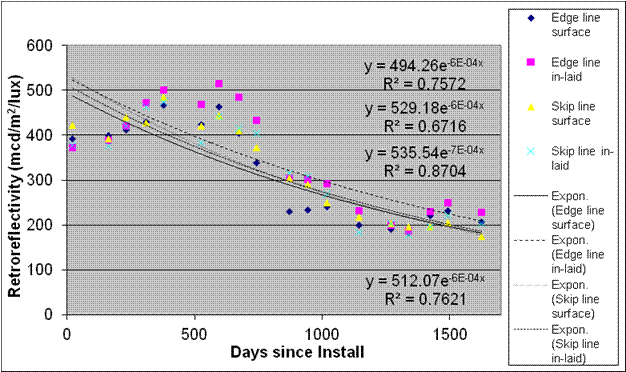
This graph shows the retroreflectivity degradation for section 3 TN-N on the Nashville, TN, test deck. Retroreflectivity is on the y-axis ranging from 0 to 600 mcd/m2/lux, and days since installation is on the x-axis ranging from 0 to 1,700 days for edge line surface, edge line inlaid, skip line surface, skip line inlaid, exponential edge line surface, exponential edge line inlaid, exponential skip line surface, and exponential skip line inlaid. On day 0, the four edge and skip lines are shown at about the same retroreflectivity level. They all increase slightly near day 500, decrease markedly near day 1,000, and decrease gradually until day 1,700. On day 0, the four exponential edge and skip lines are shown at a higher level than the four edge and skip lines and then all decrease gradually until day 1,700. Four sets of equations are on the graph. The first set includes the following: y equals 494.26e raised to the power of -6E minus 04x and R squared equals 0.7572. The second set includes the following: y equals 529.18e raised to the power of -6E minus 04x and R squared equals 0.6716. The third set includes the following: y equals 535.54e raised to the power of -7E minus 04x and R squared equals 0.8704. The fourth set includes the following: y equals 512.07e raised to the power of -6E minus 04x and R squared equals 0.7612.
Figure 73. Graph. Retroreflectivity degradation section 3 TN-N
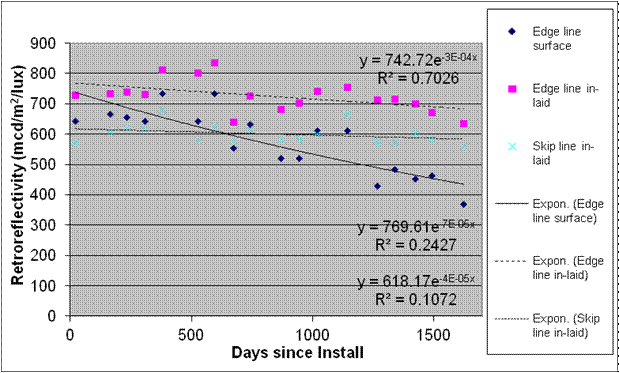
This graph shows the retroreflectivity degradation for section 4 TN-N on the Nashville, TN, test deck. Retroreflectivity is on the y-axis ranging from 0 to 900 mcd/m2/lux, and days since installation is on the x-axis ranging from 0 to 1,700 days for edge line surface, edge line inlaid, skip line inlaid, exponential edge line surface, exponential edge line inlaid, and exponential skip line inlaid. On day 0, the edge line inlaid is shown at a slightly higher retroreflectivity level than the skip line inlaid and edge line surface. The edge line inlaid remains at about the same level until day 1,700, with the skip line inlaid decreasing somewhat and the edge line surface decreasing significantly until day 1,700. On day 0, exponential edge line inlaid is shown at a higher level than the exponential edge line inlaid, and exponential skip line inlaid. The exponential edge line inlaid and exponential edge line inlaid remain at about the same level, with the exponential edge line surface decreasing significantly until day 1,700. Three sets of equations are on the graph. The first set includes the following: y equals 742.72e raised to the power of -3E minus 04x and R squared equals 0.7026. The second set includes the following: y equals 769.61e raised to the power of -7E minus 05x and R squared equals 0.2427. The third set includes the following: y equals 618.17e raised to the power of -4E minus 05x and R squared equals 0.1072.
Figure 74. Graph. Retroreflectivity degradation section 4 TN-N
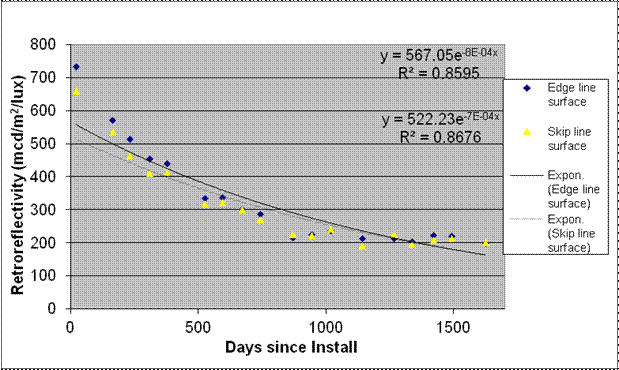
This graph shows the retroreflectivity degradation for section 5 TN-N on the Nashville, TN, test deck. Retroreflectivity is on the y-axis ranging from 0 to 800 mcd/m2/lux, and days since installation is on the x-axis ranging from 0 to 1,700 days for edge line surface, skip line surface, exponential edge line surface, and exponential skip line surface. On day 0, edge line surface is highest, followed by skip line surface, then the two exponential lines. All decrease gradually at the same rate until day 1,700. Two sets of equations are on the graph. The first set includes the following: y equals 567.05e raised to the power of -8E minus 04x and R squared equals 0.8595. The second set includes the following: y equals 522.23e raised to the power of -7E minus 04x and R squared equals 0.8676.
Figure 75. Graph. Retroreflectivity degradation section 5 TN-N
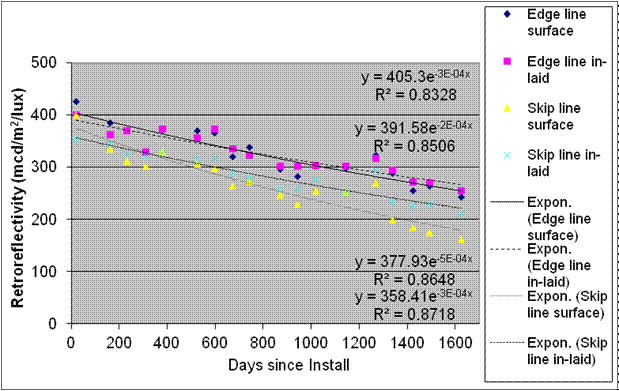
This graph shows the retroreflectivity degradation for section 6 TN-N on the Nashville, TN, test deck. Retroreflectivity is on the y-axis ranging from 0 to 500 mcd/m2/lux, and days since installation is on the x-axis ranging from 0 to 1,600 days for edge line surface, edge line inlaid, skip line surface, skip line inlaid, exponential edge line surface, exponential edge line inlaid, exponential skip line surface, and exponential skip line inlaid. On day 0, all eight surfaces and lines are shown at about the same retroreflectivity level and all decrease gradually at the same rate until day 1,600. Four sets of equations are on the graph. The first set includes the following: y equals 405.3e raised to the power of -3E minus 04x and R squared equals 0.8328. The second set includes the following: y equals 391.58e raised to the power of -2E minus 04x and R squared equals 0.8506. The third set includes the following: y equals 377.93e raised to the power of -5E minus 04x and R squared equals 0.8648. The fourth set includes the following: y equals 358.41e raised to the power of -3E minus 04x and R squared equals 0.8718.
Figure 76. Graph. Retroreflectivity degradation section 6 TN-N
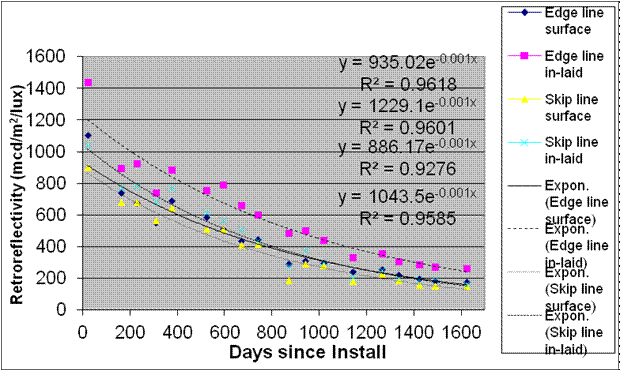
This graph shows the retroreflectivity degradation for section 7 TN-N on the Nashville, TN, test deck. Retroreflectivity is in the y-axis ranging from 0 to 1,600 mcd/m2/lux, and days since installation is on the x-axis ranging from 0 to 1,600 days for edge line surface, edge line inlaid, skip line surface, skip line inlaid, exponential edge line surface, exponential edge line inlaid, exponential skip line surface, and exponential skip line inlaid. On day 0, edge line surface is shown at a higher retroreflectivity level than the other seven surfaces and lines, which are shown at about the same retroreflectivity level. All eight decrease gradually at the same rate until day 1,600. Four sets of equations are on the graph. The first set includes the following: y equals 935.02e raised to the power of -0.001x and R squared equals 0.9618. The second set includes the following: y equals 1,229.1e raised to the power of -0.001x and R squared equals 0.9601. The third set includes the following: y equals 886.17e raised to the power of -0.001x and R squared equals 0.9276. The fourth set includes the following: y equals 1,043.5e raised to the power of -0.001x and R squared equals 0.9585.
Figure 77. Graph. Retroreflectivity degradation section 7 TN-N
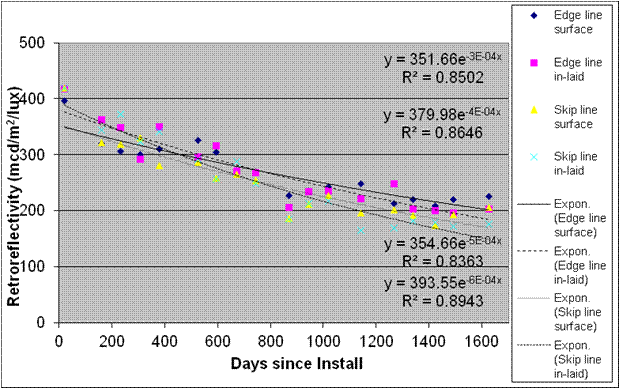
This graph shows the retroreflectivity degradation for section 8 TN-N on the Nashville, TN, test deck. Retroreflectivity is on the y-axis ranging from 0 to 500 mcd/m2/lux, and days since installation is on the x-axis ranging from 0 to 1,600 days for edge line surface, edge line inlaid, skip line surface, skip line inlaid, exponential edge line surface, exponential edge line inlaid, exponential skip line surface, and exponential skip line inlaid. On day 0, all eight surfaces and lines are shown at about the same retroreflectivity level and all decrease gradually at the same rate until day 1,600. Four sets of equations are on the graph. The first set includes the following: y equals 351.66e raised to the power of -3E minus 04x and R squared equals 0.8502. The second set includes the following: y equals 379.98e raised to the power of -4E minus 04x and R squared equals 0.8646. The third set includes the following: y equals 354.66e raised to the power of -5E minus 04x and R squared equals 0.8363. The fourth set includes the following: y equals 393.55e raised to the power of -6E minus 04x and R squared equals 0.8943.
Figure 78. Graph. Retroreflectivity degradation section 8 TN-N
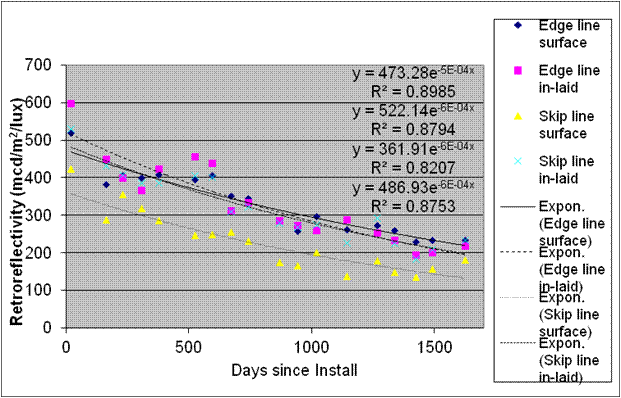
This graph shows the retroreflectivity degradation for section 9 TN-N on the Nashville, TN, test deck. Retroreflectivity is in the y-axis ranging from 0 to 700 mcd/m2/lux, and days since installation is on the x-axis ranging from 0 to 1,700 days for edge line surface, edge line inlaid, skip line surface, skip line inlaid, exponential edge line surface, exponential edge line inlaid, exponential skip line surface, and exponential skip line inlaid. On day 0, edge line inlaid is shown at a higher retroreflectivity level, and exponential skip line surface is shown at a lower retroreflectivity level than the other six surfaces and lines, which are shown at about the same retroreflectivity level. All eight decrease gradually at the same rate until day 1,700. Four sets of equations are on the graph. The first set includes the following: y equals 473.28e raised to the power of -5E minus 04x and R squared equals 0.8985. The second set includes the following: y equals 522.14e raised to the power of -6E minus 04x and R squared equals 0.8794. The third set includes the following: y equals 361.91e raised to the power of -6E minus 04x and R squared equals 0.8207. The fourth set includes the following: y equals 486.93e raised to the power of -6E minus 04x and R squared equals 0.8753.
Figure 79. Graph. Retroreflectivity degradation section 9 TN-N
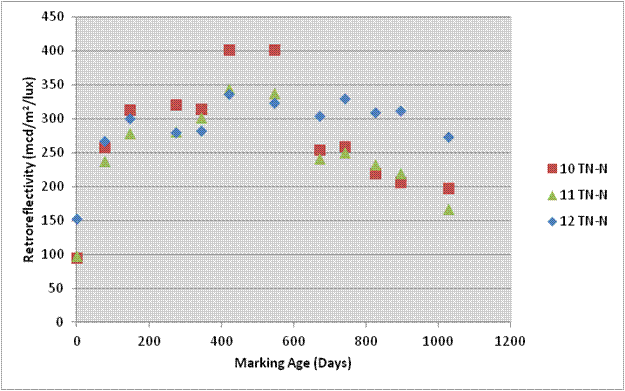
This graph shows the retroreflectivity degradation for sections 10 -12 TN-N on the Nashville, TN, test deck. Retroreflectivity is on the y-axis ranging from 0 to 450 mcd/m2/lux, and marking age is on the x-axis ranging from 0 to 1,000 marking days for sections 10 TN-N, 11 TN-N, and 12 TN-N. On day 0, section 12 TN-N is shown at a higher retroreflectivity level than the other two sections. The retroreflectivity levels for all three increase until day 200. The retroreflectivity levels for sections 10 TN-N and 11 TN-N increase until day 600 and decrease until day 1,000. The retroreflectivity level for section 12 TN-N continues at about the same retroreflectivity level until day 1,000.
Figure 80. Graph. Retroreflectivity degradation sections 10 TN-N, 11 TN-N, and 12 TN-N
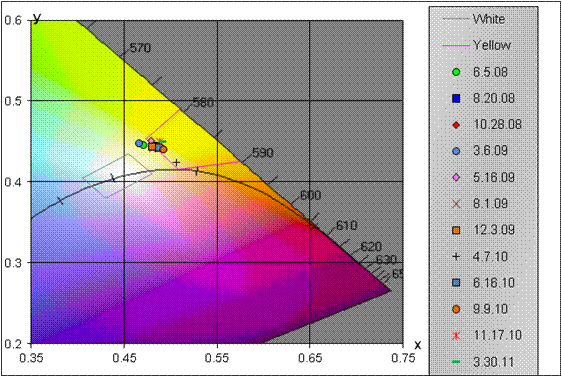
This graph shows the nighttime 98-ft (30-m) color degradation for section 10 TN-N on the Nashville, TN, test deck. The graph has an x-axis ranging from 0.35 to 0.75 and a y-axis ranging from 0.2 to 0.6. The graph shows trapezoids for white and yellow pavement marking colors. Twelve points on the graph correspond to dates from June 5, 2008, to March 30, 2011. All 12 points are clustered on the line designated for yellow at coordinates x equals 0.47 and y equals 0.45.
Figure 81. Graph. Nighttime 98-ft (30-m) color degradation section 10 TN-N
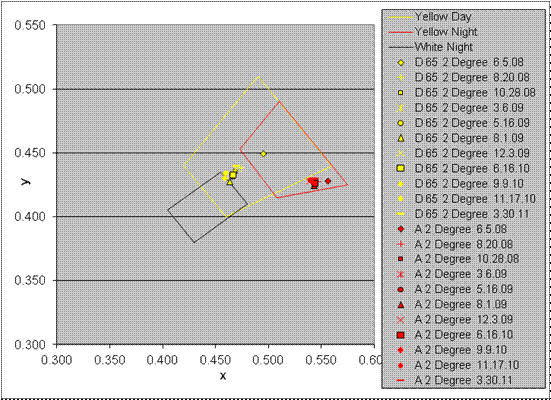
This graph shows the 45-degree/0-degree color degradation for section 10 TN-N on the Nashville, TN, test deck. The graph has an x-axis ranging from 0.300 to 0.600 and a y-axis ranging from 0.300 to 0.550. The graph shows trapezoids for yellow day, yellow night, and white night pavement marking colors. In total, 22 points correspond to dates from June 5, 2008, to March 30, 2011, for both yellow day and yellow night. The 11 yellow day points are clustered on the top line of the trapezoid for white night at coordinates x equals 0.450 and y equals 0.425. The 11 yellow night points are clustered on the bottom line of the trapezoid for yellow night at coordinates x equals 0.550 and y equals 0.400.
Figure 82. Graph. 45-degree/0-degree color degradation section 10 TN-N
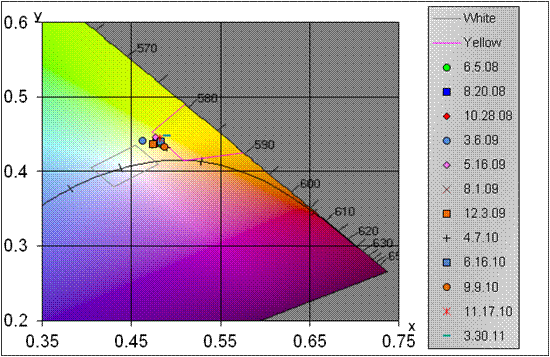
This graph shows the nighttime 98-ft (30-m) color degradation for section 11 TN-N on the Nashville, TN, test deck. The graph has an x-axis ranging from 0.35 to 0.75 and a y-axis ranging from 0.2 to 0.6. The graph shows trapezoids for white and yellow pavement marking colors. Twelve points correspond to dates ranging from June 5, 2008, to March 30, 2011. All 12 points are clustered on the line designated for yellow at coordinates x equals 0.47 and y equals 0.45.
Figure 83. Graph. Nighttime 98-ft (30-m) color degradation section 11 TN-N
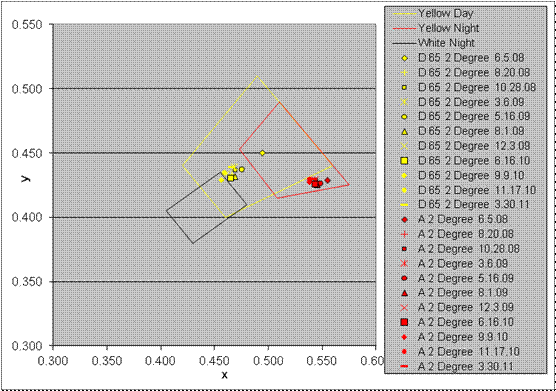
This graph shows the 45-degree/0-degree color degradation for section 11 TN-N on the Nashville, TN, test deck. The graph has an x-axis ranging from 0.300 to 0.600 and a y-axis ranging from 0.300 to 0.550. The graph shows trapezoids for yellow day, yellow night, and white night pavement marking colors. In total, 22 points correspond to dates from June 5, 2008, to March 30, 2011, for both yellow day and yellow night. The 11 yellow day points are clustered on the top line of the trapezoid for white night at coordinates x equals 0.450 and y equals 0.425. The 11 yellow night points are clustered on the bottom line of the trapezoid for yellow night at coordinates x equals 0.550 and y equals 0.400.
Figure 84. Graph. 45-degree/0-degree color degradation section 11 TN-N
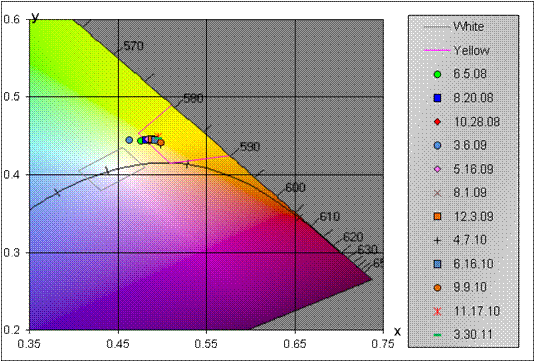
This graph shows the nighttime 98-ft (30-m) color degradation for section 12 TN-N on the Nashville, TN, test deck. The graph has an x-axis ranging from 0.35 to 0.75 and a y-axis ranging from 0.2 to 0.6. The graph shows trapezoids for white and yellow pavement marking colors. Twelve points correspond to dates from June 5, 2008, to March 30, 2011. All 12 points are clustered on the line designated for yellow at coordinates x equals 0.47 and y equals 0.45.
Figure 85. Graph. Nighttime 98-ft (30-m) color degradation section 12 TN-N
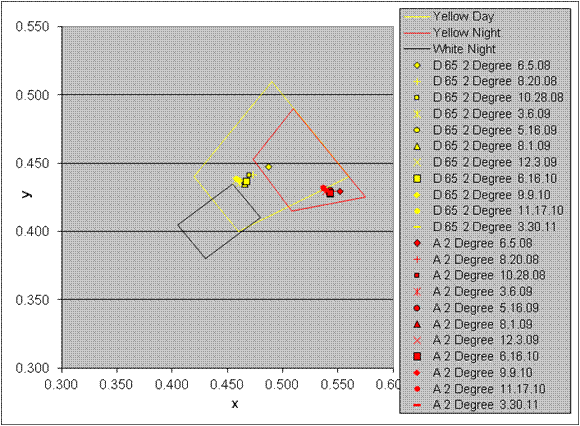
This graph shows the 45-degree/0-degree color degradation for section 12 TN-N on the Nashville, TN, test deck. The graph has an x-axis ranging from 0.300 to 0.600 and a y-axis ranging from 0.300 to 0.550. The graph shows trapezoids for yellow day, yellow night, and white night pavement marking colors. In total, 22 points correspond to dates from June 5, 2008, to March 30, 2011, for both yellow day and yellow night. The 11 yellow day points are clustered just above the top line for the trapezoid for white night at coordinates x equals 0.450 and y equals 0.440. The 11 yellow night points are clustered just above the bottom line of the trapezoid for yellow night at coordinates x equals 0.550 and y equals 0.425.
Figure 86. Graph. 45-degree/0-degree color degradation section 12 TN-N
TUSCULUM, TN, TEST DECK

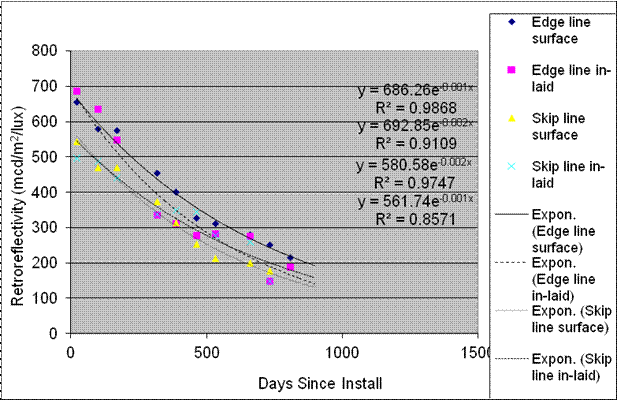
This graph shows the retroreflectivity degradation for section 1 TN-T on the Tusculum, TN, test deck. Retroreflectivity is on the y-axis ranging from 0 to 800 mcd/m2/lux, and days since installation is on the x-axis ranging from 0 to 1,000 days for edge line surface, edge line inlaid, skip line surface, skip line inlaid, exponential edge line surface, exponential edge line inlaid, exponential skip line surface, and exponential skip line inlaid. On day 0, edge line inlaid is shown at the highest retroreflectivity level, and all eight surfaces and lines decrease gradually at the same rate until day 1,000. Four sets of equations are on the graph. The first set includes the following: y equals 686.26e raised to the power of -0.001x and R squared equals 0.9868. The second set includes the following: y equals 692.85e raised to the power of -0.002x and R squared equals 0.9109. The third set includes the following: y equals 580.58e raised to the power of -0.002x and R squared equals 0.9747. The fourth set includes the following: y equals 561.74e raised to the power of -0.001x and R squared equals 0.8571.
Figure 87. Graph. Retroreflectivity degradation section 1 TN-T
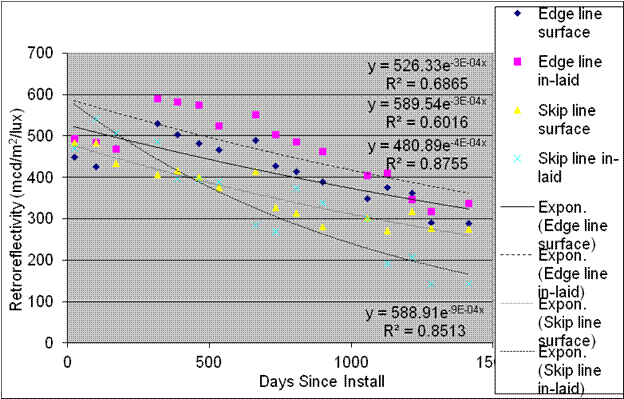
This graph shows the retroreflectivity degradation for section 2 TN-T a on the Tusculum, TN, test deck. Retroreflectivity is on the y-axis ranging from 0 to 700 mcd/m2/lux, and days since installation is on the x-axis ranging from 0 to 1,500 days for edge line surface, edge line inlaid, skip line surface, skip line inlaid, exponential edge line surface, exponential edge line inlaid, exponential skip line surface, and exponential skip line inlaid. On day 0, the four exponential lines and surfaces are shown at about the same retroreflectivity level and gradually decrease until day 1,500. On day 0, the four lines and surfaces are shown at about the same retroreflectivity level. Edge line inlaid and edge line surface increase to a higher retroreflectivity level at day 400 and gradually decrease until day 1,500. The retroreflectivity levels of skip line surface and skip line inlaid both decrease to lower retroreflectivity levels by day 500 and continue to decrease to the lowest levels at day 1,500. Four sets of equations are on the graph. The first set includes the following: y equals 526.33e raised to the power of -3E minus 04x and R squared equals 0.6865. The second set includes the following: y equals 589.54e raised to the power of -3E minus 04x and R squared equals 0.6016. The third set includes the following: y equals 480.89e raised to the power of -4E minus 04x and R squared equals 0.8755. The fourth set includes the following: y equals 588.91e raised to the power of -9E minus 04x and R squared equals 0.8513.
Figure 88. Graph. Retroreflectivity degradation section 2 TN-T a
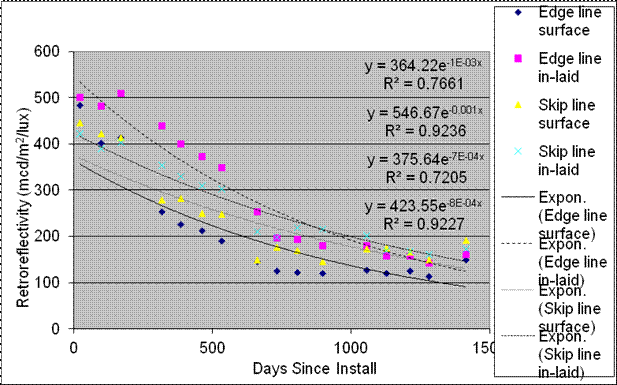
This graph shows the retroreflectivity degradation for section 2 TN-T b for the Tusculum, TN, test deck. Retroreflectivity is on the y-axis ranging from 0 to 600 mcd/m2/lux, and days since installation is on the x-axis ranging from 0 to 1,500 days for edge line surface, edge line inlaid, skip line surface, skip line inlaid, exponential edge line surface, exponential edge line inlaid, exponential skip line surface, and exponential skip line inlaid. On day 0, edge line inlaid and exponential edge line inlaid are shown at higher retroreflectivity levels than the other six lines and surfaces. All eight lines and surfaces decrease to about the same retroreflectivity level at day 1,500. Four sets of equations are on the graph. The first set includes the following: y equals 364.22e raised to the power of -1E minus 03x and R squared equals 0.7661. The second set includes the following: y equals 546.67e raised to the power of -0.001x and R squared equals 0.9236. The third set includes the following: y equals 375.64e raised to the power of -7E minus 04x and R squared equals 0.7205. The fourth set includes the following: y equals 423.55e raised to the power of -8E minus 04x and R squared equals 0.9227.
Figure 89. Graph. Retroreflectivity degradation section 2 TN-T b
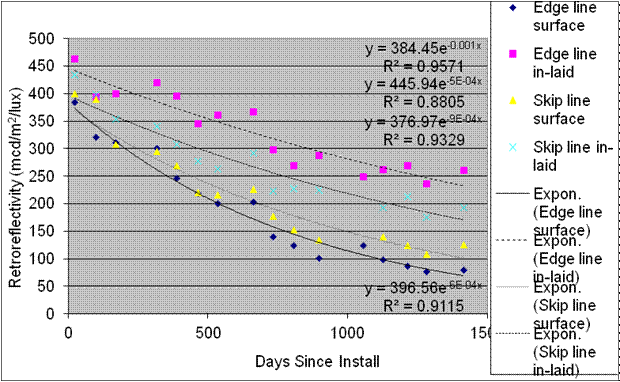
This graph shows the retroreflectivity degradation for section 3 TN-T on the Tusculum, TN, test deck. Retroreflectivity is on the y-axis ranging from 0 to 500 mcd/m2/lux, and days since installation is on the x-axis ranging from 0 to 1,500 days for edge line surface, edge line inlaid, skip line surface, skip line inlaid, exponential edge line surface, exponential edge line inlaid, exponential skip line surface, and exponential skip line inlaid. On day 0, all eight surfaces and lines are shown at about the same retroreflectivity level. All decrease gradually until day 1,500, with edge line inlaid at the highest retroreflectivity level and exponential edge line surface at the lowest. Four sets of equations are on the graph. The first set includes the following: y equals 384.45e raised to the power of -0.001x and R squared equals 0.9571. The second set includes the following: y equals 445.94e raised to the power of -5E minus 04x and R squared equals 0.8805. The third set includes the following: y equals 376.97e raised to the power of -9E minus 04x and R squared equals 0.9329. The fourth set includes the following: 396.56e raised to the power of -6E minus 04x and R squared equals 0.9115.
Figure 90. Graph. Retroreflectivity degradation section 3 TN-T
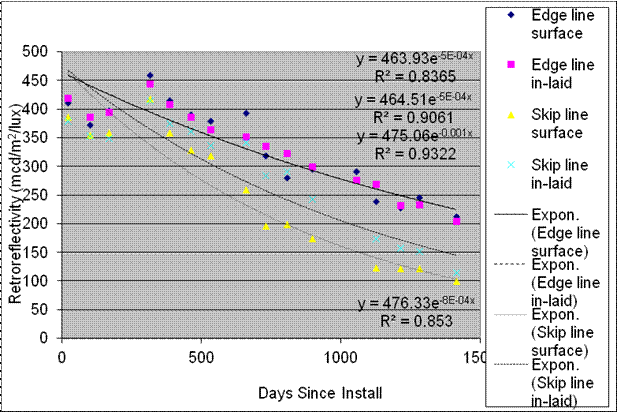
This graph shows the retroreflectivity degradation for section 4 TN-T on the Tusculum, TN, test deck. Retroreflectivity is on the y-axis ranging from 0 to 500 mcd/m2/lux, and days since installation is on the x-axis ranging from 0 to 1,500 days for edge line surface, edge line inlaid, skip line surface, skip line inlaid, exponential edge line surface, exponential edge line inlaid, exponential skip line surface, and exponential skip line inlaid. On day 0, the four exponential lines and surfaces are shown at about the same retroreflectivity level. The retroreflectivity levels for all four gradually decrease until day 1,500 but with exponential edge line surface and exponential edge line inlaid at the same level and higher than the other two exponentials. On day 0, the four lines and surfaces are shown at a lower retroreflectivity level than the exponentials. The retroreflectivity levels for all four increase at day 400 and then gradually decrease until day 1,500, with the two edge lines at higher levels than the two skip lines. Four sets of equations are on the graph. The first set includes the following: y equals 463.93e raised to the power of -5E minus 04x and R squared equals 0. The second set includes the following: y equals 464.51e raised to the power of -5E minus 04x and R squared equals 0.9061. The third set includes the following: y equals 475.06e raised to the power of -0.001x and R squared equals 0.9322. The fourth set includes the following: y equals 476.33e raised to the power of -8E minus 04x and R squared equals 0.853.
Figure 91. Graph. Retroreflectivity degradation section 4 TN-T
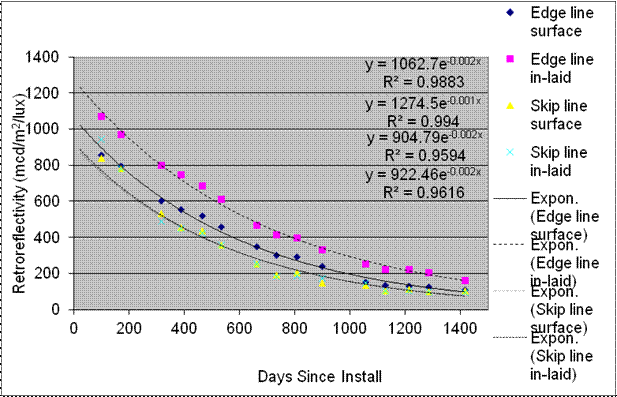
This graph shows the retroreflectivity degradation for section 5 TN-T a on the Tusculum, TN, test deck. Retroreflectivity is on the y-axis ranging from 0 to 1,400 mcd/m2/lux, and days since installation are on the x-axis ranging from 0 to 1,400 days for edge line surface, edge line inlaid, skip line surface, skip line inlaid, exponential edge line surface, exponential edge line inlaid, exponential skip line surface, and exponential skip line inlaid. On day 0, edge line inlaid and exponential edge line inlaid are shown at the highest retroreflectivity levels, with edge line surface and exponential edge line surface at a lower level and skip line surface, skip line inlaid, exponential skip line surface, and exponential skip line inlaid at the lowest level. All eight lines and surfaces decrease gradually and are shown at the same retroreflectivity level on day 1,400. Four sets of equations are on the graph. The first set includes the following: y equals 1,062.7e raised to the power of -0.002x and R squared equals 0.9883. The second set includes the following: y equals 1,274.5e raised to the power of -0.001x and R squared equals 0.994. The third set includes the following: y equals 904.79e raised to the power of -0.002x and R squared equals 0.9594. The fourth set includes the following: y equals 922.46e raised to the power of -0.002x and R squared equals 0.9616.
Figure 92. Graph. Retroreflectivity degradation section 5 TN-T a
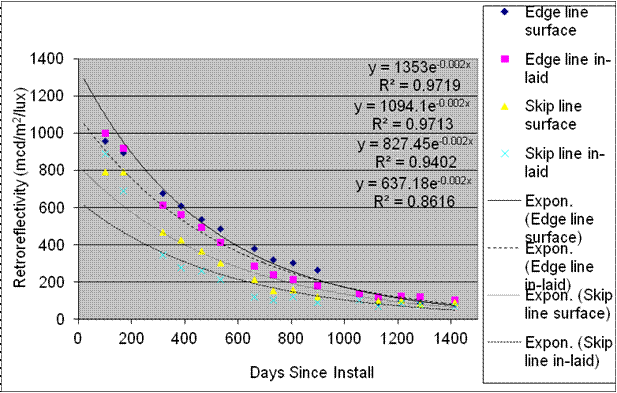
This graph shows the retroreflectivity degradation for section 5 TN-T b on the Tusculum, TN, test deck. Retroreflectivity is on the y-axis ranging from 0 to 1,400 mcd/m2/lux, and days since installation is on the x-axis ranging from 0 to 1,400 days for edge line surface, edge line inlaid, skip line surface, skip line inlaid, exponential edge line surface, exponential edge line inlaid, exponential skip line surface, and exponential skip line inlaid. On day 0, the four exponential lines and surfaces are shown at widely varying retroreflectivity levels, with exponential edge line surface at the highest level above exponential edge line inlaid, exponential skip line surface, and exponential skip line inlaid. All four exponentials decrease and are shown at the same retroreflectivity level on day 1,400. The four lines and surfaces are shown at retroreflectivity levels lower than the exponential edge line surface but above the other exponentials. These four lines and surfaces decrease and are shown at the same retroreflectivity level on day 1,400. Four sets of equations are on the graph. The first set includes the following: y equals 1,353e raised to the power of -0.002x and R squared equals 0.9719. The second set includes the following: y equals 1,094.1e raised to the power of -0.002x and R squared equals 0.9713. The third set includes the following: y equals 827.45e raised to the power of -0.002x and R squared equals 0.9402. The fourth set includes the following: y equals 637.18e raised to the power of -0.002x and R squared equals 0.8616.
Figure 93. Graph. Retroreflectivity degradation section 5 TN-T b
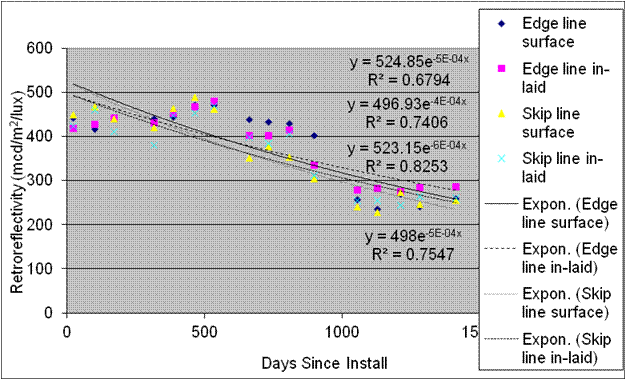
This graph shows the retroreflectivity degradation for section 6 TN-T on the Tusculum, TN, test deck. Retroreflectivity is shown on the y-axis ranging from 0 to 600 mcd/m2/lux, and days since installation is shown on the x-axis ranging from 0 to 1,500 days for edge line surface, edge line inlaid, skip line surface, skip line inlaid, exponential edge line surface, exponential edge line inlaid, exponential skip line surface, and exponential skip line inlaid. On day 0, the four exponential lines and surfaces are shown at the same retroreflectivity level and decrease slightly at the same rate until day 1,500. The four lines and surfaces are shown at a retroreflectivity level slightly lower than the four exponentials. They increase to a higher retroreflectivity level at day 500 and then all decrease and are shown at the same level on day 1,500. Four sets of equations are on the graph. The first set includes the following: y equals 524.85e raised to the power of -5E minus 04x and R squared equals 0.6794. The second set includes the following: y equals 496.93e raised to the power of -4E minus 04x and R squared equals 0.7406. The third set includes the following: y equals 523.15e raised to the power of -6E minus 04x and R squared equals 0.8253. The fourth set includes the following: y equals 498e raised to the power of -5E minus 04x and R squared equals 0.7547.
Figure 94. Graph. Retroreflectivity degradation section 6 TN-T
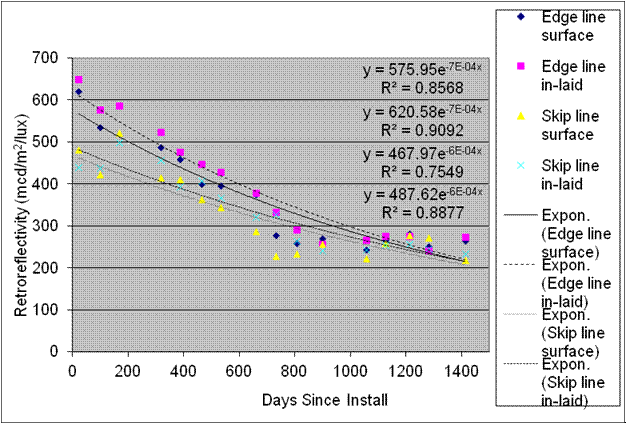
This graph shows the retroreflectivity degradation for section 7 TN-T on the Tusculum, TN, test deck. Retroreflectivity is on the y-axis ranging from 0 to 700 mcd/m2/lux, and days since installation is on the x-axis ranging from 0 to 1,400 days for edge line surface, edge line inlaid, skip line surface, skip line inlaid, exponential edge line surface, exponential edge line inlaid, exponential skip line surface, and exponential skip line inlaid. On day 0, edge line inlaid is shown at the highest retroreflectivity level, slightly above edge line surface and exponential edge line inlaid, with the other lines and surfaces at slightly lower levels. They all decrease gradually and are at the same retroreflectivity level on day 1,400. Four sets of equations are on the graph. The first set includes the following: y equals 575.95e raised to the power of -7E minus 04x and R squared equals 0.8568. The second set includes the following: y equals 620.58e raised to the power of -7E minus 04x and R squared equals 0.9092. The third set includes the following: y equals 467.97e raised to the power of -6E minus 04x and R squared equals 0.7549. The fourth set includes the following: y equals 487.62e raised to the power of -6E minus 04x and R squared equals 0.8877.
Figure 95. Graph. Retroreflectivity degradation section 7 TN-T


Federal Highway Administration | 1200 New Jersey Avenue, SE | Washington, DC 20590 | 202-366-4000
Turner-Fairbank Highway Research Center | 6300 Georgetown Pike | McLean, VA | 22101