U.S. Department of Transportation
Federal Highway Administration
1200 New Jersey Avenue, SE
Washington, DC 20590
202-366-4000
Federal Highway Administration Research and Technology
Coordinating, Developing, and Delivering Highway Transportation Innovations
| REPORT |
| This report is an archived publication and may contain dated technical, contact, and link information |
|
| Publication Number: FHWA-HRT-12-048 Date: November 2013 |
Publication Number: FHWA-HRT-12-048 Date: November 2013 |
Pavement markings enhance public safety by providing both orientation and guidance to roadway users. However, providing visible markings year-round is a considerable challenge to roadway agencies given the harsh conditions in which they must perform. These conditions include both wear and tear from traffic, winter operations, and roadway surface conditions. As an example, figure 100 and figure 101 show a pavement marking in Alaska, both when a new edge line was installed in 2006 and the resulting damage 2 years later in 2008.
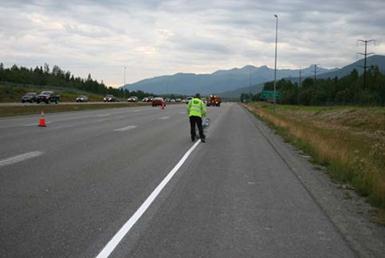
Figure 100. Photo. Pavement marking installed in Alaska in 2006
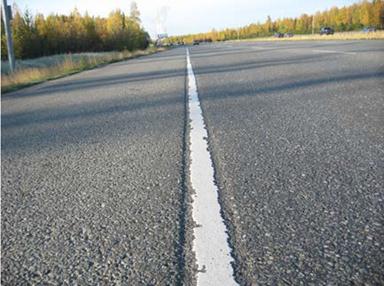
Figure 101. Photo. Pavement marking after 2 years in Alaska in 2008
Agencies must also select the most effective pavement marking and optical bead package for each roadway condition and ensure a high-quality installation. As shown in figure 102 and figure 103, the installation process involves placing both the marking material and glass beads appropriately while driving with traffic along the roadway.

Figure 102. Photo. Pavement marking installation
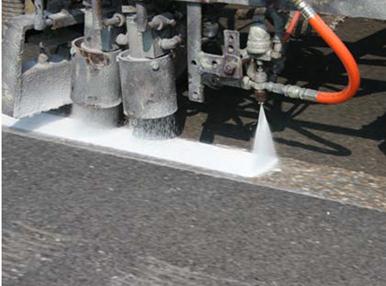
Figure 103. Photo. Close-up of pavement marking installation
It is common to experience a wide variation in marking practices and policies even among adjacent States in similar regions. Agencies are constantly trying to balance resources between traditional and more expensive durable materials in the face of existing policies, user needs, construction seasons, and climate conditions.
This chapter summarizes a prototype PMST developed as part of this project, which is based on the results of two Tennessee test decks (Nashville and Tusculum) that were evaluated between 2006 and 2011.
The concept behind the PMST is to provide practitioners with a prototype tool that would assist in the selection of pavement markings based on the demonstrated product performances of different materials from the two Tennessee test decks. The tool is interactive and provides users with pavement marking material options based on a desired performance level.
Two pavement marking test decks were installed in Tennessee with cooperation from TDOT. In 2006, a test deck was installed near Nashville, TN, on SR 840. The test deck consisted of 9 different pavement marking materials, and the roadway has an AADT of 19,000. Winter operations for this test deck are considered minimal. The second test deck is in northeastern Tennessee on SR 340 near Tusculum, TN. The test deck again consisted of 9 different pavement marking materials, and the roadway has an AADT of 12,000. Winter operations for this test deck are considered minimal.
Retroreflectivity data were collected using a handheld pavement marking retroreflectometer and a mobile retroreflectometer. The handheld retroreflectometer only measures edge line markings, whereas the mobile retroreflectometer measures both edge line and lane line markings. All retroreflectivity measurements were collected in dry conditions. Photographic images of each section were taken using a digital camera to document the change in daytime presence over time.
Retroreflectivity data were collected roughly every 3 months for each test deck, as shown in table 104 and table 105.
Table 104. Nashville, TN, test deck evaluation data collection periods.
Day |
Date |
|---|---|
21 |
January 2000 |
162 |
June 2000 |
231 |
August 2000 |
308 |
November 2000 |
378 |
January 2001 |
525 |
June 2001 |
595 |
August 2001 |
672 |
November 2001 |
742 |
January 2002 |
870 |
May 2002 |
942 |
July 2002 |
1,018 |
October 2002 |
1,142 |
February 2003 |
1,267 |
June 2003 |
1,337 |
August 2003 |
1,422 |
November 2003 |
1,491 |
January 2004 |
1,624 |
June 2004 |
Table 105. Tusculum, TN, test deck evaluation data collection periods.
Day |
Date |
|---|---|
22 |
January 2000 |
99 |
April 2000 |
169 |
June 2000 |
316 |
November 2000 |
386 |
January 2001 |
463 |
April 2001 |
533 |
June 2001 |
661 |
October 2001 |
732 |
January 2002 |
807 |
March 2002 |
898 |
June 2002 |
1,056 |
November 2002 |
1,126 |
January 2003 |
1,213 |
April 2003 |
1,282 |
July 2003 |
1,414 |
November 2003 |
Table 106 and table 107 show the summarized retroreflectivity results for each Tennessee test deck by product type, installation style (eradicated/inlaid), and by the number of days after installation.
As shown in table 106, initial retroreflectivity values for the Nashville test deck ranged from 1,411 to 366 mcd. After 1,624 days, these values had dropped to a range of 644 to 105 mcd. Note that the test markings degraded at different rates, both by product and installation method, so the rank order of the products by retroreflectivity did not remain the same at the end of the evaluation as at the beginning. Some trends are evident in the various products' performance relative to the group over time, and some differences can be seen between application methods for the same product. For example, the extruded thermo performance was significantly better for the inlaid application (644 mcd) versus eradicated (371 mcd). The loss in retroreflectivity after 1,624 days ranged from 12 percent (extruded thermo, inlaid) up to 77 percent (polyuria, inlaid).
As shown in table 107, initial retroreflectivity values for the Tusculum test deck ranged from 1,152 to 377 mcd. After 1,414 days, these values ranged from 342 to 82 mcd. The modified epoxy material was judged to have failed after the reading on day 807 and was removed from the test. The low-temperature acrylic was significantly better in the inlaid application (246 mcd) versus eradicated (77 mcd). The loss in retroreflectivity after 1,414 days ranged from 34 percent (MMA, Degussa flatline, inlaid) to 92 percent (400 tape, eradicated).
Table 106. Nashville test deck retroreflectivity (mcd).
Materials |
Installation |
Number of Days |
|||||||||||||||||
|---|---|---|---|---|---|---|---|---|---|---|---|---|---|---|---|---|---|---|---|
21 |
162 |
231 |
308 |
378 |
525 |
595 |
672 |
742 |
870 |
942 |
1,018 |
1,142 |
1,267 |
1,337 |
1,422 |
1,491 |
1,624 |
||
Spray thermo |
In rumble stripe |
366 |
279 |
255 |
228 |
237 |
186 |
181 |
137 |
164 |
145 |
136 |
149 |
133 |
130 |
120 |
117 |
114 |
105 |
Eradicated |
413 |
348 |
411 |
357 |
390 |
317 |
314 |
275 |
264 |
170 |
171 |
245 |
231 |
217 |
199 |
224 |
244 |
152 |
|
Inlaid |
405 |
327 |
398 |
394 |
421 |
356 |
353 |
303 |
304 |
191 |
242 |
274 |
241 |
267 |
223 |
244 |
261 |
211 |
|
Eradicated |
394 |
408 |
412 |
440 |
478 |
434 |
475 |
418 |
354 |
241 |
242 |
246 |
205 |
192 |
190 |
221 |
235 |
211 |
|
Inlaid |
375 |
402 |
432 |
473 |
516 |
494 |
535 |
499 |
448 |
332 |
308 |
307 |
234 |
209 |
184 |
229 |
246 |
233 |
|
Extruded thermo |
Eradicated |
643 |
666 |
658 |
644 |
734 |
644 |
736 |
556 |
632 |
520 |
521 |
613 |
612 |
431 |
485 |
454 |
465 |
371 |
Inlaid |
737 |
732 |
740 |
741 |
806 |
774 |
811 |
622 |
729 |
681 |
698 |
737 |
730 |
714 |
721 |
698 |
684 |
644 |
|
Inverted thermo |
Eradicated |
740 |
578 |
524 |
470 |
455 |
342 |
340 |
306 |
291 |
219 |
228 |
239 |
214 |
213 |
208 |
225 |
227 |
200 |
Low-temp acrylic |
Eradicated |
419 |
375 |
375 |
340 |
371 |
370 |
374 |
324 |
338 |
298 |
282 |
302 |
281 |
327 |
291 |
256 |
263 |
218 |
Inlaid |
399 |
367 |
370 |
336 |
368 |
363 |
380 |
335 |
332 |
306 |
304 |
304 |
299 |
326 |
297 |
274 |
274 |
262 |
|
Polyurea |
Eradicated |
1,100 |
758 |
684 |
535 |
697 |
611 |
546 |
445 |
449 |
296 |
312 |
301 |
248 |
267 |
229 |
204 |
188 |
176 |
Inlaid |
1,411 |
889 |
869 |
708 |
835 |
700 |
693 |
581 |
522 |
410 |
426 |
369 |
288 |
308 |
259 |
240 |
230 |
225 |
|
3M AWP |
Eradicated |
393 |
313 |
297 |
280 |
304 |
313 |
299 |
255 |
262 |
220 |
222 |
230 |
228 |
211 |
200 |
192 |
200 |
205 |
Inlaid |
423 |
367 |
351 |
290 |
354 |
316 |
327 |
270 |
271 |
210 |
237 |
237 |
226 |
242 |
207 |
206 |
201 |
207 |
|
High-build paint |
Eradicated |
538 |
403 |
425 |
414 |
429 |
428 |
426 |
376 |
371 |
303 |
277 |
319 |
288 |
302 |
277 |
250 |
254 |
245 |
Inlaid |
559 |
416 |
373 |
353 |
388 |
391 |
384 |
290 |
309 |
258 |
248 |
241 |
251 |
235 |
217 |
181 |
189 |
203 |
|
Note: Eradicated installations were in shallow grooves in the road surface ranging from 55 to 135 mil in depth. Inlaid installations were in grooves ranging from 145 to 270 mil in depth.
Table 107. Tusculum test deck retroreflectivity (mcd).
Materials |
Installation |
Number of Days |
|||||||||||||||
|---|---|---|---|---|---|---|---|---|---|---|---|---|---|---|---|---|---|
22 |
99 |
169 |
316 |
386 |
463 |
533 |
661 |
732 |
807 |
898 |
1,056 |
1,126 |
1,213 |
1,282 |
1,414 |
||
Modified epoxy |
Eradicated |
659 |
581 |
548 |
419 |
361 |
291 |
276 |
246 |
219 |
198 |
|
|
|
|
|
|
Inlaid |
695 |
625 |
549 |
313 |
277 |
253 |
249 |
276 |
153 |
161 |
|
|
|
|
|
|
|
MMA (Degussa)- Flatline |
Eradicated |
449 |
421 |
470 |
526 |
500 |
481 |
463 |
476 |
425 |
413 |
390 |
353 |
372 |
354 |
290 |
281 |
Inlaid |
516 |
504 |
496 |
613 |
602 |
586 |
538 |
573 |
508 |
492 |
473 |
416 |
414 |
367 |
330 |
342 |
|
MMA (Degussa)- Pathfinder |
Eradicated |
485 |
413 |
422 |
263 |
235 |
222 |
197 |
152 |
129 |
123 |
122 |
127 |
119 |
124 |
111 |
150 |
Inlaid |
511 |
493 |
521 |
461 |
419 |
388 |
366 |
263 |
211 |
204 |
188 |
185 |
169 |
163 |
149 |
164 |
|
Low-temp acrylic |
Eradicated |
377 |
308 |
302 |
277 |
230 |
208 |
189 |
185 |
127 |
119 |
98 |
110 |
91 |
82 |
74 |
76 |
Inlaid |
458 |
389 |
396 |
410 |
372 |
335 |
341 |
341 |
276 |
257 |
270 |
250 |
245 |
248 |
218 |
246 |
|
High-build acrylic |
Eradicated |
407 |
376 |
404 |
450 |
411 |
388 |
375 |
385 |
302 |
277 |
289 |
288 |
233 |
225 |
236 |
204 |
Inlaid |
428 |
404 |
408 |
446 |
412 |
381 |
364 |
343 |
306 |
298 |
272 |
256 |
239 |
217 |
204 |
180 |
|
300 tape |
Eradicated |
950 |
857 |
796 |
604 |
555 |
520 |
458 |
350 |
303 |
292 |
242 |
152 |
136 |
131 |
125 |
109 |
Inlaid |
1,152 |
1074 |
972 |
803 |
749 |
688 |
611 |
468 |
418 |
399 |
331 |
253 |
222 |
222 |
207 |
163 |
|
400 tape |
Eradicated |
1,082 |
959 |
894 |
678 |
613 |
540 |
486 |
380 |
322 |
304 |
267 |
106 |
93 |
101 |
88 |
82 |
Inlaid |
1,079 |
1,002 |
922 |
614 |
563 |
496 |
415 |
287 |
239 |
214 |
180 |
138 |
123 |
126 |
120 |
104 |
|
Standard thermo |
Eradicated |
441 |
424 |
447 |
441 |
449 |
473 |
479 |
444 |
441 |
436 |
406 |
273 |
249 |
280 |
249 |
258 |
Inlaid |
433 |
436 |
450 |
432 |
450 |
466 |
476 |
403 |
365 |
361 |
286 |
260 |
272 |
277 |
276 |
285 |
|
Modified urethane |
Eradicated |
645 |
557 |
583 |
478 |
438 |
378 |
374 |
342 |
255 |
239 |
240 |
225 |
242 |
253 |
222 |
241 |
Inlaid |
649 |
571 |
576 |
526 |
466 |
432 |
430 |
374 |
317 |
283 |
253 |
261 |
273 |
276 |
245 |
276 |
|
Note: Eradicated installations were in shallow grooves in the road surface ranging from 25 to 110 mil in depth. Inlaid installations were in grooves ranging from 110 to 320 mil in depth. Blank cells indicate a test deck section where the pavement marking was considered to have failed and was replaced. No further measurements were made on those test sections.
The performance analysis included graphing the performance of each product over time and, as shown in figure 104, considering the impact of grooving versus eradication. A trend analysis was also conducted for each product in an effort to create the performance prediction curves that serve as the engine for the PMST tool (see figure 105).
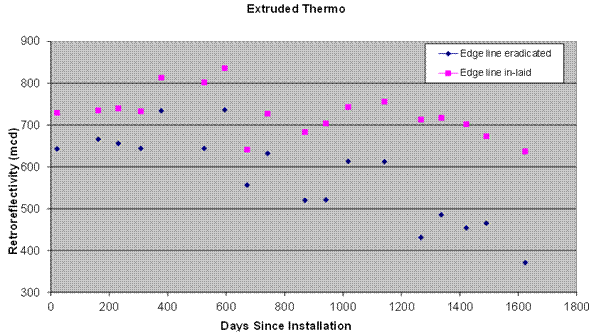
Figure 104. Graph. Eradicated versus inlaid
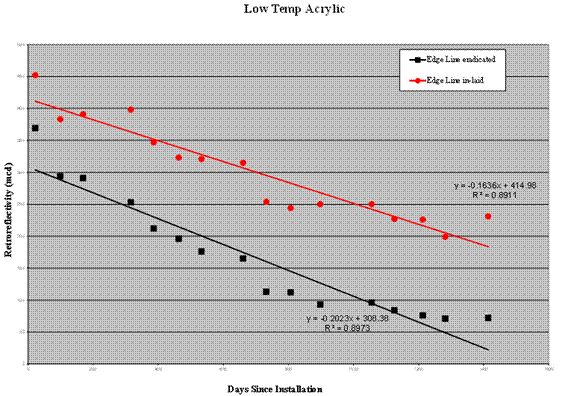
Figure 105. Graph. Trend line analysis of PMST marking materials
To simplify the results, PMST combines the common products from the two Tennessee decks into the list of marking products and glass bead optics shown in table 108.
Table 108. Marking products and glass bead optic specifications.
Product |
Optics Used |
|---|---|
Extruded thermo (90 mil) |
AASHTO M247(33) |
Extruded thermo (120 mil) |
Type 1 and type 4 Visibead plus 2 |
Sprayed thermo |
Type 1 |
High-build acrylic paint |
Type 3 virgin glass |
Low-temperature acrylic |
AASHTO M247(33) |
MMA (splatter) |
AASHTO M247(33) |
MMA (extruded) |
30/50 mesh, 30-30-40 Swarco mega blend |
Modified epoxy |
Type 4 Visibead plus 2, type 1 MnDOT spec |
Modified urethane |
Type 4 Visibead plus 2, type 1 MnDOT spec |
Polyurea |
Prismo high index cluster and Potters type 4 Visibead plus 2 |
The PMST selection engine is based on regression equations that were developed for each pavement marking product. The selection functionality was created as follows:
The use and functionality for the resulting PMST is shown in the following series of figures (see figure 106 through figure 120):
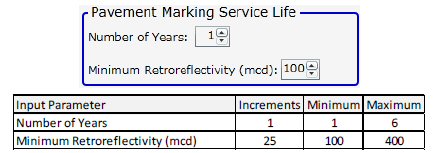
Figure 109. Screenshot. Pavement marking service life inputs
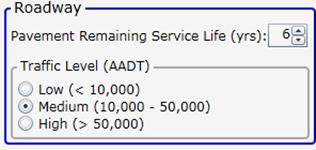
Figure 110. Screenshot. Roadway value inputs
The pavement remaining service life must be higher than the desired years of performance or the software will give a warning message. The input constraints for pavement remaining service life are shown in figure 111.

Figure 111. Screenshot. Input constraints for pavement service life
The base condition and a comparison of five scenarios are shown in figure 114.

Figure 114. Screenshot. "What if" scenarios produced
A summary of changes per scenario, including the base conditions and scenarios 1 -5 is as follows: