U.S. Department of Transportation
Federal Highway Administration
1200 New Jersey Avenue, SE
Washington, DC 20590
202-366-4000
Federal Highway Administration Research and Technology
Coordinating, Developing, and Delivering Highway Transportation Innovations
| REPORT |
| This report is an archived publication and may contain dated technical, contact, and link information |
|
| Publication Number: FHWA-HRT-12-048 Date: November 2013 |
Publication Number: FHWA-HRT-12-048 Date: November 2013 |
The focus of this research was to develop an objective, consistent, repeatable, and quantifiable pavement marking presence tool that would provide the percent of material remaining on an in-service pavement marking utilizing digital images of the markings and image analysis software.
The research team established a number of short- and long-term goals for measuring the amount of pavement marking remaining on different highway segments. This appendix summarizes the short-term findings. Although this publication reports on markings placed on concrete roadways, the tool has been set up to accommodate a variety of pavement surface types, including asphalt and seal-coated roads.
All calculations are based on a digital image of the subject pavement marking along with the identification of the pavement surface type. From this, the program provides the calculation for the percent paint remaining.
Image segmentation is the process of assigning a set of image pixels to regions that have common characteristics. The proposed system tries to segment images of white or yellow pavement markings into foreground (marking) and background (pavement) parts. The system then objectively reports the presence by calculating the percentage of white and yellow paint to the total image area. The system assumes that the image being processed complies with the general rules specified by transportation department protocol (i.e., image resolution, image dimensions, and the number of images taken for a specific segment length) used for detecting presence.
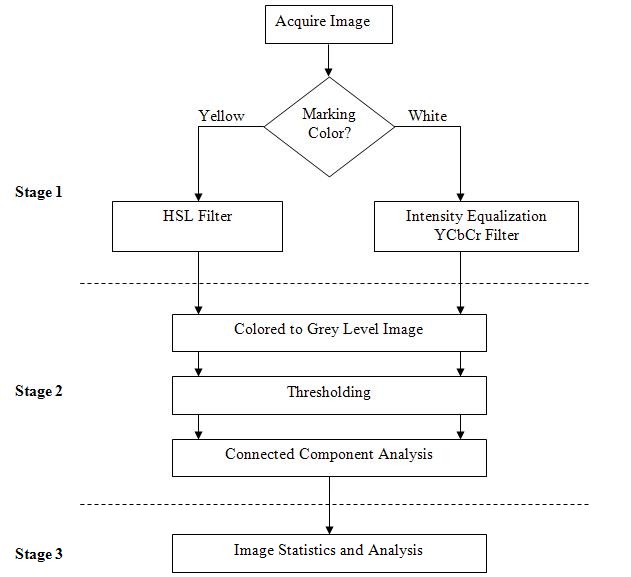
The system consists of three major stages: an image enhancement stage, a clustering stage, and an analysis stage (see figure 96).
In the first stage, image enhancement, a number of filters are applied to maximize the probability of differentiating the white and yellow color markings from the grey color of the concrete. Hue, saturation and lightness (HSL) filters are used on images of yellow markings, while YCbCr filters (blue-red chroma filters) are used with images of white markings. The filters include histogram equalization in the red-green-blue color space as well as color separation filters in other color spaces. The different values for the filters used are chosen empirically.
The second stage is independent of the marking's color. It takes the output image of the image enhancement stage and performs the following operations:
The third stage, analysis, collects statistics of the different connected components, their count and size, and reports the percentage of foreground (white or yellow paint) to background (grey) pixels.

Figure 96. Illustration. Three major stages for calculating percent paint remaining
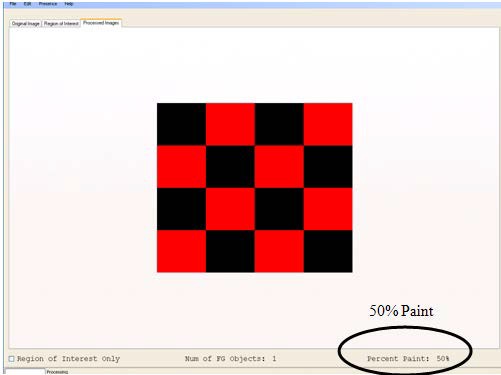
The tool was tested against different combinations of known composition. Figure 97 shows a combination of processed black and white squares (white area shown in red for contrast), which the tool accurately showed 50 percent remaining. More calibration is needed to ensure accurate and consistent determination of pavement marking material remaining.

Figure 97. Screenshot. Calibrating the image processing tool
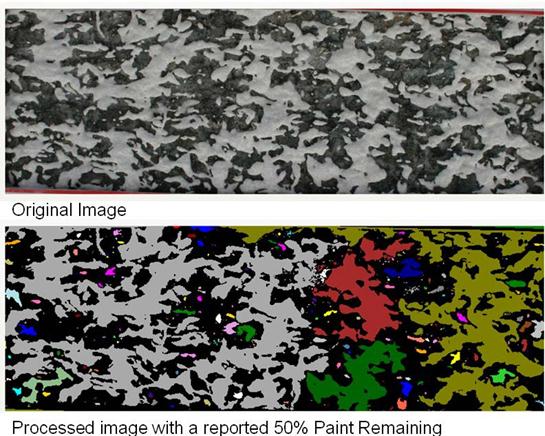
The proposed system was applied on several color field images of white and yellow markings on concrete. Figure 98 shows an example of the tool being used to analyze white paint on an asphalt surface. The upper portion of the photo shows the original image. The colors on the lower image show processed paint by color. The color is used to provide feedback on contiguous areas of foreground material. Although there is room for improvement, comparing the two images reveals very close pattern recognition of paint material. By viewing the upper image, it may be difficult to estimate that there is 50 percent paint remaining. The tool greatly reduces subjectivity and provides much needed repeatability to the analysis of presence.

Figure 98. Photo. MMA pavement marking processed using the presence tool
This research enhances the ability to analyze the presence of in-service pavement markings. This innovation comes through applying established capabilities developed within image processing technologies. These initial findings have produced a repeatable, objective, and efficient method to evaluate pavement marking presence. Further research and development are needed to add different pavement types, determine the minimum image resolution needed for accurate and repeatable measurements, and improve the user interface to allow for further enhancements of the results by identifying and fixing false positives and false negatives.
Objective presence assessments, in combination with retroreflectivity conditions, will facilitate managing markings for both their day and night performance. This combination will enhance decisionmaking in terms of marking installation and maintenance, overall investment, safety, and the use of new products and will further innovation. Figure 99 shows how data from this study could be used to manage pavement markings and make decisions regarding the most cost effective materials and installation techniques to specify.