U.S. Department of Transportation
Federal Highway Administration
1200 New Jersey Avenue, SE
Washington, DC 20590
202-366-4000
Federal Highway Administration Research and Technology
Coordinating, Developing, and Delivering Highway Transportation Innovations
| REPORT |
| This report is an archived publication and may contain dated technical, contact, and link information |
|
| Publication Number: FHWA-HRT-12-072 Date: May 2013 |
Publication Number: FHWA-HRT-12-072 Date: May 2013 |
The objective of the work described in this chapter is to test the survivability of the unprotected piezoelectric ceramic transducers embedded in asphalt under compaction conditionsandin fresh mix concrete. The observed performance variations are used to determine the initial design parameters for the packaging system. Detailed design, manufacturing, and testing procedures for the package are described in chapter 5. Furthermore, the generation of electrical energy—a critical aspect for the performance of the entire system—is investigated under simulated stress/strain conditions. Theoretical models of the piezoelectric power generation transducers are presented.
Another component in the sensing system is the piezoelectric transducer. To evaluate the effect of temperature on the complete system, commercial lead zirconate titanate (PZT) piezoelectric transducers (CEB-35D26) were attached to AC specimens along with conventional linear variable differential transformers (LVDTs). Specimens were tested in the indirect tensile test configuration for different temperatures varying from 50 to 122 °F (10 to 50 °C). The test setup is shown in Figure 83 through Figure 85. A train of sinusoidal loading pulses was applied to each specimen. The magnitude of the pulses was set to increase by 225 lb (102.15 kg) for each 20 cycles, and the output of both the strain gauge and the piezo-transducer were monitored.
Figure 86 shows the correlation between the measured peak-to-peak strain and the observed peak-to peak output voltage of the piezoelectric disc for different temperatures. It can be seen that a linear correlation can be determined between the measured strain and the observed voltage. The fluctuations in the observed data are due to measurement errors in the strain and voltage. Testing the LVDTs at constant amplitude strain levels showed fluctuations of the results in the same order as errors observed in Figure 86. This prompted the acquisition of a high-precision 50-Hz clip gauge (data sheet is attached in appendix A). The gauge was used for advanced calibration of the sensor (see chapter 6), thus allowing for a more reliable testing procedure.
From Figure 86, it can be seen that the decreasing temperature increases the slope of the linear correlation. This phenomenon might be exploited to improve the measuring performance of the system. Alternative designs of the FG system could be studied with an envisioned objective of enhancing the sensor's output by recording the temperature variations at the time of strain measurement and correlating it to different strain histograms output. The new design facilitates the interpretation algorithms and alleviates the need for correction algorithms. Several modified designs are still at the system-level simulations stage, and it is anticipated that such designs require many cycles of improvements and testing that might be beyond the scope of the current work.
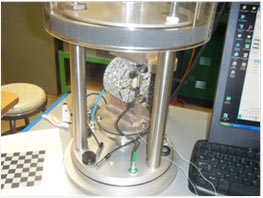
Figure 83. Photo. Experimental setup for the indirect tensile test.
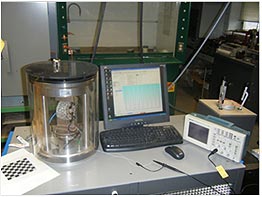
Figure 84. Photo. Command unit for the indirect tensile test setup.
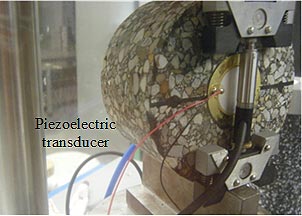
Figure 85. Photo. Piezoelectric disk transducer attached to the tested asphalt specimen.
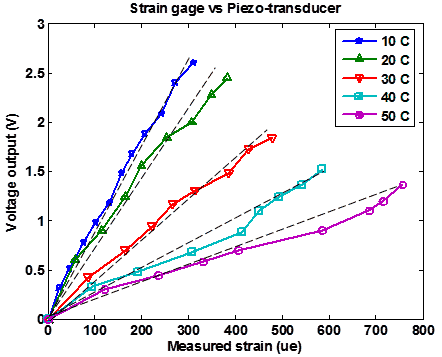
°F = 1.8°C + 32°
Figure 86. Graph. Correlation between measured strains and voltage output of the transducer at varying temperatures.
The objective of this task is to accurately calibrate the piezo-transducer in order to obtain accurate strain measurements and to check which piezo material is more appropriate for strain sensing. The piezo-sensor is immersed into epoxy. When the epoxy is strained, an induced axial loading is applied to the piezo. The system's configuration and the material properties of a piezoelectric strain sensor (polyvinylidene fluoride (PVDF) film and PZT) subjected to axial load are shown in Figure 87 and Table 3. The energy method is used to derive the constitutive equations starting from the Hamilton's principle. The basic variational indicator equation is given by the equation in Figure 88.

Figure 87. Illustration. Piezoelectric strain scavenger.
Table 3. Piezoelectric sensor properties.
| Sensor | Elastic Modulus (psi) | Piezoelectric Constant d31 (mV) | Electrical Permittivity (Farad/m) |
Beam Length (inches) | Beam Width (inches) | Thickness (inches) |
| VDF | 500,000 | 23e-12 | 7.7ε0 | 2.83 | 0.62 | 8×10⁻⁴ |
| PZT | 10.4×10⁶ | 270e-12 | 3500ε0 | 1.57 | 0.4 | 0.02 |
| ε = Vacuum permittivity. | ||||||
![]()
Figure 88. Equation. Variational indicator.
Where U and W are the kinetic energy and the external work applied to the system, respectively, defined as follows:
![]()
Figure 89. Equation. Kinetic energy.
![]()
Figure 90. Equation. External work.
Where:
u = Transverse displacement.
ρ = Density.
F = Applied load due to straining.
The subscripts p and s represent the PZT material and the metallic substrate, respectively. S, T, E, D, and V are the strain, the stress, the electric field, the electric displacement, and the material's volume, respectively.
Incorporating the linear piezoelectricity equations into the potential energy function yields the following general potential form:
![]()
Figure 91. Equation. Potential energy.
Where:
c = Modulus of elasticity.
ε = Dielectric constant.
e = Coupling factor.
The superscripts, s and E, indicate that the parameter is estimated either at constant strain or constant electric field.
Taking the variation of the external work, the kinetic energy, and potential energy and substituting it into figure 54, the variational indicator is obtained.

Figure 92. Equation. Variational indicator.
The longitudinal displacement and the electrical field are expressed in the shape mode and field coordinates as follows:
![]()
Figure 93 . Equation. Longitudinal displacement.
![]()
Figure 94 . Equation. Electric field.
Where ψ(y) defines the field over the thickness of the PZT.
Substituting figure 93 and figure 94 into the variational indicator leads to the two coupled equations in figure 95.
![]()
Figure 95 . Equation. Piezoelectric constitutive equation.
Where the stiffness matrices of the system can be written as follows:
![]()
Figure 96. Equation. Stiffness.
F is the applied load induced by the strain is expressed as follows:
![]()
Figure 97. Equation. Applied load induced by strain.
Where:
Sep = Elastic modulus.
Eep = Strain of the epoxy.
The electromechanical coupling and the capacitance matrices are given as follows:

Figure 98. Equation. Electromechanical coupling and capacitance matrices.
Where q(t)is the current output of the piezoelectric PZT element and can be directly related to the power output through a load resistance, R. The developed generalized model can accommodate more than a mode.
The strain is estimated to be 400 microstrain, and the loading frequency is 12 Hz. Figure 99 shows the voltage transfer function of the PVDF film and the PZT piezo under 400 microstrain across 10 mega-ohm resistance. Usually, the output voltage of the PZT is more important, but since its elastic modulus is much higher, the induced strain in the PZT is much lower.
Figure 100 shows the output voltage across the PVDF film and the PZT piezo versus the load resistance. The output voltage is maximum starting from 30 mega-ohm load resistance. PVDF is much efficient when it is embedded in epoxy, giving 3.5 V under 400 microstrain of frequency 12 Hz across a 50 mega-ohm load resistance.
To ensure an accurate calibration of the sensor, the different start-up-strain levels that correspond to the minimum voltage to start the sensor should be evaluated experimentally.
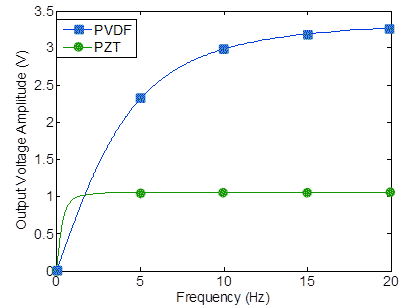
Figure 99 . Graph. Voltage transfer function of PVDF film and PZT piezo under 400 microstrain loading across 10 megaohm load resistance.
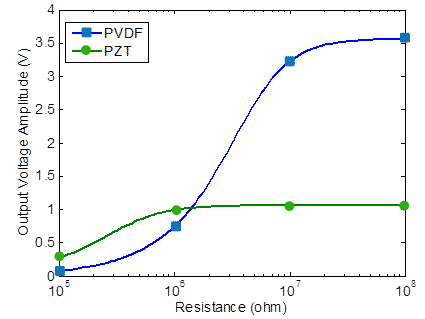
Figure 100 . Graph. Output voltage amplitude of PVDF film and PZT piezo under 400 microstrain versus load resistance.
First, the piezoelectric film is glued directly to a Plexiglas® beam (see figure 101) where the strain transfer is almost 100 percent. The film is then embedded into epoxy and glued to a Plexiglas® beam (see figure 102) and tested at different strain levels to evaluate the start-up strain level for each setup. Finally the piezoelectric film is embedded into epoxy and glued to a concrete beam (see figure 103), thus simulating real field conditions.
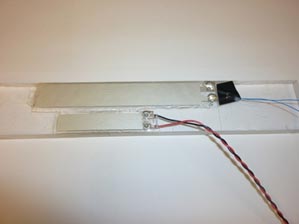
Figure 101 . Photo. PVDF piezo film bounded to Plexiglas® beam.
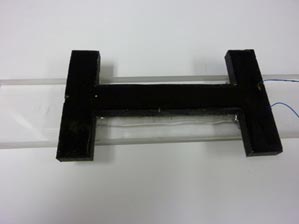
Figure 102 . Photo. PVDF embedded in epoxy and bounded to Plexiglas® beam.
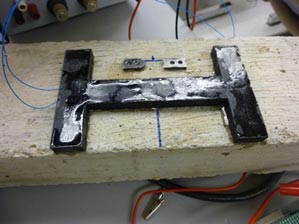
Figure 103 . Photo. PVDF piezo film embedded in epoxy and bounded to concrete.
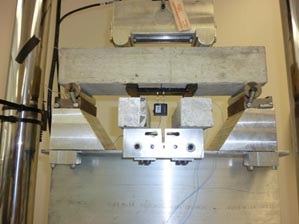
Figure 104 . Photo. Bending test setup to check the activation strain loss from a configuration to another.
For the two first setups (see figure 103 and figure 104), the experiments were consistent; the strain amplitudes corresponding to 5.5 V amplitude were 550 and 650 microstrain, respectively, for the naked and the embedded piezo film setups (see table 4).
Table 4. Activation strain at different piezo configurations.
Piezo Configuration |
Activation Strain |
Glued to Plexiglas® |
550 microstrain |
Embedded in the package and glued to Plexiglas® |
650 microstrain |
Embedded in the package and glued to concrete beam |
780 microstrain (30 percent loss) |
A total of five concrete specimens were tested under constant load (four-point bending fixture): two steel-reinforced and three regular notched beams that had a span of 16 inches (406.4 mm), a depth of 4 inches (101.6 mm), and a width of 4 inches (101.6 mm). The notch to depth ratio (α) for each specimen was 0.35. A crack-opening displacement (COD) gauge was used to measure the strain and was attached to a pair of knife edges that were mounted to the bottom face of the beam by a fast-drying epoxy resin (see figure 104). The piezo was also mounted to the bottom face of the beam. Each specimen was subjected to a 5-Hz cyclical load. The piezo was connected to the sensor (see figure 105), and readings were taken every 10,000 cycles.
For the reinforced beams, the sensor activation strain amplitude was measured around
780 microstrain. (For the notched beams, the test was not successful since the strain was concentrated around the notch and not distributed over the length of the gauge.)
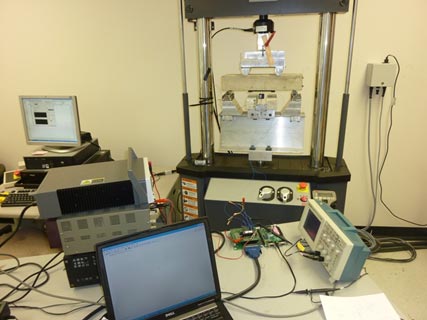
Figure 105 . Photo. Setup of sensor calibration and fatigue tests.
The objective of the work described in this section is to benchmark the performance of the piezoelectric materials and the sensor electronics if they were to be embedded without any external protection. The observed performance variations are used to determine the initial design parameters for the packaging system. Detailed design, manufacturing, and testing procedures for the package are described in chapter 5.
Testing Procedure
Piezo buzzers (CEB-35D26) were placed with the asphalt mix in a beam compactor (see figure 106). After compaction, electric signals were measured from the embedded piezos under applied load on the beams. Eight specimens were manufactured, three of which did not respond to applied load and were assumed to be defective. Beams with dimensions of 15 × 2.5 × 2 inches (381 × 63.5 × 50.8 mm) were cut from the compacted slab (see figure 107 and figure 108). Piezoelectric disks with a diameter of 0.7 inches (17.78 mm) were placed so that each cut beam had a disk at its center and was 0.4 inches (10.16 mm) from the surface. The piezo-transducers were covered with a layer of rubber. The beams were then tested in a four-point bending configuration. The output of the PZT transducers was monitored using an oscilloscope with an input impedance of 10 megaohm.
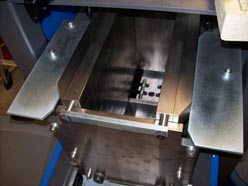
Figure 106 . Photo. Slab compactor.
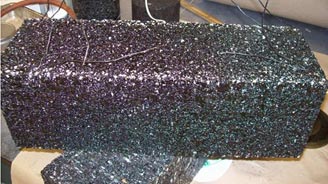
Figure 107 . Photo. Compacted slab with embedded transducers.
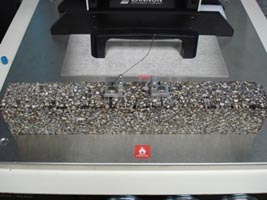
Figure 108 . Photo. Cut asphalt specimen with embedded piezoelectric generator.
Results
Figure 109 shows a sample of the observed voltage response of a PZT ceramic embedded in an asphalt beam tested at 77 °F (25 °C) under an applied sinusoidal load. The consistency of the response of the transducers was tested. Each test was repeated three times and monitored for a few hundred cycles. For a strain-controlled test, the response of the embedded transducer was repeatable and consistent for short-term testing (i.e., hundreds of cycles).
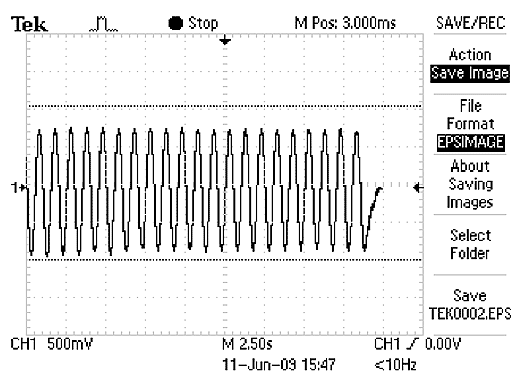
Figure 109 . Graph. Sample of voltage response of PZT with time under applied sinusoidal strain.
Concrete beams with dimensions of 10 × 2 × 2 inches (254 × 50.8 × 50.8 mm) were used in these tests. Piezoelectric disks were used as generators. They were embedded into concrete during casting at a controlled depth of about 0.3 inches (7.62 mm) from the surface (see figure 110). Given that water is present in concrete, it is vital to isolate the substrate of the transducer from the electrodes. The piezoelectric disks were covered with a layer of rubber (see figure 111). The rubber is also useful to protect the disks from the external environment such as chemical attacks. However, the thickness of the rubber layer is critical to the sensitivity of the generator to applied strains, given that it defines the contact surface with the concrete. If it is too thick, it may modify or even block the strains from being transmitted in the transducers. The used epoxies were selected based on previous studies.(1,2)
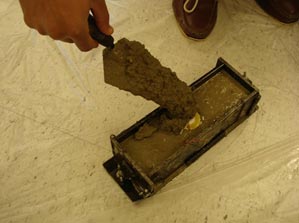
Figure 110 . Photo. Piezoelectric transducer embedded in concrete.
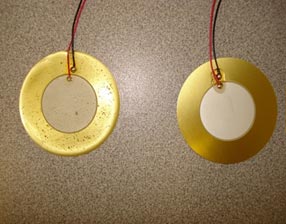
Figure 111 . Photo. Piezoelectric transducer covered with a layer of rubber.
All specimens were tested in a three-point bending configuration under varying temperatures and input loads (see figure 112 and figure 113). The actual strains were determined using data collected from the testing machine (actuator displacement) and also from surface-mounted LVDTs connected on the specimens.
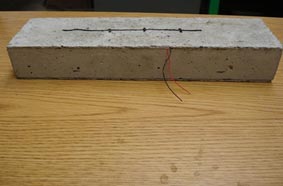
Figure 112 . Photo. Concrete specimen with embedded piezoelectric generator.
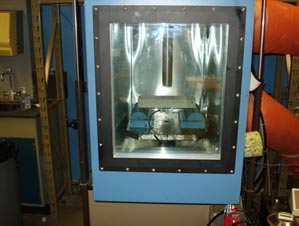
Figure 113 . Photo. Concrete specimen loaded in a temperature-controlled environment.
The input load frequency was selected to be 1 Hz for all tests. The tested concrete specimens with embedded PZT ceramics were subjected to temperatures varying from 14 to 104 °F (-10 to 40 °C). The output of the PZT devices was monitored for different load and temperature conditions using an oscilloscope with an input impedance of 10 mega-ohms.
Results
Figure 114 and figure 115 show samples of the voltage responses of embedded PZT ceramic under applied sinusoidal load. Figure 114 shows the output voltage for two applied strains subject to 14 °F (-10 °C). Figure 115 shows the output voltage at two different temperatures for the same input strain.
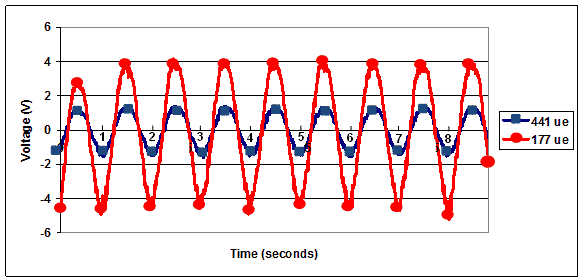
Figure 114 . Graph. Sample voltage response of embedded PZT at 14 °F (-10 °C) under applied 177 and 441 microstrain load.
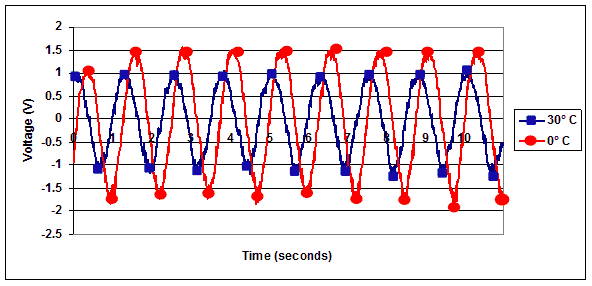
Figure 115 . Graph. Sample voltage response of embedded PZT under 278 microstrain at 32 and 86 °F (0 and 30 °C).
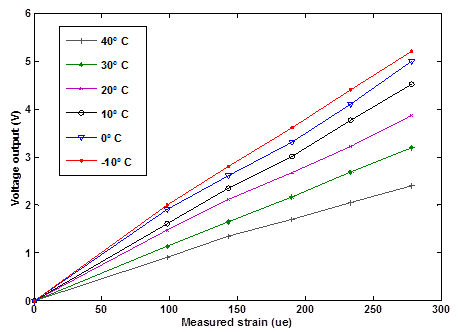
Figure 116 shows the correlation between the measured peak-to-peak strain and the observed peak-to peak output voltage of the piezoelectric disc for different temperatures. A linear correlation can be determined between the measured strain and the observed voltage. It is observed that decreasing the temperature increases the slope of the linear relation. The extracted linear correlation is used for temperature correction of the collected data. In this experiment, a Schaevitz sensor XS-B 099 LVDT was used (datasheet attached in appendix B), which presents a significantly higher precision compared to the standard LVDTs of the simple performance tester.
°F = 1.8°C + 32
Figure 116. Graph. Correlation between measured strains and voltage output of the transducer at varying temperatures.
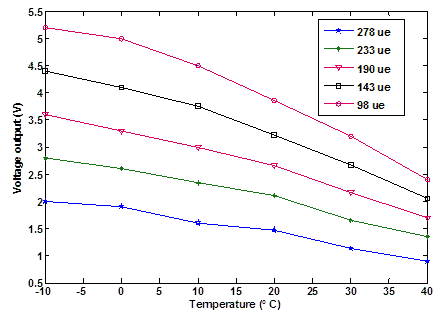
Figure 117 isolates the effect of the varying temperature on the voltage output of the piezo generator when subject to cyclic stain with a constant peak-to-peak value. Initial observations show that temperature variations have a greater effect at lower strains. The extracted curves are used to determine the temperature correction factor for each level of strain. A reference temperature is selected at which the calibration of the sensor is performed. Later, if measurements are collected at a temperature different from the reference, the change of voltage due to temperature variation obtained from figure 117 is subtracted from the measured voltage change so that it reflects the variation solely due to stain fluctuations.
Commercially available piezoelectric ceramic transducers (CEB-35D26) were embedded into hot mix asphalt (HMA) subject to compaction and in fresh concrete mix. The transducers were virtually unprotected except for a thin layer of epoxy that acted as an insulator between the two electrodes. All eight transducers embedded in concrete were functional after hardening of the beams. The specimens were subject to a cyclic loading at 1 Hz with varying amplitude levels. All but two transducers presented a consistent output until the failure of the concrete specimens, which occurred at different points for different beams between 1,000 and 10,000 cycles (random behavior of concrete). The two underperforming elements were recovered, and a slip occurred at the contact between the transducers and the concrete.
For tests with compacted AC, five out of eight specimens survived the compaction phase. All transducers showed a degradation of behavior (drop in output voltage) for loading cycles above 2,000 to 3,000 cycles. Forensic analysis showed that aggregates caused the initiation of cracks in the piezo-ceramic. Although the transducers survived the compaction, they were significantly weakened. Observations made during the execution of this task helped set the rules and the requirements for the protective packaging system described in chapter 5. It was also shown that sufficient voltage/power can be generated from the embedded transducers in order to insure proper functioning of the memory gates.
°F = 1.8 °C + 32
Figure 117 . Graph. Effect of temperature on the output voltage at different levels of fluctuating strains.
This chapter focused on the survivability of the unprotected piezoelectric ceramic transducers embedded in asphalt under compaction conditions as well as in fresh mix concrete. It was shown that mechanical protection is required for the piezoelectric transducer; however, adding a protective epoxy layer reduces the coupled strains from the host material to the sensor. This means that the sensor with mechanical protection will measure a lower strain than that actually experienced by the host material. Tests were conducted to evaluate this coupling effect, and it was found that up to a 30 percent loss in strain can occur. It should be noted that this strain loss occurs in any other embedded strain measuring system such as the commercially available strain gauges. This issue can readily be accounted for through the calibration process. The temperature effect on the piezoelectric output was also investigated, and a linear relationship exists. This means that this effect can be easily accounted for by a simple temperature correction factor. Also, the generation of electrical energy was investigated under laboratory loading conditions. It was shown that sufficient energy can be generated to power all sensor electronics using an embedded PVDF or PZT within the size limitations imposed by the protective package. The results were used to guide the further development of the robust packaging system, which is described in chapter 5.