U.S. Department of Transportation
Federal Highway Administration
1200 New Jersey Avenue, SE
Washington, DC 20590
202-366-4000
Federal Highway Administration Research and Technology
Coordinating, Developing, and Delivering Highway Transportation Innovations
| REPORT |
| This report is an archived publication and may contain dated technical, contact, and link information |
|
| Publication Number: FHWA-HRT-12-072 Date: May 2013 |
Publication Number: FHWA-HRT-12-072 Date: May 2013 |
The objective of this task is to show the feasibility of an on-chip passive temperature gauge that is able to transmit temperature data when interrogated. The gauge does not record temperature data continuously; it is only activated when a reader is within transmission range.
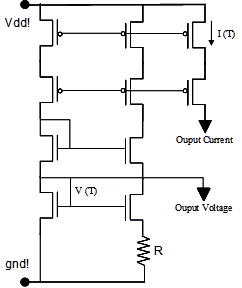
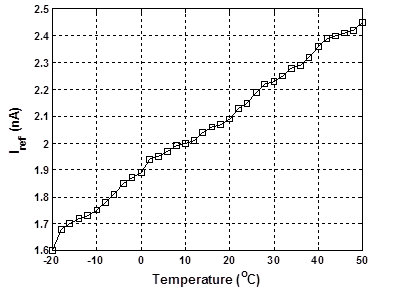
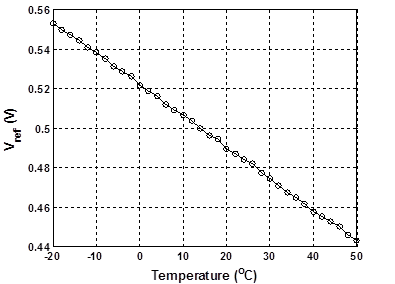
The probe is based on the fact that the behavior of a transistor depends on temperature and employs an enhanced design of a proportional to absolute temperature current/voltage reference to output electrical variables (I, V) that are linearly related to temperature. The probe was translated to a schematic design, and a prototype was manufactured in a standard 0.02-mil (0.5-µ) CMOS process and was tested. Figure 212 shows the implementation of the sensing probes. The obtained curves are used to calibrate the measurement probe. Figure 213 and figure 214 show the measured current and voltage from a tested prototype at temperatures varying from -4 to 122 °F (-20 to 50 °C). The response is clearly linear with respect to temperature, especially for voltage variations. The circuit in figure 212 is connected to the same wireless reading module discussed.

Figure 212 . Illustration. Circuit implementation of a temperature-dependent measuring system.

°F = 1.8 °C + 32
Figure 213 . Graph. Variations of measured output current (figure 212) with respect to temperature.

°F = 1.8 °C + 32
Figure 214 . Graph. Variations of measured output voltage with respect to temperature.
CMOS technology provides a means for integrating temperature and fatigue monitoring functionality on the same silicon substrate. A prototype was manufactured and tested, thus accomplishing the set objectives for this task. Although the temperature is not monitored continuously, the pavement temperature data can be collected during non-destructive testing (FWD/rolling wheel deflectometer) as part of a pavement management program.