U.S. Department of Transportation
Federal Highway Administration
1200 New Jersey Avenue, SE
Washington, DC 20590
202-366-4000
Federal Highway Administration Research and Technology
Coordinating, Developing, and Delivering Highway Transportation Innovations
| REPORT |
| This report is an archived publication and may contain dated technical, contact, and link information |
|
| Publication Number: FHWA-HRT-12-072 Date: May 2013 |
Publication Number: FHWA-HRT-12-072 Date: May 2013 |
This chapter describes the designing and testing of an implementable version of the sensing module. The shape, size, and the conformity with the current installation procedures were important factors in the design.
Embedded strain gauges made specifically for AC have been widely used by several research programs. The used sensing principle is based on mechanical indicators such as an extensometer, resistive wires, and foil gauges. To ensure a good contact, most of the recently developed and marketed gauges are H-shaped (see figure 118 and figure 119). It was decided that the package designed for the sensor should have a similar shape and could be installed using existing installation procedures that are accepted by State transportation departments and will not constitute a major disruption to current practices.
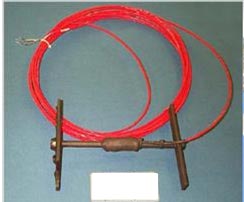
Figure 118 . Photo. Example of commercially available asphalt strain gauge.
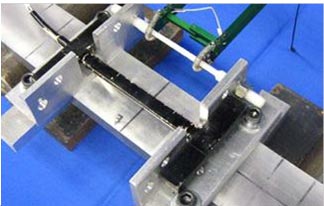
Figure 119 . Photo. Second example of commercially available asphalt strain gauge.
Many past projects dealt with the installation of monitoring gauges in both asphalt and concrete pavements. This section describes the used installation procedure based on the work by Hornyak et al. from the Transportation Research Center at Marquette University and a report prepared for the California Department of Transportation (Caltrans) by Roesler et al. (3,4) The locations of the gauges were identified and marked. A pre-mixed matrix of sand and binder was reheated and placed in a 0.5-inch (12.7-mm)-thick patch on an open-graded base layer at the location of each sensor. These patches served as the base pad for the asphalt strain gauges (ASGs). The ASGs were then placed on their respective base pads, and the leads were organized and buried into the open-graded base layer (see figure 120 and figure 121). A cable armor installed on the exposed length of the leads served as protection for the wiring from puncturing from the aggregates during paving. The ASGs were placed so that the leads exiting the protected portion of the gauge did so against the direction of paving; otherwise, forces and motions generated by the paving equipment may have a tendency to pull the sensor leads away from the strain gauge, destroying the gauge. Strain relief was provided multiple times. Shortly before the paving, asphalt material from the paver hopper was screened off on the 3/8-inch (9.53-mm) sieve and a roughly 1 inch (25.4 mm) layer was placed on the gauges. The material was compacted by mild compaction force using a hand tamper. A layer of unscreened asphalt (about 2 inches (50.8 mm) thick) was placed on top of the gauge arrays and compacted using a gas-powered plate tamper (see figure 122 and figure 123). After this was complete, the paver passed over the strain gauges. The wireless nature of the developed system reduces the required preparation time before paving.
Off-the-shelf dynamic strain monitoring gauges were used in the Caltrans project.(4) The used installation techniques could be considered representative of methods currently used by State transportation departments. Initially, shallow trenches were dug in the aggregate base, and polyvinyl chloride (PVC) pipes were laid in the trenches so that wires running from each instrument could be threaded through the PVC pipe system to the shoulder of the pavement and connected to the online data acquisition (see figure 124 and figure 125). The channels and pipe system were then backfilled with the aggregate base. For the cement-treated base, a saw was used to cut shallow grooves in which to run the gauge lead wires (see figure 124 and figure 125). These steps are skipped when installing a newly developed sensor. After the wires were placed, fast-setting cement mixed with sand was used to backfill the channels. All strain gauges were placed on the base material with small steel frames (see figure 126). Each instrument was attached to its steel frame using a plastic zip tie. Each instrument was attached firmly enough so that it would not become dislodged when the concrete was placed but also in such a manner that the fasteners would not restrict gauge movement once the concrete had set.
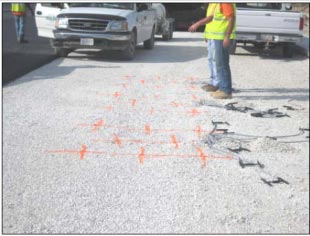
Figure 120 . Photo. Marking the proposed locations of the gauges.
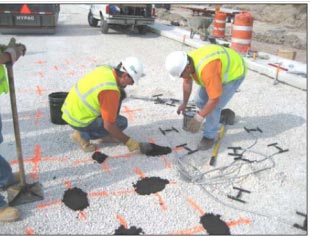
Figure 121 . Photo. Placing sand/binder pad and fitting gauges.(3)
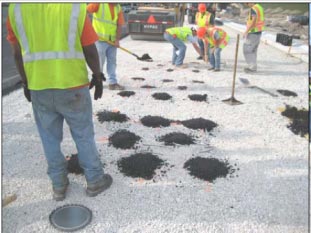
Figure 122 . Photo. Placing screened asphalt on top of gauges and carefully compacting.
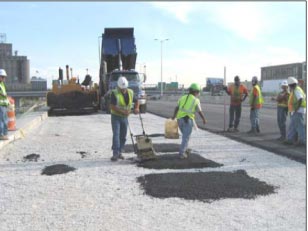
Figure 123 . Photo. Compacting the unscreened asphalt over the gauge arrays.
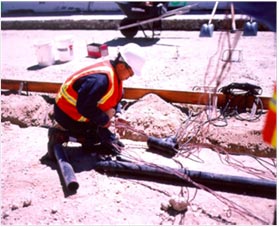
Figure 124 . Photo. Laying instrument wiring and piping in aggregate base.
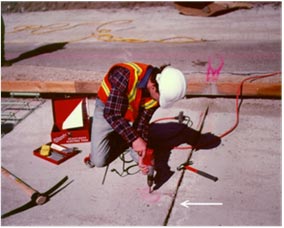
Figure 125 . Photo. Cutting grooves in cement-treated base for instrument leads.(4)
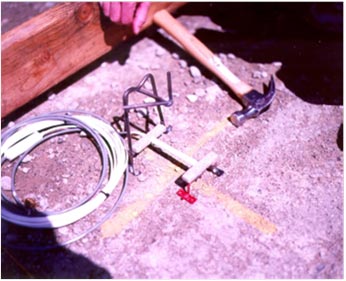
Figure 126 . Photo. Collecting a concrete strain gauge using steel frames.(4)
It should be noted that for these gauges, no electronics were embedded with the system since they do not have on chip capabilities such as computation and memory storage. In addition, the resistive strain gauge can withstand high temperatures. One of the disadvantages of this system is its high sensitivity to temperature variations. In the design presented in this report, the piezoelectric transducer is attached to the core reinforced epoxy, and a thermal insulator coating is used to protect the embedded electronics in contrast with commercial devices which do not use a thermal insulation layer (figure 127). To prevent the undesirable effects of moisture on the circuit, silicone rubber polymer, which is an excellent impervious material, is used.
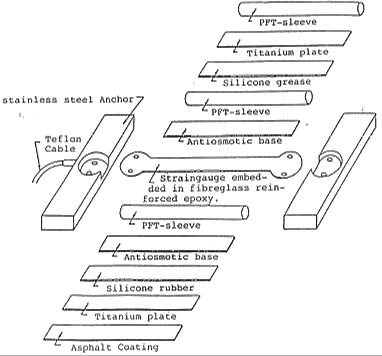
Figure 127 . Illustration. Cross section of commercialized strain gauges.
In order to not disrupt the stress field in the pavement, the system's stiffness must be close to that of the pavement. A low stiffness is desirable, but the device must be able to survive the stresses imposed during paving. Most of the systems are designed to approach the stiffness of asphalt at 77 °F and 320,000 psi (25 °C and 2,204,800 kPa). The main frame of the package is made of epoxy on which the sensor and the piezoelectric are attached. The layers used for thermal and chemical insulation have a very low stiffness compared to the main frame epoxy. The choice of the epoxy is based on several parameters such as the thermal conductivity and the electric conductivity. Two types of epoxy were identified—Conathane® TU-981 and Araldite® GY-6010. Both types have a tensile modulus close to 300,000 psi (2,067,000 kPa) and high tensile and flexural strengths above 4,000 psi (27,560 kPa). Both are good electric insulators, but the Araldite® GY-6010 has an upper thermal resistivity.
5.2.1 Thermal Insulation
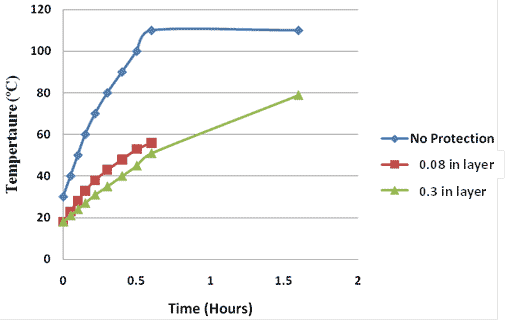
According to the results shown in Timm et al., the typical mix temperature in a paving project decreases from around 302 °F (150 °C) to around 158 °F (70 °C) in about 2 h and then oscillates between 158 and 212 °F (70 and 100 °C) as lifts are applied.(5) Thus, the circuit needs to be protected. From a simple finite element simulation in which the external temperature is assumed to be constant all the time at 302 °F (150 °C) (conservative condition), it was concluded that the conductivity of a 0.4-inch (10.16-mm) isolating material layer should be less than 0.554 inch hr-1ft-2 °F-1 (0.08 W/mK). Polyurethane foam was identified as a viable candidate for thermal protection. Its thermal conductivity is lower than 0.346 inch hr-1ft-2 °F-1 (0.05 W/mK). Furthermore, it has a high abrasion resistance and impact strength. The selected foam was tested in a high-temperature environment where three thermocouples were placed inside an environmental chamber with a controlled temperature increasing gradually from 86 to 230 °F (30 to 110 °C) and then maintained at that level for 60 min. The first thermocouple was placed with no protection, while the second and third thermocouples had coats of 0.08 and 0.3 inches (2.03 and 7.62 mm), respectively. A sample is shown in figure 128. Figure 129 shows the variation of temperature for different sensors. From the figure, it is observed that a polyurethane layer significantly decreases the observed temperature.

Figure 128 . Photo. Thermocouple covered with a layer of polyurethane foam.
°F = 1.8 °C + 32
Figure 129 . Graph. Measured output from protected and unprotected thermocouples.
5.2.2 Mechanical Protection
The sensor needs to be coated with a layer of a thin, rigid material in order to protect it from the stresses during paving (compaction for HMA pavements) as well as damage due to aggregates that might puncture the system under high pressure. This layer should be very thin so it does not affect the overall stiffness of the system. Some commercial gauges use titanium as an external protective layer, while others use rigid nylon. In this case, metallic materials were not used because they act as a Faraday cage and inhibit wireless communication. Smooth-cast 385, which is a mineral-filled urethane casting resin that is very hard and durable, was selected as a candidate to test. It also has a very high flexural and compressive strength and resists moisture and mild solvent. A simple circuit consisting of a resistor in series with a capacitor was covered by a 0.2-inch (5.08-mm) layer of polyurethane foam for temperature protection and a 0.06-inch (1.52-mm) layer of the smooth-cast 385. The sample was placed within the asphalt mix in a linear kneading compactor. The compaction was set to obtain an air void of 4 percent so that maximum stresses are applied on the sample. The system was then recovered from the compacted beam. The protective layer showed multiple cracks and deformations (see figure 130 through figure 133). The implanted circuit was tested and was perfectly functional.
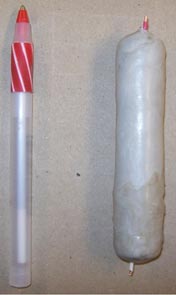
Figure 130 . Photo. Testing of the selected protective materials under compaction condition.
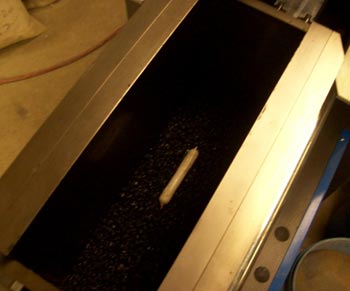
Figure 131. Photo. Material prototype placed in a compactor.
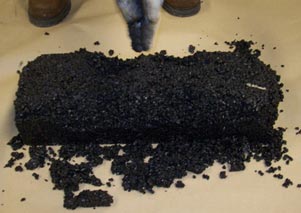
Figure 132. Photo. Compacted asphalt material.
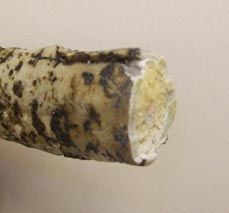
Figure 133 . Photo. Material specimen recovered from the asphalt beam after compaction.
5.2.3 Package Design for Implementation in HMA
As discussed previously, the package designed for the sensor has a similar shape to existing systems and could be installed in the field using existing installation procedures that are accepted by State transportation departments and will not constitute a major disruption to current practices. The required materials have been identified. The main frame of the package is made of an epoxy on which the sensor and the piezoelectric are attached. Araldite® GY-6010 epoxy was used; it has a tensile modulus close to 300,000 psi (2,067,000 kPa) and high tensile and flexural strengths (above 4,000 psi (27,560 kPa)). A layer of polyurethane foam, which has a thermal conductivity lower than 0.05 W/mK, was used for thermal protection. Smooth-cast 385 was deposited as an external layer for mechanical protection.
A simplified finite element analysis of the H-shaped sensing module was performed to determine the required thickness of each material layer (see figure 134 through figure 136). Maximum stress and deformation levels tolerated within the system were selected so that an embedded piezoelectric element was not overstrained or crushed during compaction. The applied stress was 290 psi (1.998.1 kPa), which simulates the stress levels that would be experienced by the system in the field during compaction. It was determined that a layer of epoxy with a minimum thickness of 3/16 inch (4.76 mm) was required as the frame core. The minimum required thickness for the polyurethane and the resin layers was also determined to be 1/16 inch (1.59 mm).
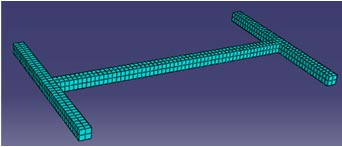
Figure 134 . Illustration. Finite element model of the H-shaped package.
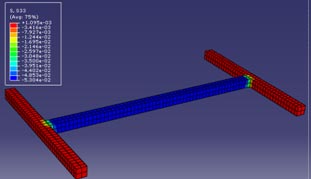
Figure 135. Illustration. Simulated stress distributions.
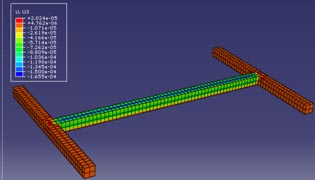
Figure 136 . Illustration. Simulated nodal deflections.
Silicone rubber was used to build the molds for the H-shaped layered systems. Silicone rubber was selected because of its resilience, high-temperature stability, and general inertness properties. In addition, it can easily reproduce any irregular shapes and sizes with high accuracy.
The desired shapes were made of wood and/or steel, and silicon was cast to produce the needed molds (see figure 137 through figure 139). Different materials were then formed on top of each other with a larger mold used in each step to deposit an additional layer. The thickness of each layer, or the depth of the mold, accurately reproduces the results obtained from the finite element analysis.
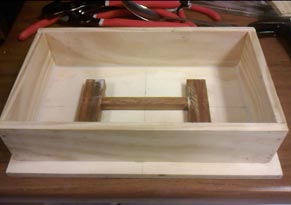
Figure 137 . Photo. Manufacturing process of the used molds.
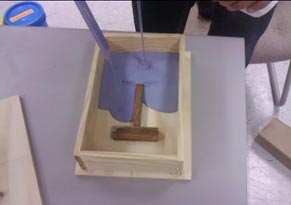
Figure 138. Photo. Molds forming.
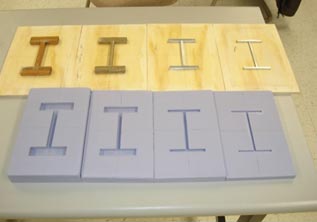
Figure 139 . Photo. Finished molds.
In figure 139, from left to right, the first mold (smallest) is used to cast the Araldite® GY-6010 epoxy core, which serves as the first protection to the piezoelectric transducer and the electronics as well as the sensing medium that its modulus is close to the AC's modulus. Once cured, the obtained core is placed in the second mold, and the polyurethane foam is deposited. The two other molds are used to cast the external layers.
Figure 140 shows an embedded piezoelectric transducer within Araldite® GY-6010 epoxy resin cured with Jeffamine D-400 amine for 7 days at room temperature. The formed core has an elastic modulus of 300,000 psi (2,067,000 kPa), a tensile strength of 4,000 psi (27,560 kPa), a compressive strength of 5,100 psi (35,139 kPa), and a flexural strength of 7,300 psi (50,297 kPa). Figure 141 shows the formed polyurethane layer over the cured epoxy using a silicon mold with a depth of 3/16 inch (4.76 mm) and a 1/16-inch (1.59-mm) space filled with the foam. A casting resin layer is then deposited on top of the insulator foam to increase the overall mechanical resistance to load. Initial tested specimens showed a poor adherence between polyurethane and the casting resin. As a result, an additional layer of Araldite® GY-6010 was added for mechanical protection given its toughness prosperities. Samples are shown in figure 142.
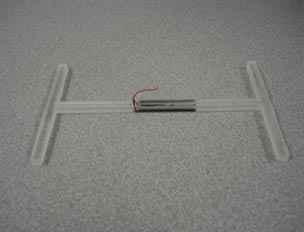
Figure 140 . Photo. Piezoelectric transducer embedded in Araldite® GY-6010 epoxy.
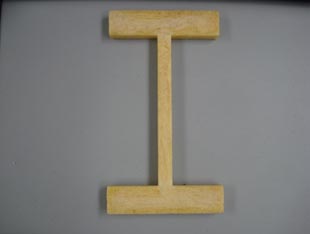
Figure 141 . Photo. Polyurethane thermal insulator coat deposited on top of the epoxy core.
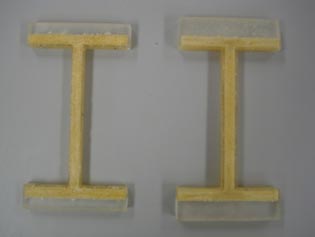
Figure 142 . Photo. Tested prototypes of piezoelectric transducer embedded in epoxy and coated with a polyurethane thermal insulator.
5.2.4 Laboratory Testing and Results
Using a slab compactor, the package prototypes were embedded in AC and subject to compaction (see figure 143). The compaction curves, uploaded from the compactor's controller unit, are shown in figure 144. All the compaction tests conducted here for the package testing have similar compaction curves to the one shown in figure 143. Compressive loads exceeded 290 psi (1,998.1 kPa), which is close to the estimated in-filed stresses. The temperature was around 302 °F (150 °C).
A forensic analysis was conducted to evaluate the behavior of different prototypes. Although both recovered prototypes had an undamaged transducer that showed characteristics close to pre-compaction behavior, the external layer was affected by the high temperature and showed little damage (see figure 145 and figure 146).
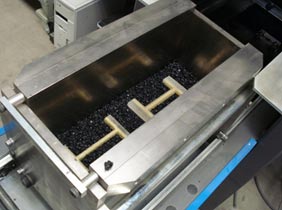
Figure 143 . Photo. Specimens placed in the compactor.
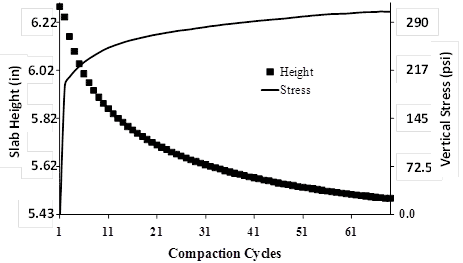
Figure 144 . Graph. Measured compaction curves.
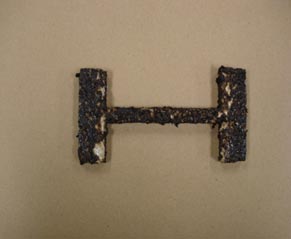
Figure 145 . Photo. Recovered sample 1 after compaction.
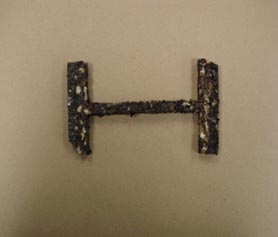
Figure 146 . Photo. Recovered sample 2 after compaction.
Modified prototypes with an added thin layer of urethane casting resin were manufactured and tested. The added material proved to adequately bond to the Araldite® GY-6010 epoxy, providing the required external resistance (see figure 147). Five samples were tested under compaction; they all survived the test and showed much greater resistance to local damage induced by aggregates (see figure 148).
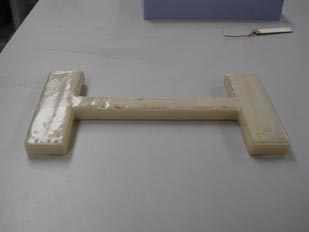
Figure 147 . Photo. Final version of the prototype with an external resin layer.
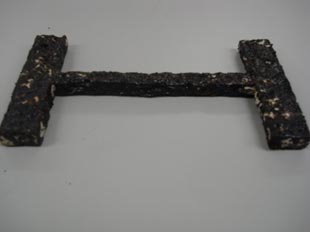
Figure 148 . Photo. Recovered specimen.
The anticipated objectives of this task were achieved. A robust system that can withstand simulated field construction conditions was developed, manufactured, and tested. A survivability rate of over 90 percent under laboratory conditions was achieved.
Issues that need to be addressed in field implementation include: (1) stiffness compatibility between the epoxy and the host material (HMA or portland cement concrete (PCC)), (2) size and shape of the protective package, and (3) thickness of the epoxy layers. The objective of this task is to empirically investigate different packaging configurations for an enhanced strain coupling. The effect of the shape, thickness, and material properties were investigated.
Stiffness compatibility can be achieved using epoxy with a lower stiffness than the host material. Two different materials were used: Araldite® GY-6010 epoxy cured with Jeffamine D-400 and Conathane® TU-981.
Most of the commercialized strain gauges are H-shaped. The anchors are usually metallic to avoid damage in the corners due to stress concentration. However, for better structure integration and strain transfer, the modulus of those anchors should be the same or less than the modulus of the host material. Two different shapes were considered: regular H-shaped and bone-shaped (developed in the lab).
The third parameter to investigate is the gauge thickness. While increasing the thickness leads to higher survivability rates, it affects the structural integrity of the host material. Using very thin gauges is conceptually desirable for better strain compatibility between the gauge and the host material; however, they are more prone to breakage. Two different thicknesses were evaluated for the different shapes and materials: 1/4 and 3/8 inch (6.35 and 9.53 mm).
The strain gauges were tested at TFHRC's ALF. The gauges were installed following the schematic shown in figure 149.
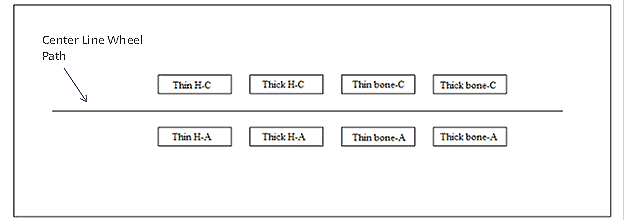
Figure 149 . Illustration. Layout of ASGs.
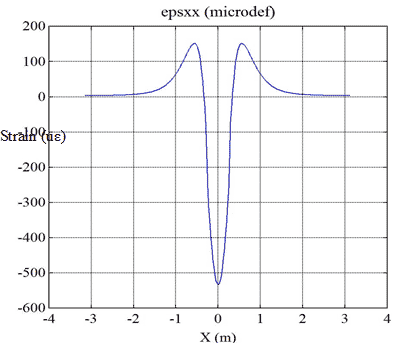
Simulations using the Viscoroute program were conducted to estimate the expected strains in the ALF test lane and compare with the strain measurements from the different gauge configurations. The pavement structural configuration and material properties were obtained from FHWA. The moduli of different layers were backcalculated using EVERCALC© at a pavement temperature of 78.8 °F (26 °C). Strain gauge responses were recorded at a temperature of 66.2 °F (19 °C) and a wheel load of 16,000 lb (7,264 kg). Figure 150 shows a typical computed longitudinal strain at the surface under a moving load. As the load approaches a fixed point in the pavement (where the gauge is), the strain increases in tension and then reverses from tension to compression then back to tension as the load moves away from it before dying out.
1 ft = 0.305 m
Figure 150 . Graph. Simulated longitudinal strain using Viscoroute.
Figure 151 through figure 154 show a comparison of the measured strains between the H-shape and the bone shape for the different thicknesses and materials properties. Theoretically, if the bonding of the strain gauges to the pavement surface is perfect, the transferred strain can never exceed the strain induced in the pavement. The higher the recorded strain, the better the configuration.
Figure 152 and figure 154 show the strain measurements from the H-shape and bone shape for the two thicknesses using the Araldite® epoxy (modulus is 300,000 psi (2,067,000 kPa)). The noise to signal ratio in these measurements is high, and the peak strain is relatively low compared to the theoretical values (see figure 150). This is due to the high tensile modulus of the Araldite® epoxy. Usually for a better strain transfer, the modulus of the gauge should be comparable (or lower) with respect to the modulus of the pavement material.
Figure 151 and figure 153 show the strain measurements from the H-shape and bone shape for the two thicknesses using the Conathane® epoxy (modulus is 30,000 psi (206,700 kPa)). While the noise level is much lower, the peak strain recorded using the H-shape is very low due to the softness of the anchors. They deform under loading, inducing a loss in the strain transfer.
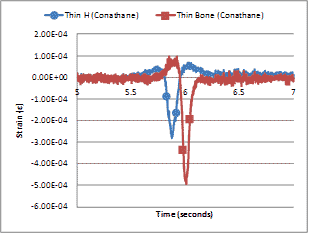
Figure 151 . Graph. Measured longitudinal strain using thin H-shape and bone shape made of conathane.
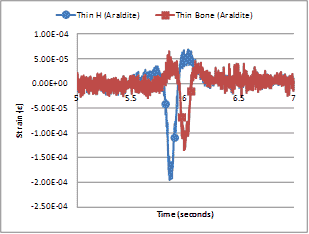
Figure 152 . Graph. Measured longitudinal strain using thin H-shape and bone shape made of araldite.
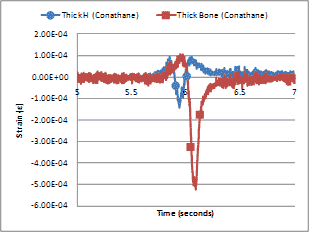
Figure 153 . Graph. Measured longitudinal strain using thick H-shape and bone shape made of conathane.
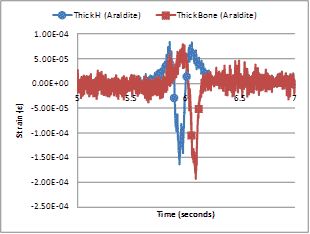
Figure 154. Graph. Measured longitudinal strain using thick H-shape and bone shape made of araldite.
The bone shape made with the Conathane® TU-981 epoxy appears to perform better compared to the other configurations. It allows for a better strain transfer (higher signal), and it has no anchors, ensuring a better survivability rate by avoiding stress concentrations at corners.
Figure 155 shows the measured strains using the bone-shaped gauges manufactured using Conathane® TU-981 for two different thicknesses. The observed peak strain is close to the theoretical value. This result might be due to the fact that the gauges were carefully installed at the surface by grinding the existing pavement and properly bonding the gauges to the surface using a special epoxy (see figure 156 through figure 163).
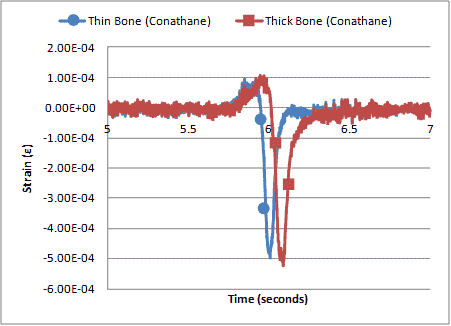
Figure 155. Graph. Measured longitudinal strain with bone-shaped conathane strain gauges using two different thicknesses.
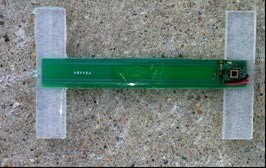
Figure 156 . Photo. Prototype installation at TFHRC's ALF.
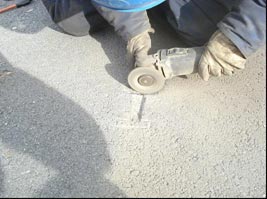
Figure 157. Photo. Grinding the existing pavement before bonding gauges to the surface.
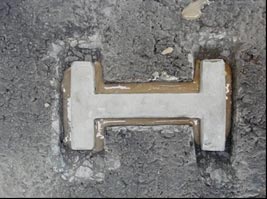
Figure 158. Photo. Placed sensor prototype.
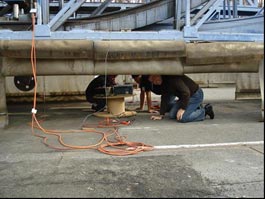
Figure 159. Photo. Testing the wireless reading functions for the installed prototype.
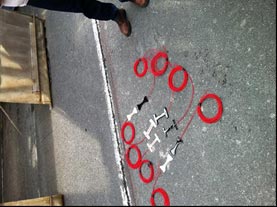
Figure 160. Photo. Different tested types of package prototypes.
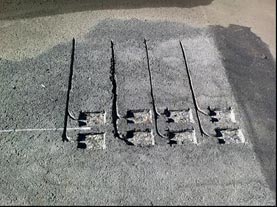
Figure 161. Photo. Prepared grooves for prototype installation.
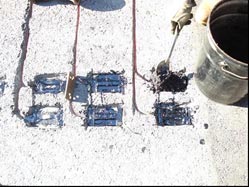
Figure 162. Photo. Special epoxy used to bond gauges to surface.
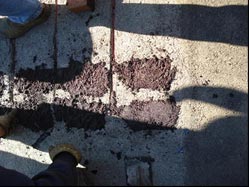
Figure 163 . Photo. Installed prototypes.
An integrated prototype of the sensor was also installed at the ALF facility at TFHRC. The objective was to evaluate the short-term survivability and basic wireless functionalities of the sensor after applying the loading cycles. The results from this experiment were used to help refine the sensor electronics and the wireless communications protocols. Details of these refinements are discussed in chapters 2 and 3 of this report.
In addition, different prototypes of the packaging system were installed during a construction project in Michigan. Regular strain gauges were included in the packages. During installation, a procedure was used that did not cause any delays to construction. The gauges were laid just ahead of the compactor and secured with small HMA patches (see figure 164 through figure 167). The survivability rate dropped to 25 percent mainly because of the high strains on the wires during compaction. A total of 75 percent of the gauges that survived were placed in the transverse direction.
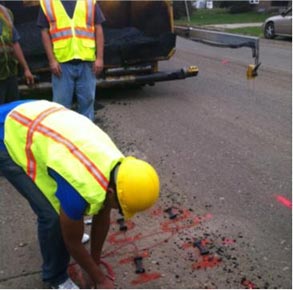
Figure 164. Photo. Installation of the prototype packaging system installed during a construction project near Lansing, MI.
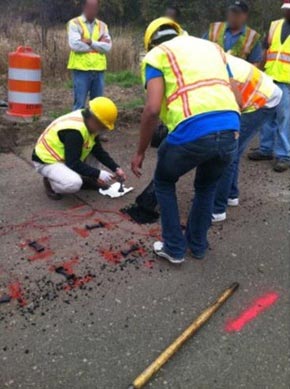
Figure 165. Photo. Specimen preparation and placement.
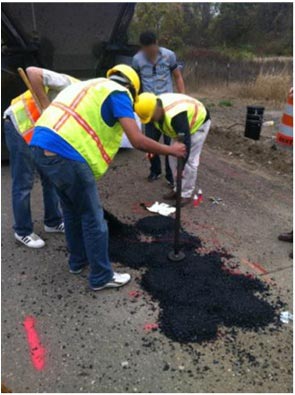
Figure 166. Photo. Manual compaction of HMA patches.
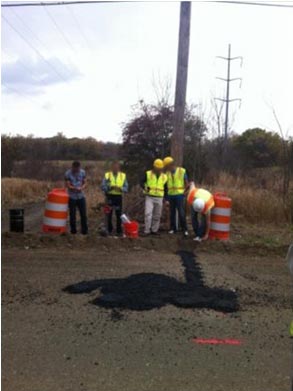
Figure 167. Photo. Installed prototypes ahead of the compactor.
In this chapter, a packaging system was designed and manufactured to encase the sensing modules. The package was designed so that it has a similar shape to existing systems and can be installed using existing installation procedures. Nonmetallic materials were used so that it allows for RF communication. A layered system mainly consisting of Araldite® GY-6010 epoxy, polyurethane foam, and mineral-filled urethane casting resin was used to provide the required mechanical and thermal protections for field installation. The system, entirely built in-house, was tested under a laboratory setup simulating field conditions as well as in construction projects.