U.S. Department of Transportation
Federal Highway Administration
1200 New Jersey Avenue, SE
Washington, DC 20590
202-366-4000
Federal Highway Administration Research and Technology
Coordinating, Developing, and Delivering Highway Transportation Innovations
| REPORT |
| This report is an archived publication and may contain dated technical, contact, and link information |
|
| Publication Number: FHWA-HRT-17-020 Date: February 2017 |
Publication Number: FHWA-HRT-17-020 Date: February 2017 |
Either 3- or 6-ft-long weldments were fabricated from a single rib and flat plate meant to represent the deck plate. Two fabricators were used to make the specimens. Most specimens were made by a prominent steel bridge fabricator using typical weld processes. Specimens welded with hybrid laser arc welding (HLAW) were made by a small business that specializes in HLAW. HLAW was integrated into the test program because it produces a higher-quality weld that may lead to higher fatigue resistance.
After welding, the panel was transversely sectioned with a bandsaw to isolate individual 4.25‑inch-wide test specimens. The saw-cut edges of the specimens were milled to provide uniform specimen width of 4 inches. Also, a hole was drilled through the flat bottom of the rib plate to enable mounting in the loading frame. The tack weld locations were marked on each specimen to determine whether tack welds influenced the fatigue crack initiation location.
Schematics of each panel sectioning and specimen naming conventions can be found in appendix A.
Welded panels were procured in four distinct batches throughout the life of the project. A byproduct of this was the rib geometry changed slightly from one batch to another. Because this affects the loading of the specimen, figure 2 through figure 4 show the variation in the specimen geometries referred to as types 1–3 rib geometries. Type 1 specimens used a 3/4-inch-thick deck plate and a 5/16-inch-thick rib that was nominally 14 inches tall. Type 2 specimens used a 3/4-inch-thick deck plate and a 5/16-inch-thick rib that was nominally 12 inches tall. Type 3 specimens used a 5/8-inch-thick deck plate and a 5/16-inch-thick rib that was nominally 12 inches tall.

Units = Inches.
Figure 2. Illustration. Type 1 rib geometry.

Units = Inches.
Figure 3. Illustration. Type 2 rib geometry.

Units = Inches.
Figure 4. Illustration. Type 3 rib geometry.
The specimen geometries shown in figure 2 through figure 4 represent the as-designed rib, though it was noted during the project that the as-built geometry did deviate from the ideal geometry, but the deviation was not quantified in the project. For instance, the top of the rib was not always parallel to the deck plate, the rib legs were not always perfectly symmetrical, and the height of the rib varied.
Table 1 highlights the major variables explored in the program: welding process, weld penetration, edge preparation, and fit-up gap.
Table 1. Test specimen series.
| Series Name |
Rib Geometry |
Welding Process |
Target Penetration (percent) |
Rib Plate Beveling |
Intentional Fit-up Gap (inches) |
Number of Specimens |
|---|---|---|---|---|---|---|
| GM8 | Type 1 | GMAW | 80 | None | 0 | 16 |
| SA8 | Type 1 | SAW | 80 | None | 0 | 16 |
| SA6 | Type 1 | SAW | 60 | None | 0 | 8 |
| SA4 | Type 1 | SAW | 40 | None | 0 | 8 |
| SA2 | Type 1 | SAW | 20 | None | 0 | 8 |
| FIL | Type 1 | SAW | None | None | 0 | 8 |
| LP1 | Type 1 | HLAW | 100 | Beveled | 0 | 14 |
| LP2 | Type 1 | HLAW | 100 | Beveled | 0 | 13 |
| LP3 | Type 1 | HLAW | 100 | Beveled | 0 | 14 |
| OB | Type 2 | SAW | None | Beveled (5 degrees over) |
0 | 16 |
| UB | Type 2 | SAW | None | Beveled (5 degrees under) |
0 | 16 |
| OG1 | Type 3 | SAW | 60–100 | None | 0.02 | 16 |
| OG2 | Type 3 | SAW | 60–100 | None | 1/32 | 16 |
| W | Type 3 | SAW | 60–100 | Beveled | 0.02 | 16 |
| GMAW = Gas metal arc welding. SAW = Submerged arc welding. |
||||||
Three welding processes were explored: GMAW, SAW, and HLAW. It was suggested that weld quality may be a factor between the three processes and may lead to different fatigue lives.
Weld penetration is an obvious variable that may control fatigue life because this is a partial penetration weld under a tensile load. Because partial penetration welds inherently leave an unfused section of the rib at the root, it creates a notch-like defect that could spawn weld root failures. As the penetration value increased, it was thought the fatigue resistance would commensurate.
Edge preparation and fit-up gap are interrelated to the weld penetration, and figure 5 illustrates the differences. Because the rib is trapezoidal, the rib walls intersect the deck plate at a non-normal angle; therefore, without edge preparation, only a corner of the rib wall touches the deck plate prior to welding. This creates a larger face gap than root gap when there is no edge preparation. This requires more weld consumable to fill the larger gap; however, no edge preparation results in larger penetration because there is less base metal to melt in the rib wall, and the wire is able to get closer to the root. When the edge is prepared by milling, it is able to sit flat on the deck plate prior to welding, resulting in less penetration because more rib wall base metal has to be melted. From a fabrication standpoint, edge preparation is not desirable because of the added expense/time in handling the plate and conducting the milling operation. The fit-up gap is related to just the root gap. Because of the natural waviness of hot-rolled plates, a root gap is inevitable, but a tolerance should be provided, and this is referred to as the “fit-up gap.” Larger fit-up gaps can lead to melt-through and blow-through during welding, and small fit-up gaps can increase the cost of fabrication.
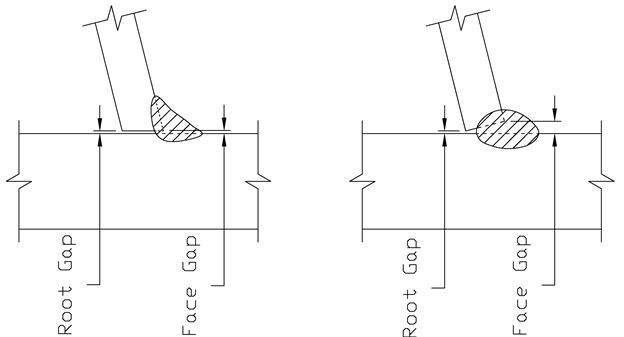
Figure 5. Illustration. Comparison of rib edge preparation: beveled (left) and no preparation (right).
Table 1 also shows horizontal division lines depicting the four distinct batches in which specimens were procured and tested. The first batch of panels was the GM8, SA8, SA6, SA4, SA2, FIL, and LP series. The variable that was targeted was the penetration of the weld and whether it was process dependent. The number in the series title correlates to the target percent penetration (in 10s of percent), GM means that it was made with GMAW, and SA means that it was made with SAW. The FIL series was made with SAW, but the intent was that it would literally be a fillet weld with very little penetration. Because of the face gap from no edge penetration on the rib, the GMAW and SAW processes were unable to attain penetration values less than approximately 60 percent despite attempts to make it vary from 0 to 80 percent. The LP series were made with HLAW, which is inherently intolerant of gaps and by its very nature required edge preparation. The HLAW process was able to consistently achieve 100 percent penetration. Because the two conventional weld processes achieved a consistent penetration, welding process was not considered a variable, and fit-up gap and edge preparation were considered a larger player in achieving the desired weld penetration.
The OB and UB series panels were designed to investigate the influence of the weld root gap and whether weld root failures could be forced to happen. This was done by using an intentionally 5‑degree overbeveled and underbeveled edge preparation, as shown in figure 6. The OB specimens were prepared with a bevel angle greater than the rib angle, resulting in a root gap that was open before welding. The UB series had a bevel angle less than the rib angle, resulting in a closed root gap before welding. Despite this bevel preparation, weld shrinkage due to cooling of the weld metal caused the root gaps to close after welding in both series. However, the different bevel preparation resulted in different amounts of contact pressure at the root. The UB series showed definite plastic distortion where the two plates were pressed together from weld shrinkage. This was less evident in the OB series, where the root gap had to close before pressure could develop. Because the OB series did not result in the desired open root gap, they were all saw-cut at the root to open the gap before testing. The saw cuts were performed carefully to avoid contact with the weld, thereby preserving the natural situation at the tip of the root notch. Additionally, half of the UB series had their roots saw-cut. Figure 7 shows typical saw cuts on both the OB and UB specimens.

Figure 6. Illustration. Overbeveled (left) and underbeveled (right) edge preparation.

Figure 7. Photo. Typical saw cuts introduced at the weld roots on the OB and UB series specimens.
The OG series was meant to explore the effect of potential fit-up gaps that naturally occur as a result of the waviness of hot-rolled plates. No bevel preparation was used. The fabricator used jacks to either lift the rib up or push it down before tacking the rib in place prior to welding. The gap was set using feeler gauges and was mostly uniform along the length of the panel prior to welding. The OG1 panel had an intentional 0.020-inch gap placed where the OG2 panel had an intentional 0.031-inch gap. This is illustrated in figure 8.

Units = Inches.
Figure 8. Illustration. Intentional fit-up gaps in OG1 panel (left) and OG2 panel (right).
The last panel fabricated was the W series and was meant to include all the lessons learned from the previous sets of panels to attain a target penetration of 70 percent with variance allowed between 60 and 100 percent. The edge was bevel prepared by the fabricator to attain better control over the penetration. In addition, a 0.020-inch fit-up gap was purposely introduced. This is illustrated in figure 9.

Units = Inches.
Figure 9. Illustration. Fit-up gap and edge preparation for W series.
Residual stress is a key factor in the fatigue performance of welded joints; therefore, tests were performed at different load ratios (R-ratios) to study their effect on fatigue life, though this is not reflected in table 1. The R-ratio represents the ratio between the minimum and maximum loads of the applied load cycle. The stress cycle is under full tension when R = 0, and it is under an equal tension-compression stress reversal when R = −1. Only ratios of 0 and −1 were explored in this program. Comparison of fatigue results from the two test conditions can help determine how much of the compression stress range is being placed in relative tension as a result of superposition of residual stresses. The R = 0 test condition will provide a lower bound for fatigue life. Each test series had a blend of specimens tested at both load ratios.
Fatigue tests were conducted concurrently at both the Structures Laboratory at the Turner-Fairbank Highway Research Center (TFHRC) and the Structures Laboratory at Virginia Tech (VT). Each testing site both used closed-loop, servo valve-controlled hydraulic testing frames. The following subsections describe the loading fixture and testing procedures.
Two customized test fixtures were fabricated to hold a specimen and facilitate applying loads in the universal testing machines. An illustration of the customized fixture is shown in figure 10. Conceptually, the fixture was a spreader beam that supported four adjustable rollers. The rollers were meant to clamp the deck plate so it could resist full load reversals. Each of the rollers was supported by two take-up bearings. The bearings could allow some angular adjustment so the rollers could be adjusted to be parallel to the deck plate surface. The welded test specimens had a certain amount of plate distortion induced by welding. The angular adjustment capability of the rollers was essential to allow the rollers to adapt to the specimen and prevent distortional twisting that could cause error in the applied stress range. This fixture was mounted to either the actuator piston or load cell, depending on the preference of each test site.

Units = Inches.
Figure 10. Illustration. Test setup.
The flat of the rib attached to the other side of the machine from the customized fixture. To uniformly load across the width of the rib, the rib was sandwiched between two thick plate washers. The thick plate washers were 5 inches long at TFHRC but only 3.75 inches long at VT. This is specifically noted because it slightly altered the loading in the specimens between the two testing sites. In addition, since the rib flat was typically not parallel to the deck plate, spherical washers were placed between the thick plate washer and the testing machine to ensure the deck plate sat parallel to the hollow structural section of the customized fixture.
Photos of the fixture and a specimen mounted into the testing frames at each of the test sites are shown in figure 11 and figure 12.

Figure 11. Photo. Test setup at VT.

Figure 12. Photo. Test setup at TFHRC.
Consistent boundary conditions between specimens were essential to minimize scatter in the test results. Ideally, the top and bottom rollers should have provided ideal boundary conditions. However, excessive clamping force between the two rollers could potentially add some fixity. The stress state at the potential cracking locations was expected to change dramatically if fixed-end conditions existed instead of the ideal rollers. Too much clamping force from the rollers on the deck plate could cause roller friction that would effectively create a semi-fixed boundary condition. Too little clamping force would introduce slip in the load path and allow the specimen to bang and vibrate in the test fixture under load reversal. Therefore, an installation procedure was initiated to measure and limit the clamping force to ensure that the ideal roller boundary condition was present. After a few trials, the clamping force was set to 70 lb on each side (140 lb in total). The force was measured by monitoring the load cell output during the clamping procedure while in displacement control. Rollers on one side of the deck plate were brought into contact with the deck plate equally until the load cell read 140 lb, and then the rollers on the other side were brought into contact until the load cell registered 0 lb. It was observed that the rollers were still able to rotate freely at this clamping force level.

