

Precast Bent System for High Seismic Regions: Laboratory Tests of Column-to-Drilled Shaft Socket Connections
DAMAGE PROGRESSION
This chapter defines the damage states and describes the damage progression. The progression of damage throughout the test was recorded with detailed sketches, measurements of crack propagation and crack widths, and photos (see appendix C).
Definitions of Damage States
The performance of each specimen was related to key damage states, as defined in the University of Washington Pacific Earthquake Engineering Research (PEER) Center Structural Performance Database and defined in table 4.(20) These states provided a convenient basis for comparing the progression of damage in the specimens.
| Damage Event | Description |
|---|---|
| First significant horizontal crack | Crack width ≥ 0.02 inches |
First significant diagonal crack |
Diagonal crack extends of column diameter. Crack width ≥ 0.02 inches |
| First open residual crack | Residual crack width ≥ 0.01 inches |
| First yield of longitudinal reinforcement | First strain gauge that reaches yield strain (0.00212) |
| First yield of transverse reinforcement | First strain gauge that reaches yield strain (0.00212) |
| First spalling in footing | Observed spalling on surface |
| First spalling in column | Observed flaking, minor spalling |
| Significant spalling in column | Spalled height ≥ of column diameter |
| Fully spalled | Spalling height no longer increases with increasing deformation |
| Exposure of longitudinal reinforcement | First observation of column longitudinal reinforcement. |
| Buckling of longitudinal reinforcement | First observation of column longitudinal bar buckling. |
| Large cracks in concrete core | Crack width ≥ 0.08 inches |
| Fracture of transverse reinforcement | Observation or sound |
| Fracture of longitudinal reinforcement | Observation or sound |
| Loss of axial capacity | Instability of member |
Damage Progression
On the day before testing, pre-test cycles were performed to verify that the instruments were working correctly. The columns were loaded axially up to 90 kips and were cycled at +/- 0.035 percent lateral drift. No cracks were detected.
On the day of testing, each column was loaded vertically to 159 kips, which corresponded to the scaled-down, unfactored dead load on the bridge column. That vertical load was kept constant throughout the test.
The lateral excitation history consisted of sets of four cycles and was controlled in terms of lateral displacement. The amplitudes of the cycles were described in chapter 3. The positive loading direction (with a maximum at "peak") was defined by the actuator being in tension and displacements to the south. Each new set of cycles started in the positive direction. In the negative direction, the extreme displacement is referred to as the "valley."
The continuity of the loading differed among the cycles of each set. In the first two cycles of each set, cycling was interrupted at extreme displacements ("peak" and "valley") to allow inspection of cracks. At zero displacement, between cycles, the biggest residual crack width was measured. In the second two cycles, the loading was continuous with no interruptions and no cracks were inspected or marked.
Specimens DS-1 and DS-2 were each subjected to a total of 38 cycles (up to cycle 10-2). The results are shown in table 5 and figure 10, where they are compared with the results of spread footing specimens SF-1 and SF-2 of Haraldsson and SF-3 of Janes.(10,14) It should be noted that, for many damage states, close correlation between the drilled shaft and spread footing specimens should not be expected because the two systems behave rather differently. For example, in the drilled shafts, the drift ratio was computed by dividing the total displacement at the load point by the height (60 inches) of the column alone, regardless of any lateral deformation over the height of the shaft. The same definition of drift ratio was used in the spread footing connections, but in them, there was no lateral deformation of the footing.
The details of the damage progression for specimens DS-1 and DS-2 are also shown in figure 10. In the initial cycles, up to about 0.7 percent drift ratio, the cracks in both specimens were fine and closed almost completely at zero displacement between cycles. At about 0.7 percent drift ratio, the longitudinal steel in the column yielded and the first significant horizontal cracks appeared. Those cracks did not close completely when the load dropped to zero.
After the longitudinal column reinforcement yielded, the behaviors of specimens DS-1 and DS-2 differed significantly. In DS-1, the damage was concentrated in the column, and the specimen eventually failed by fracture of the longitudinal steel in the plastic hinge region of the column, in what might be thought of as a typical column failure. The longitudinal bars buckled, causing a kink in the spiral steel, which initiated its fracture. After the spiral fractured, the longitudinal bars straightened and re-buckled with each load cycle and eventually fractured due to the low-cycle fatigue caused by the alternate bending and straightening. The longitudinal steel in the shaft never yielded, and the transverse steel in the shaft yielded but never fractured. This behavior, characterized by concentration of damage in the column, was similar to that of specimens SF-1 and SF-2.
Damage Event |
Specimen DS-1 |
Specimen DS-2 |
Specimen |
Specimen |
Specimen |
||||||||||||||||
|---|---|---|---|---|---|---|---|---|---|---|---|---|---|---|---|---|---|---|---|---|---|
Shaft |
Column |
Shaft |
Column |
||||||||||||||||||
Set |
Cycle |
Drift (%) |
Set |
Cycle |
Drift (%) |
Set |
Cycle |
Drift (%) |
Set |
Cycle |
Drift (%) |
Set |
Cycle |
Drift (%) |
Set |
Cycle |
Drift (%) |
Set |
Cycle |
Drift (%) |
|
First significant horizontal crack |
4 |
2 |
0.72 |
4 |
1 |
0.56 |
4 |
2 |
0.72 |
4 |
2 |
0.72 |
4 |
1 |
0.69 |
3 |
2 |
0.56 |
3 |
1 |
0.49 |
First significant diagonal crack |
6 |
1 |
1.52/ |
5 |
2 |
1.13/ |
6 |
1 |
1.49/ |
6 |
1 |
1.49/ |
6 |
1 |
1.68/ |
6 |
1 |
1.74 |
6 |
1 |
1.71 |
First open residual crack |
5 |
3 |
1.16/ |
5 |
2 |
1.13/ |
6 |
2 |
1.89/ |
6 |
2 |
1.89/ |
6 |
1 |
1.68/ |
4 |
3 |
0.88/ |
5 |
1 |
1.13/-1.23 |
First yield of longitudinal reinforcement |
N/A |
N/A |
N/A |
4 |
2 |
0.72 |
N/A |
N/A |
N/A |
4 |
1 |
0.58 |
3 |
1 |
-0.55 |
3 |
2 |
0.47 |
3 |
1 |
-0.51 |
First yield of transverse reinforcement |
8 |
1 |
3.71/ |
N/A |
N/A |
N/A |
6 |
3 |
1.92/ |
N/A |
N/A |
N/A |
9 |
1 |
0.33 |
9 |
2 |
-5.41 |
8 |
2 |
-4.77 |
First spalling in footing |
6 |
1 |
1.52/ |
N/A |
N/A |
N/A |
7 |
1 |
2.38/ |
N/A |
N/A |
N/A |
N/A |
N/A |
N/A |
N/A |
N/A |
N/A |
9 |
2 |
7.11/ |
First spalling in column |
N/A |
N/A |
N/A |
5 |
2 |
1.13/ |
N/A |
N/A |
N/A |
N/A |
N/A |
N/A |
5 |
1 |
1.07/ |
5 |
1 |
1.10/ |
5 |
3 |
1.41/ |
Significant spalling in column |
N/A |
N/A |
N/A |
7 |
2 |
3.00/ |
N/A |
N/A |
N/A |
N/A |
N/A |
N/A |
6 |
2 |
-2.25 |
7 |
1 |
2.64 |
6 |
2 |
2.13/ |
Full spalling in column |
N/A |
N/A |
N/A |
9 |
2 |
6.88/ |
N/A |
N/A |
N/A |
N/A |
N/A |
N/A |
9 |
3 |
7.08/ |
8 |
1 |
3.98 |
9 |
1 |
5.84/ |
Exposure of longitudinal reinforcement |
N/A |
N/A |
N/A |
9 |
3 |
6.90/ |
9 |
3 |
6.89/ |
N/A |
N/A |
N/A |
9 |
1 |
-5.68 |
9 |
2 |
-6.85 |
9 |
3 |
7.15/ |
Buckling of longitudinal reinforcement |
N/A |
N/A |
N/A |
9 |
3 |
6.90/ |
N/A |
N/A |
N/A |
N/A |
N/A |
N/A |
9 |
2 |
7.09/ |
9 |
3 |
7.19/ |
9 |
3 |
7.15/ |
Large cracks in concrete core |
N/A |
N/A |
N/A |
7 |
2 |
3.00/ |
7 |
1 |
2.38/ |
6 |
1 |
1.49/ |
10 |
2 |
10.61 |
10 |
2 |
-9.95 |
10 |
2 |
10.58/ |
Fracture of transverse reinforcement |
N/A |
N/A |
N/A |
10 |
1 |
8.43 |
8 |
2 |
4.59 |
N/A |
N/A |
N/A |
9 |
2 |
-6.88 |
10 |
1 |
-8.29 |
10 |
1 |
8.72 |
Fracture of longitudinal reinforcement |
N/A |
N/A |
N/A |
10 |
2 |
10.49 |
N/A |
N/A |
N/A |
N/A |
N/A |
N/A |
10 |
2 |
10.61 |
10 |
2 |
10.65 |
N/A |
N/A |
N/A |
Loss of axial capacity |
N/A |
N/A |
N/A |
N/A |
N/A |
N/A |
N/A |
N/A |
N/A |
N/A |
N/A |
N/A |
N/A |
N/A |
N/A |
N/A |
N/A |
N/A |
10 |
3 |
10.7 |
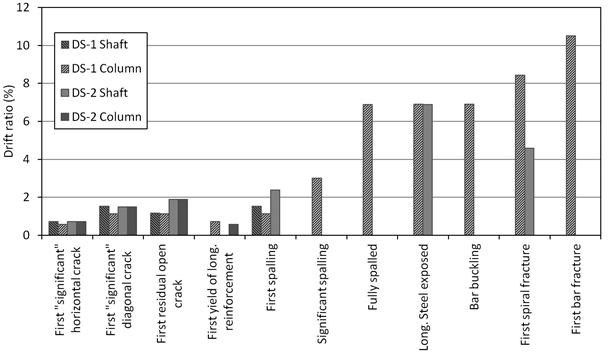
Figure 10. Chart. Comparison of specimens' drift ratios for the major damage states.
In specimen DS-2, the amount of spiral steel in the shaft was only half that in specimen DS-1. It is therefore not surprising that the transverse reinforcement in the shaft yielded earlier in DS-2 and subsequently fractured. The behavior of the specimen was characterized by very large cracks opening in the shaft, which suffered extensive shear deformations as a result. Failure was initiated by fracture of the spiral steel in the shaft, starting at the top and progressing downwards. The damage to the shaft caused the load to drop even though the drift was increasing. The longitudinal bars in the column did not buckle, and by observation, it was known that the spirals in the column never fractured.
In the drilled shaft specimens, shear sliding between the precast column and cast-in-place shaft was an important behavioral mechanism. No instrumental measurements could be made, so visual observations provided the only available evidence, and those observations could be made primarily after the test was complete. Figure 11 shows specimen DS-1 after the test. The damage to the shaft exists mainly in the small region of top cover concrete above the ends of the vertical bars. In the remainder of the shaft, the column is still held firmly by friction. Figure 12 shows specimen DS-2 after testing. There, the shaft has been pried open by the lateral movements of the column so the column could be lifted freely out of the shaft with no frictional resistance. The prying action on the shaft yielded the transverse steel in it and led to the large deformations.
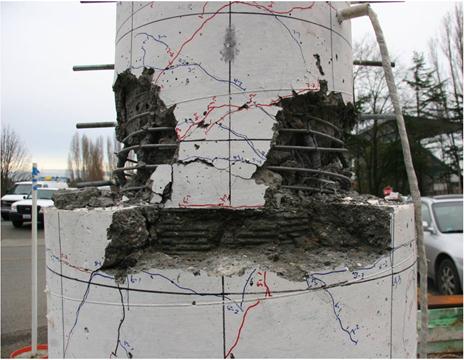
Figure 11. Photo. Specimen DS-1 after testing.
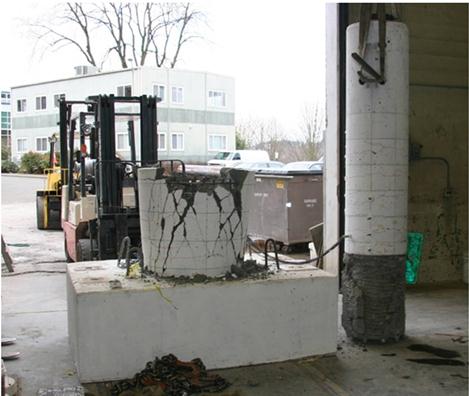
Figure 12. Photo. Specimen DS-2 after testing.