

Precast Bent System for High Seismic Regions: Laboratory Tests of Column-to-Drilled Shaft Socket Connections
EXPERIMENTAL PROGRAM
Quasi-static, cyclic tests were performed to evaluate the seismic performance of two column-to-drilled-shaft connections (DS-1 and DS-2). In such testing, deformations are applied at a rate much lower than would be applied during an earthquake.
This chapter describes the test setup, displacement history, instrumentation, and data acquisition. The two drilled-shaft tests were part of a larger research program seeking to develop a family of connections for rapid construction of bridges. Therefore, the experimental program for these tests was similar the ones conducted by Haraldsson and Janes on spread footings.(10,14)
Test Setup
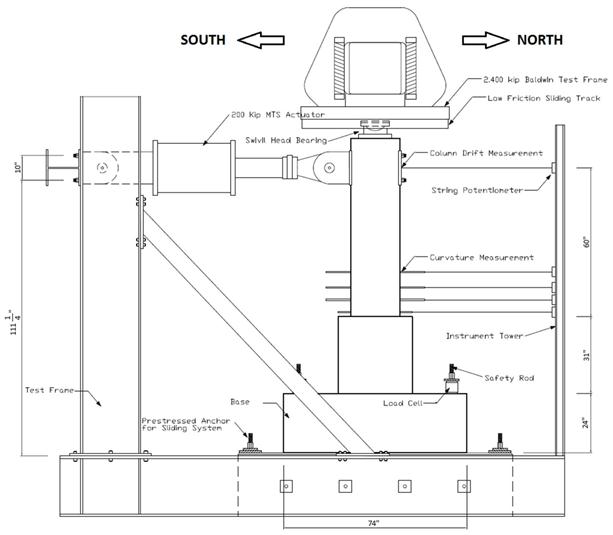
The two specimens were tested by using the self-reacting rig shown in figure 5. The rig included a base, two vertical columns, a horizontal beam, two diagonal braces, and a servo-controlled actuator:
- The base consisted of two blocks of concrete, attached to two W24x94 beams, one on each side of the blocks. These components were post-tensioned together by four, threaded Williams bars placed in plastic tubes through the blocks and beams.
- Two vertical W24x94 columns were welded at the end of the two base beams.
- A horizontal W14x14 beam was bolted to the two vertical columns at the same level as the lateral load.
- The two vertical beams of the frame were stiffened on each side with a diagonal horizontal structural section (HSS) 6x6x3/8.
- The lateral loads were applied to the column with a servo-controlled actuator with a capacity of 220 kips. One end of the actuator was attached to the column, and the other end was connected to the horizontal beam.
The specimens were positioned in the rig, leveled with shims, and then attached to the base with Hydro-stone. To prevent the specimen from overturning under cyclic excitations, four threaded 1.25-inch-diameter Williams bars were placed in plastic tubes through the footing of specimens and threaded into nut cast into the concrete block of the rig's base. The top nuts on these bolts were tightened to 125 kips to hold the footing of the specimens down to the base.
The column axial load was provided by the 2.4-million-lb. Baldwin Universal Testing Machine. The force was transferred to the column through a spherical bearing. The top of the bearing slid in a channel attached to the Baldwin. To minimize friction, the spherical surface of the bearing was greased, a stainless steel plate was placed in the channel, and a greased sheet of polytetraflouroethylene (PTFE) was glued to the top and the sides of the bearing.
Instrumentation
The axial load applied in the top of column was monitored by load cells in the Baldwin Universal Testing Machine. The lateral load was monitored by load cells in the MTS actuator. The response of the specimen was monitored by potentiometers, linear variable differential transformers (LVDTs), a research-grade motion capture system, and strain gauges.
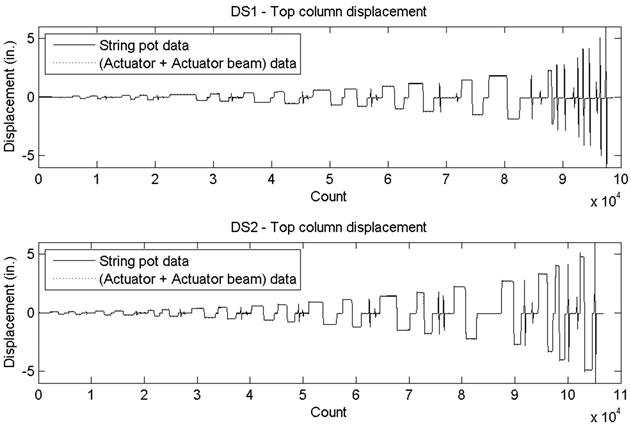
The horizontal displacement of the column at the elevation of the lateral load (60 inches above the column-shaft interface) was monitored in two ways. On the north side, the displacement of the column was monitored with a string potentiometer attached to a steel reference column, which was unloaded, as shown in figure 6. In addition, the actuator displacement was monitored using the LVDT built into the actuator, and the displacement of the loading frame with respect to another unloaded frame was monitored by another LVDT (on the south side). Thus, a second measure of the absolute displacement of the column was calculated as the sum of displacement of the actuator (MTS LVDT in figure 6) and the deformation of test rig. These two ways of measuring the top displacement yielded nearly identical results, as shown in figure 7.
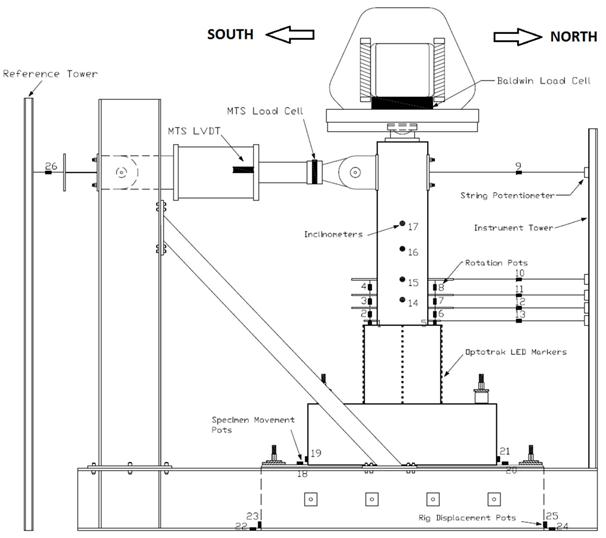
The horizontal displacements of the column and transition region were monitored by string potentiometers. Four string potentiometers were connected to the end of the four north curvature rods to measure the displacement of column at these positions. The relative displacements between the footing of specimens and concrete blocks, and between the concrete blocks and ground, were captured by potentiometers. Four potentiometers (numbered 18 through 21) were used to capture uplift and slip relative displacement between the footing and concrete block in the north and south side. Another four potentiometers (numbered 22 through 25) were used to captured uplift and slip relative displacement between the concrete block and ground in the north and south side. The positions of these potentiometers are shown in figure 6.
To determine relative rotations of the column for the four segments at the base of the column, eight potentiometers (numbered 1 through 8) were set up in the north and south sides to measure the relative displacement of threaded rods (called curvature rods). The relative rotation calculation is provided in the next chapter. The rods were located 2, 7, 12, and 18 inches above the interface. Detailed installation is illustrated in figure 6. To determine absolute rotations of the column, four inclinometers (numbered 14 through 17) were attached on the east side of the column at 10, 18, 30, and 40 inches above the interface.
Strain gauges were attached to some key shaft and column longitudinal reinforcing bars, and in shaft spirals in the transition area of the column and shaft, as shown in figure 8.
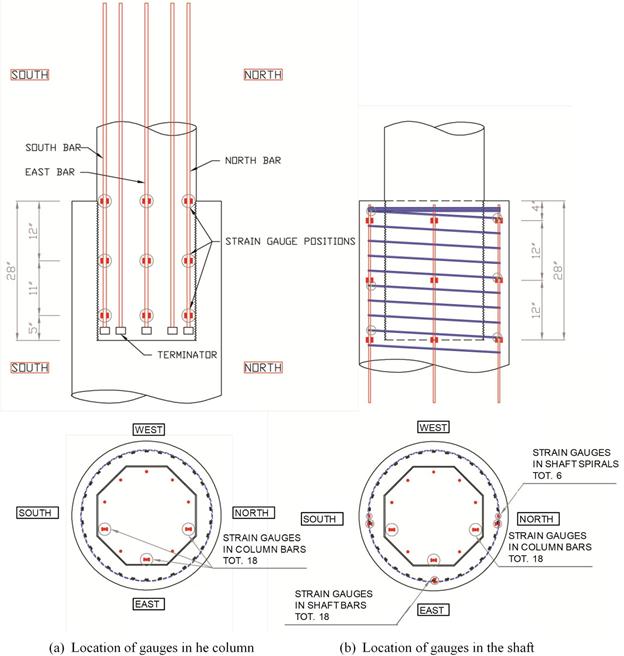
The gauges on the longitudinal bars and spiral were installed at three levels - top, middle, and bottom of the transition - to capture strain data to help understand the mechanism, force distribution, and behavior of the connection. All strain gauges were supplied by Texas Instruments, type FLA-6-11-5LT, which were used to reduce the effect of temperature variations on the recorded data.
Markers of the research-grade motion capture system were attached to the column and shaft surface in the north, west, and south sides to measure displacement (see figure 6). Another four markers were attached close to the north curvature rods' positions to compare the data of the string pots and the motion capture system. In specimen DS-2, more markers were set up in the column to determine the rotation of the column to compare with the inclinometer data. As discussed in chapter 5, the research-grade motion capture system and the potentiometers provided consistent results.
Data were recorded with a sampling rate 4Hz using LabVIEW software.
Displacement History
First, the axial load applied in the column was increased to an unfactored dead load value of 159 kips. This axial load was kept constant until the end of testing. Later, the specimen was subjected to displacement controlled cyclic excitation. The displacement history was the same as in previous testing in the Rapid Construction project at the University of Washington. (See references 5, 8, 10, and 14.) This displacement history was a modification of a loading history for precast structural walls recommended in the National Earthquake Hazards Reduction Program (NEHRP).(19)
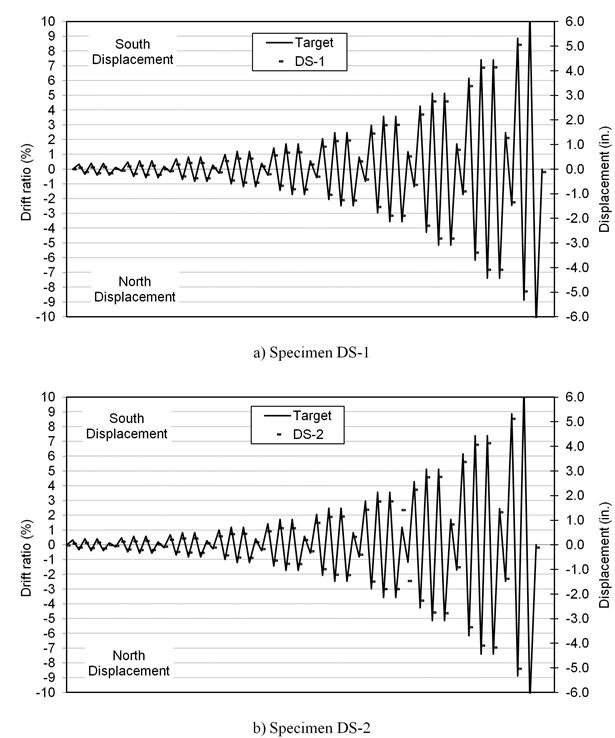
The displacement history included of sets of four cycles. The peak amplitudes of the cycle in a set were 1.2A, 1.4A, 1.4A, and 0.33A, where A is the maximum peak amplitude in the previous set. The small amplitude cycle was intended to evaluate the residual small-displacement stiffness in the specimen after the maximum peak amplitude cycle of each set. In all cycles, the actuator moved from zero displacement to the peak cycle displacement in 20 seconds. The positive and negative peak displacement were called "peak" and "valley." After peak loading to the south, where the longitudinal column reinforcement in specimen DS-1 fractured and the shaft transverse reinforcement in specimen DS-2 fractured, the testing was stopped. The target displacement history is provided in figure 9 and table 3.
| Set | Cycle | Drift Ratio (%) |
Displ. (in.) | DS-1 Displ. (in.) |
DS-2 Displ. (in.) |
Set | Cycle | Drift Ratio (%) | Displ. (in.) | DS-1 Displ. (in.) |
DS-2 Displ. (in.) |
|||
|---|---|---|---|---|---|---|---|---|---|---|---|---|---|---|
| 1 | 1 | ±0.33 | ±0.20 | P | 0.06 | 0.05 | 6 | 1 | ±2.06 | ±1.24 | P | 0.91 | 0.90 | |
| V | -0.12 | -0.12 | V | -1.03 | -0.99 | |||||||||
| 2 | ±0.40 | ±0.24 | P | 0.08 | 0.09 | 2 | ±2.48 | ±1.49 | P | 1.15 | 1.13 | |||
| V | -0.16 | -0.14 | V | -1.25 | -1.21 | |||||||||
| 3 | ±0.40 | ±0.24 | P | 0.09 | 0.10 | 3 | ±2.48 | ±1.49 | P | 1.17 | 1.15 | |||
| V | -0.16 | -0.15 | V | -1.26 | -1.22 | |||||||||
| 4 | ±0.13 | ±0.08 | P | 0.01 | -0.01 | 4 | ±0.83 | ±0.50 | P | 0.32 | 0.32 | |||
| V | -0.06 | -0.04 | V | -0.42 | -0.40 | |||||||||
| 2 | 1 | ±0.48 | ±0.29 | P | 0.11 | 0.13 | 7 | 1 | ±2.97 | ±1.78 | P | 1.45 | 1.43 | |
| V | -0.19 | -0.18 | V | -1.53 | -1.50 | |||||||||
| 2 | ±0.58 | ±0.35 | P | 0.14 | 0.15 | 2 | ±3.57 | ±2.14 | P | 1.80 | 1.75 | |||
| V | -0.22 | -0.21 | V | -1.88 | -1.80 | |||||||||
| 3 | ±0.58 | ±0.35 | P | 0.15 | 0.16 | 3 | ±3.57 | ±2.14 | P | 1.81 | 1.77 | |||
| V | -0.22 | -0.21 | V | -1.89 | -1.80 | |||||||||
| 4 | ±0.19 | ±0.12 | P | 0.01 | 0.02 | 4 | ±1.19 | ±0.71 | P | 0.53 | 1.42 | |||
| V | -0.07 | -0.07 | V | -0.63 | -1.47 | |||||||||
| 3 | 1 | ±0.69 | ±0.41 | P | 0.20 | 0.21 | 8 | 1 | ±4.28 | ±2.57 | P | 2.23 | 2.24 | |
| V | -0.29 | -0.28 | V | -2.29 | -2.27 | |||||||||
| 2 | ±0.83 | ±0.50 | P | 0.26 | 0.25 | 2 | ±5.14 | ±3.08 | P | 2.76 | 2.75 | |||
| V | -0.36 | -0.32 | V | -2.81 | -2.75 | |||||||||
| 3 | ±0.83 | ±0.50 | P | 0.26 | 0.26 | 3 | ±5.14 | ±3.08 | P | 2.76 | 2.76 | |||
| V | -0.36 | -0.33 | V | -2.81 | -2.77 | |||||||||
| 4 | ±0.28 | ±0.17 | P | 0.04 | 0.06 | 4 | ±1.71 | ±1.03 | P | 0.79 | 0.83 | |||
| V | -0.12 | -0.11 | V | -0.89 | -0.90 | |||||||||
| 4 | 1 | ±1.00 | ±0.60 | P | 0.34 | 0.35 | 9 | 1 | ±6.16 | ±3.70 | P | 3.38 | 3.38 | |
| V | -0.45 | -0.42 | V | -3.39 | -3.35 | |||||||||
| 2 | ±1.19 | ±0.72 | P | 0.43 | 0.43 | 2 | ±7.40 | ±4.44 | P | 4.13 | 4.07 | |||
| V | -0.55 | -0.52 | V | -4.09 | -4.10 | |||||||||
| 3 | ±1.19 | ±0.72 | P | 0.44 | 0.44 | 3 | ±7.40 | ±4.44 | P | 4.14 | 4.13 | |||
| V | -0.55 | -0.53 | V | -4.09 | -4.17 | |||||||||
| 4 | ±0.40 | ±0.24 | P | 0.12 | 0.11 | 4 | ±2.47 | ±1.48 | P | 1.28 | 1.33 | |||
| V | -0.20 | -0.17 | V | -1.34 | -1.38 | |||||||||
| 5 | 1 | ±1.43 | ±0.86 | P | 0.56 | 0.55 | 10 | 1 | ±8.87 | ±5.32 | P | 5.06 | 5.12 | |
| V | -0.67 | -0.64 | V | -4.96 | -5.04 | |||||||||
| 2 | ±1.72 | ±1.03 | P | 0.68 | 0.67 | 2 | ±10.65 | ±6.39 | P | 6.30 | 6.20 | |||
| V | -0.81 | -0.77 | V | -6.01 | -6.03 | |||||||||
| 3 | ±1.72 | ±1.03 | P | 0.69 | 0.68 | 3 | ±10.65 | ±6.39 | P | |||||
| V | -0.82 | -0.78 | V | |||||||||||
| 4 | ±0.57 | ±0.34 | P | 0.20 | 0.19 | 4 | ±3.55 | ±2.13 | P | |||||
| V | -0.30 | -0.27 | V | |||||||||||