


Patrick DeCorla-Souza
P3 Program Manager
Center for Innovative Finance Support

Marcel Ham
Vice President
IMG/Rebel
Part 2 Benefit-Cost Analysis (BCA) Process
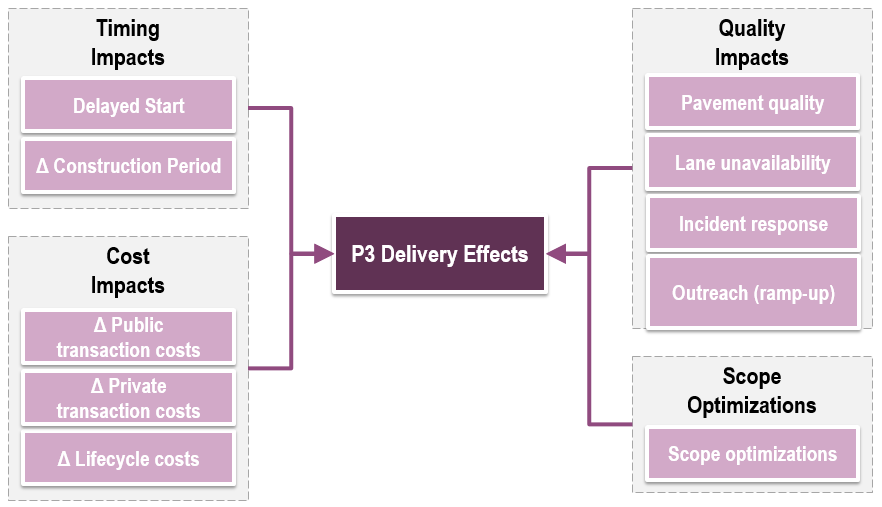
Part 3 P3 Delivery Economic Differences
Part 4 Benefit-Cost Analysis using P3-VALUE 2.0
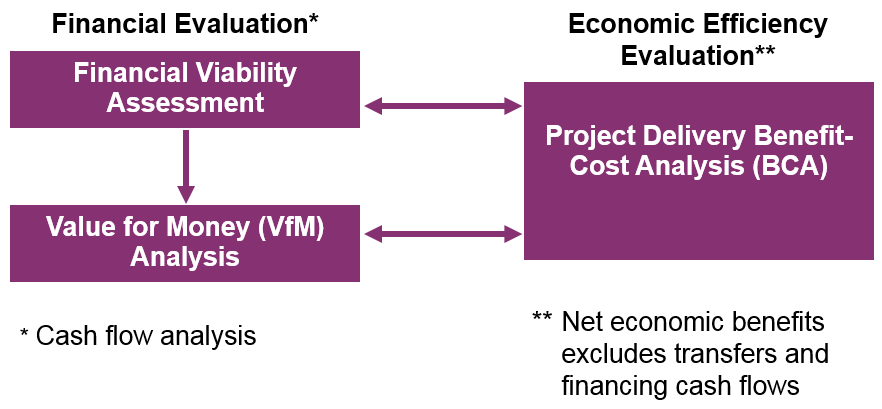
View full-size flow chart showing Types of Project Delivery Evalution
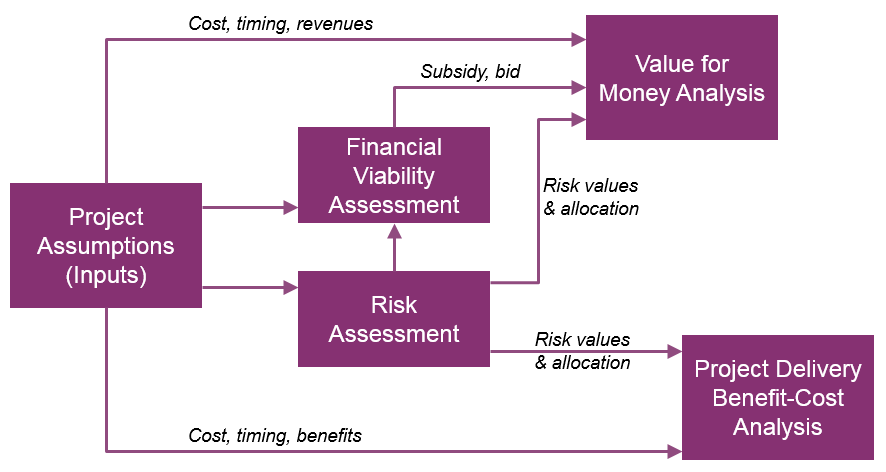
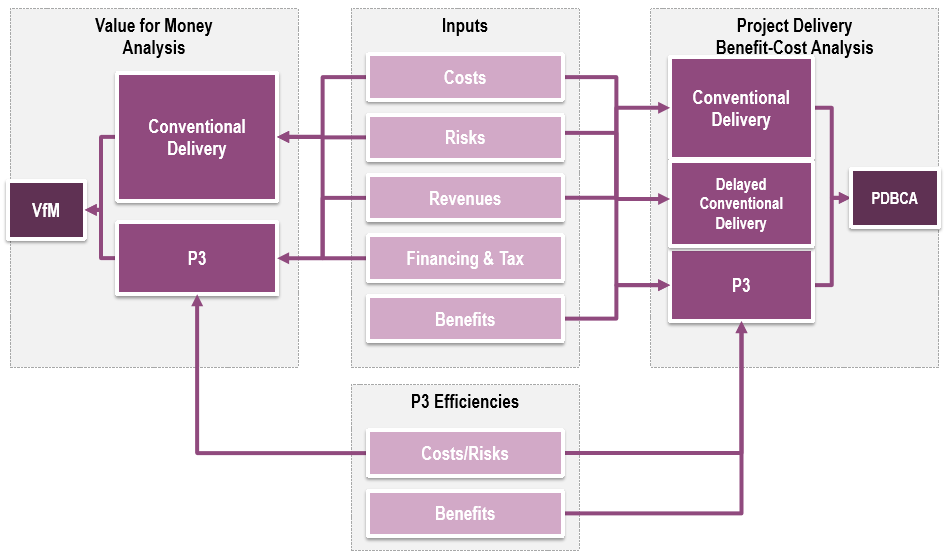
View full-size P3-VALUE 2.0 Tool Structure flow chart
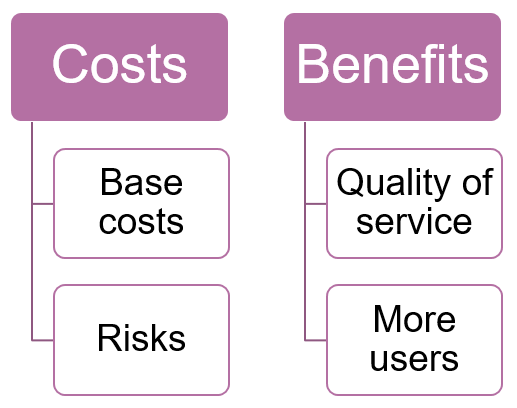
| Project Cost | Benefit-Cost Analysis | Value for Money |
|---|---|---|
| Capital cost | ✓ | ✓ |
| O&M cost | ✓ | ✓ |
| Risk | ✓ | ✓ |
| Public transaction costs | ✓ | ✓ |
| Private transaction costs (winning bid) | ✓ | ✓ |
| Private transaction costs (losing bids) | ✓ | ✕ |
| Other Social Impacts | Benefit-Cost Analysis | Value for Money |
|---|---|---|
| User Benefits | ||
| Travel time cost | ✓ | ✕ |
| Incident/accident cost | ✓ | ✕ |
| Vehicle operation cost | ✓ | ✕ |
| Accident cost | ✓ | ✕ |
| Externalities | ||
| Emission costs | ✓ | ✕ |
| Purely Financial Transactions, i.e., Economic Transfers | Benefit-Cost Analysis | Value for Money |
|---|---|---|
| Revenues | ✕ | ✓ |
| Taxes | ✕ | ✓ |
| Debt and equity contributions | ✕ | ✓ |
| Interest and dividend payments | ✕ | ✓ |
| Benefit-Cost Analysis | Value for Money | |
|---|---|---|
| Dollar values | Real | Nominal |
| Discount rate for NPV calculations | Real | Nominal |
True or False
Submit a question using the chat box
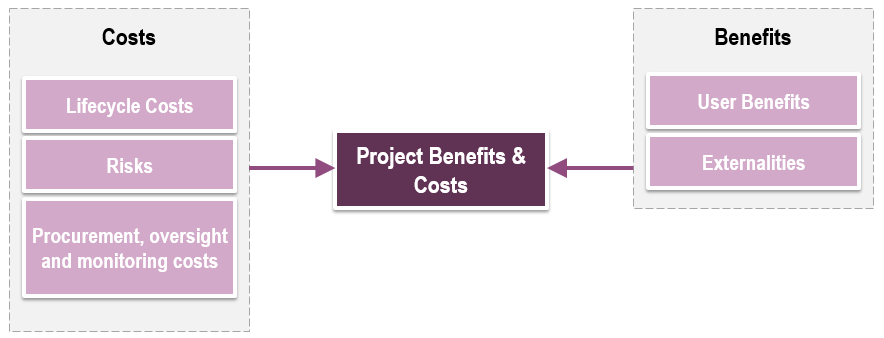
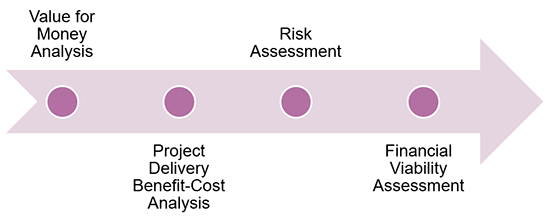
View full-size Benefit-Cost Evaluation Process graphic
View full-size Project Delivery BCA Framework chart
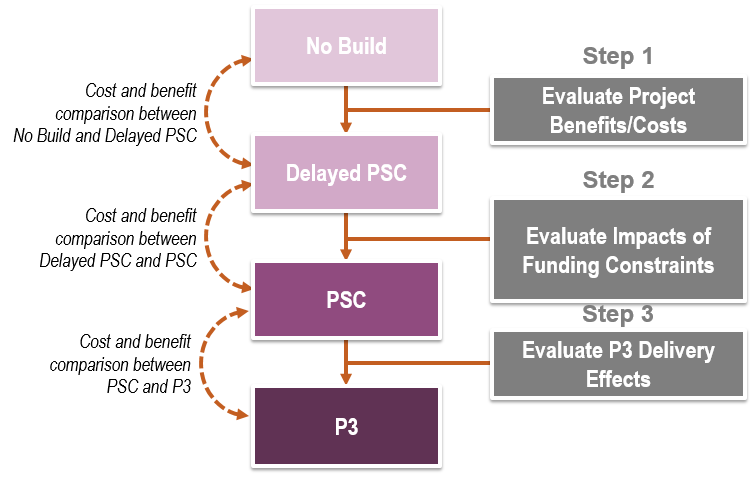
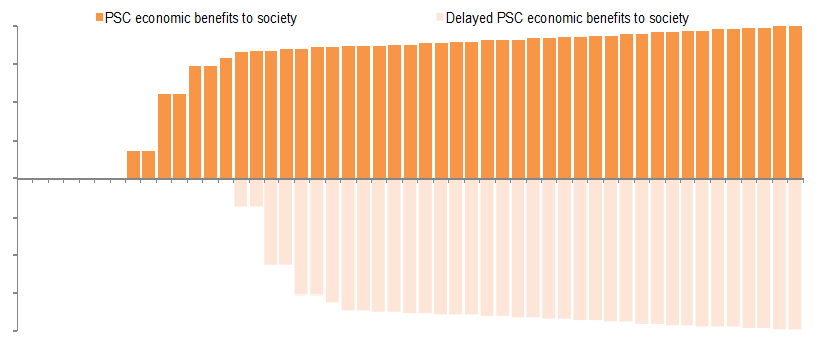
Delayed Conventional Delivery compared to No Build
Delayed Conventional Delivery (Delayed PSC) compared to Conventional Delivery (PSC)
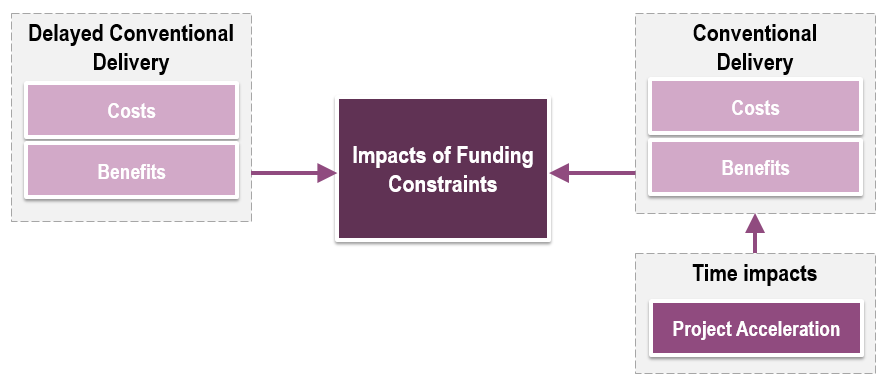
Conventional Delivery (PSC) compared to P3
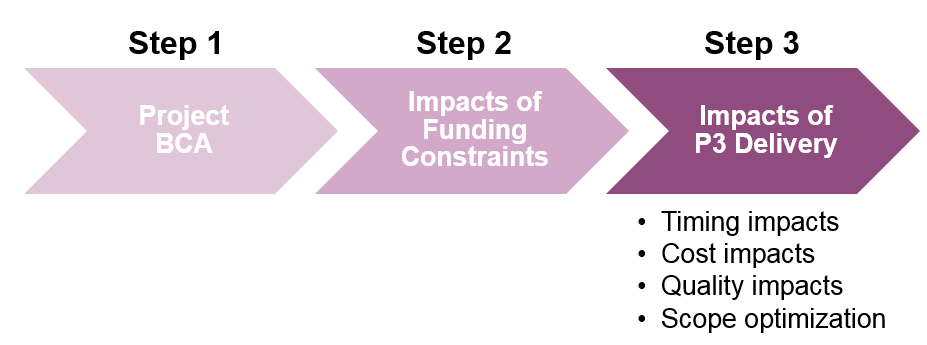
P3 can delay or accelerate project:
Impacts of acceleration are:
| Benefit Category | Estimation based on: |
|---|---|
| Pavement quality adjustment to vehicle operating costs |
|
| Delays during construction due to lane unavailability |
|
| Delays during operation due to lane unavailability |
|
| Delays during operation due to incidents |
|
| Faster traffic ramp-up due to P3 innovations & outreach activities |
|
| Cost item | Delayed PSC ($M) |
PSC ($M) |
P3 ($M) |
|---|---|---|---|
| Planning and preparation costs | |||
| Procurement costs | |||
| Design and engineering costs | |||
| Construction costs | |||
| O&M costs | |||
| Major maintenance costs | |||
| Contingencies | |||
| Base variability | |||
| Systematic risks and uncertainties | |||
| Total costs for Build Alternative | |||
| No Build cost savings | |||
| Total economic costs |
| Benefit item | Delayed PSC ($M) |
PSC ($M) |
P3 ($M) |
|---|---|---|---|
| Travel time savings | |||
| Vehicle operating cost savings | |||
| Fuel cost savings | |||
| Environmental benefits | |||
| Safety benefits | |||
| Other benefits | |||
| Disbenefits during construction | |||
| P3 quality impacts | |||
| Economic benefits - existing users | |||
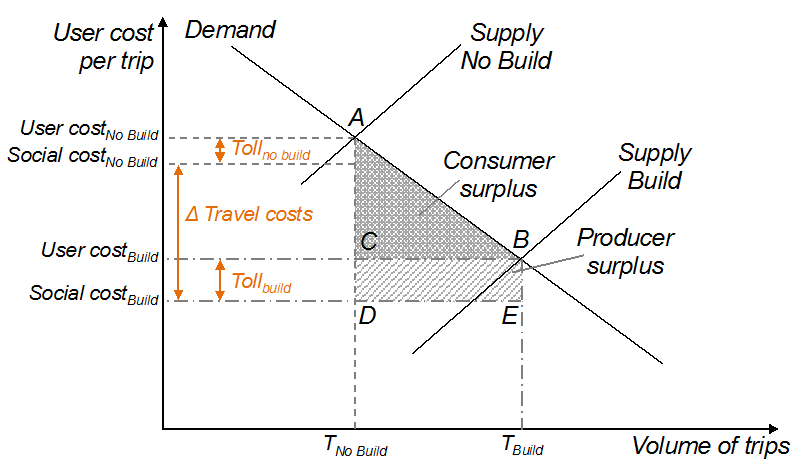
| Consumer surplus - "new" users | |||
| Producer surplus - "new" users | |||
| Total economic benefits |
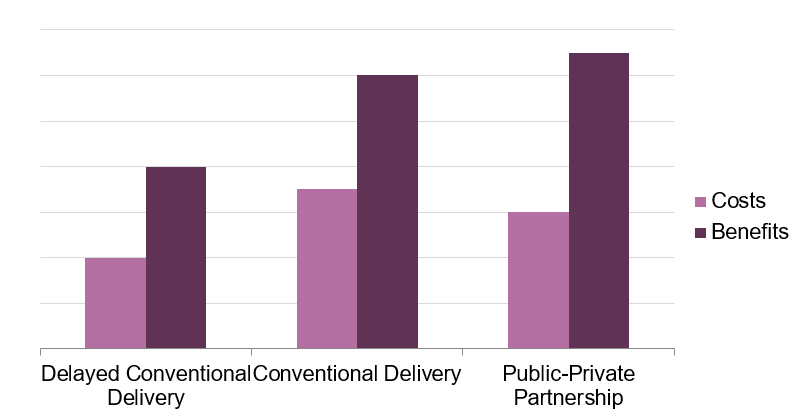
Delivery models compared to No Build
| Perspective | Financial Analysis (VfM) | Economic Analysis (PDBCA) |
|---|---|---|
| Agency | Costs to Agency's balance sheet | Agency costs plus societal benefits |
| State | Costs to State | State costs plus societal benefits |
| National | Societal costs | Societal costs and benefits (true BCA) |
True or False
Benefits from project acceleration may not necessarily be attributable to P3 delivery.
Submit a question using the chat box
Earlier construction completion: Increase in years of benefits
| Fuel cost % adjustment | Non-fuel cost % adjustment | |||
|---|---|---|---|---|
| Parameters >> | 2 axle | 4+ axle | 2 axle | 4+ axle |
| IRI | % | % | % | % |
| 0 | 97.05% | 96.07% | 100.00% | 100.00% |
| 25 | 97.68% | 96.53% | 100.00% | 100.00% |
| 50 | 98.00% | 97.04% | 100.00% | 100.00% |
| 75 | 98.24% | 97.53% | 100.00% | 100.00% |
| 100 | 98.46% | 97.99% | 100.00% | 100.00% |
| 150 | 99.52% | 99.31% | 101.65% | 101.84% |
| 200 | 100.53% | 100.74% | 105.20% | 105.78% |
| 250 | 101.95% | 102.57% | 108.76% | 109.73% |
| 300 | 103.39% | 104.68% | 112.31% | 113.67% |
| 350 | 105.01% | 107.03% | 115.86% | 117.62% |
| 400 | 107.16% | 109.96% | 119.41% | 121.57% |
| 450 | 109.31% | 112.89% | 122.96% | 125.51% |
 Work zone practices: Estimated 45% speed reduction in work zones, applied:
| Level of congestion | Daily traffic volume per lane | Speed reduction factor |
|---|---|---|
| Uncongested | Under 15,000 | 5% |
| Medium | 15,001 -17,500 | 5% |
| Heavy | 17,501 - 20,000 | 9% |
| Severe | 20,001 - 25,000 | 18% |
| Extreme | Over 25,000 | 23% |
Rule of Half
Submit a question using the chat box
View full-size flow chart of the P3-VALUE 2.0 elements
Training Modules
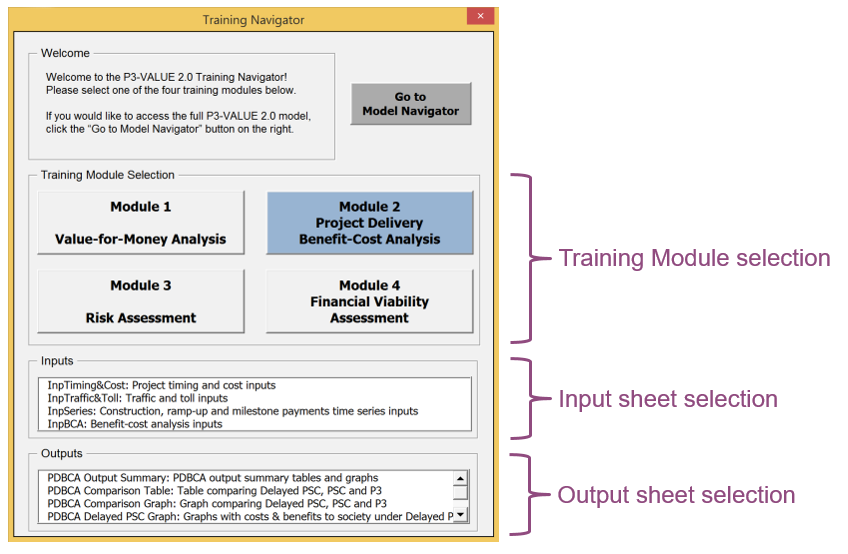
View full-size Navigator User Interface
Please stand by as we open the Excel file
Submit a question using the chat box
Part 1 Introduction
Part 2 Benefit-Cost Analysis (BCA) Process
Part 3 P3 Delivery Economic Differences
Part 4 Benefit-Cost Analysis using P3-VALUE 2.0
To access the Exercise Review webinar, please use the following link and telephone number:
Link: https://connectdot.connectsolutions.com/p3
Telephone: 1-888-363-4749, Passcode: 6139168#
FHWA's Center for Innovative Finance Support Website: https://www.fhwa.dot.gov/ipd/
P3 Website: https://www.fhwa.dot.gov/ipd/p3/
Patrick DeCorla-Souza
P3 Program Manager
Center for Innovative Finance Support
Federal Highway Administration (202) 366-4076
Patrick.DeCorla-Souza@dot.gov
Submit a question using the chat box