


- Household Travel in America
- Shifting Travel Patterns
- Aging of U.S. Population and Impact on Travel Demand
- Immigration and Growing Diversity of U.S. Population
- Overall Trends in Demand
- Trip-Making and Mode-Sharing Trends
- How People Use the Transportation System
- Work Travel
- Non-Work Travel
- Household Vehicle Use and Greenhouse Gas Impacts
- Shifting Travel Patterns
Household Travel in America
Over 300 million people in the United States make decisions every day about how to travel for work, shopping, and social reasons—choices based on habits of behavior, personal and household obligations, the choices available and perception of convenience and cost. These individual decisions happen within a larger context of demographic profiles (such as life cycle); economic wherewithal (income); where individuals live; how technology is used; available transportation options; and how the transportation system is used. Personal travel accounts for roughly three-quarters of the measured vehicle miles traveled (VMT) on the Nation's roadways. Commercial and freight vehicles account for the remaining travel.
This chapter draws heavily from the National Household Travel Survey (NHTS), the Nation's authoritative source of statistical data on the travel of the American public. This survey has been conducted in 1969, 1977, 1983, 1990, 1995, 2001, and 2009. Each update in the series provides a snapshot of personal daily travel, including the number of persons and vehicles in movement through an average day by all modes (automobile, transit, bike, walk, etc.) and for all purposes. The 2009 NHTS data represent a valuable resource that can be tapped for a wide array of analyses on a variety of topics; this chapter focuses on three such topics: (1) shifting travel demand resulting from demographic factors; (2) how people use the transportation system; and (3) household vehicle use and greenhouse gas impacts.
|
National Household Travel Survey (NHTS) Methodology The NHTS collects travel data from a representative sample of U.S. households to characterize personal travel patterns. The survey includes demographic characteristics of households and people and information about all vehicles in the household. Details of travel by all modes for all purposes of each household member are collected for a single assigned travel day. In this way, the NHTS traces both the interaction of household members and the use of each household vehicle throughout an average day. The data provide national and, with the 2009 survey, State-level estimates of trips and miles by travel mode, trip purpose, time of day, gender and age of traveler, and a wide range of attributes. Much of the data presented in this section is from the NHTS data series, unless otherwise noted. Since 1990, the NHTS has been collected using a random digit dial sample of telephone households in the United States. Earlier surveys were collected in face-to-face interviews sampled from respondents to the Census Bureau's Current Population Survey. Additional information on the NHTS is available at www.fhwa.dot.gov/policyinformation/nhts.cfm. |
Shifting Travel Patterns
Many factors determine U.S. travel patterns. For example, travel can be affected by technological changes that allow telecommuting and on-line shopping, land-use factors that encourage density and walkable communities, social changes such as growth in social networking, and policy factors such as graduated licensing programs. All of these factors have unique and combined impacts on the travel choices of the U.S. population.
There are many challenges facing transportation policy and planning within each of these areas. While there is a great deal of uncertainty as to how travel demand will be impacted by things like the economy, housing market, and gas prices, studying current individual travel behaviors can provide insight into travel demand and future travel.
This section explores three topics to assess the changing context of travel demand in more detail:
- The aging of the U.S. population and the impact on travel demand
- Immigration and the growing diversity of the U.S. population
- Population redistribution across the United States.
Aging of U.S. Population and Impact on Travel Demand
The aging of the population and the possible effects on travel demand has been the subject of much research and debate. In this decade, the U.S. Census Bureau estimates that the number of seniors and baby boomers will account for approximately one-third of the Nation's total population and exceed 100 million. As the population ages, some experts expect older drivers to travel fewer miles and favor non-peak travel to avoid congested travel conditions. Others foresee mode shifts—especially from single-occupant to multi-occupant vehicles—increased safety challenges, and mobility issues as more older Americans cease driving. (TRB Conference Proceeding 27: Transportation in an Aging Society: A Decade of Experience, Technical Papers and Reports from a Conference, 2004, http://onlinepubs.trb.org/onlinepubs/conf/reports/cp_27.pdf)
Given current population age distribution, the number of older drivers will increase in the future. Exhibit 1-1 shows a conservative projection which assumes that typical driving patterns for older Americans will not change, and that the increase in vehicle miles is fueled by simple population growth estimates through 2050. Even if baby boomers follow historic patterns and reduce their daily travel as they age, the sheer number of added older drivers will significantly increase the number of miles and proportion of national VMT accounted for by older drivers
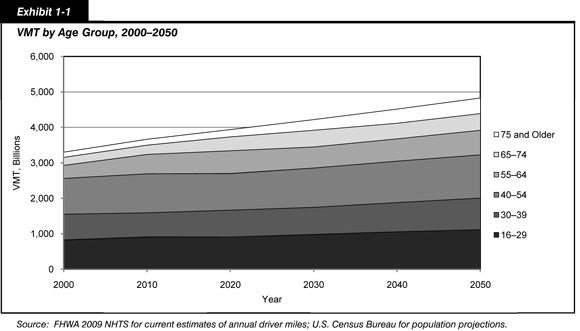
Most researchers expect baby-boomers, especially women, to drive more miles when they age than the current elderly population because boomers are more likely to have licenses, be employed, and have a vehicle. Older Americans driving higher vehicle miles may increase their chance of accidents, change traditional time-of-day profiles of travel, and lead to more emissions because older drivers tend to drive older cars. In addition, the proportion of older drivers who are women will increase dramatically, especially women of Hispanic and Asian ethnicity. Currently only half of older Asian and Hispanic women drive, but 80 percent of Asian and Hispanic women aged 30–54 are drivers. Increasingly, women of all races and ethnicities will become the 80-year-old drivers of the future. As the mix of drivers changes, so will their destination choices, trip lengths, auto occupancies, and vehicle choices.
Immigration and Growing Diversity of U.S. Population
The U.S. population is increasing by about 2 million people annually, about half from immigration and half from births. We are becoming more diverse in terms of race and ethnicity, and immigration is a key cause of that diversity (U.S. Census Bureau); America has always been a melting pot. As these trends continue, this diversity will impact future travel patterns.
Historically, factors that influence growth in travel beyond population growth include the age distribution of the population, auto ownership levels, licensure rates, household size, labor force participation, and real personal income per capita. African-American, Hispanic, and, to some extent, Asian households vary considerably from white households on these key factors. Common among these groups is lower auto ownership, lower household income, greater household size, and lower levels of labor force participation, lower licensure rates, and a population concentration in urban areas.
The differences in key measures of travel are shown in Exhibit 1-2. Households often have differences between the annual trips per household and the annual trips per person. For example, Hispanic households produce the greatest amount of travel annually (nearly 5 thousand trips), but have one of the lowest number of trips per person (1.3 thousand trips). Similarly, Asian households have the second-largest number of annual trips (3.9 thousand) and a much lower number of trips per person (1.3 thousand). White households, in comparison, average 3.7 thousand trips per household per year and 1.5 thousand trips per person, the highest level of person-based trip-making among all the demographic groups.
| Annual Trips | Vehicles per Household | ||
|---|---|---|---|
| per Household | per Person | ||
| White non-Hispanic | 3,693.9 | 1,525.2 | 1.99 |
| Black non-Hispanic | 3,609.5 | 1,318.9 | 1.38 |
| Asian non-Hispanic | 3,868.6 | 1,342.5 | 1.74 |
| Other non-Hispanic | 3,506.2 | 1,461.4 | 1.90 |
| Hispanic | 4,979.5 | 1,327.9 | 1.69 |
In the United States, it is difficult to discuss race and ethnicity without some discussion on immigration. The NHTS includes information on place of birth and year of entry to the United States. Immigrants, especially new immigrants, travel in significantly different ways than U.S.-born residents; however, that behavior follows a continuum from new entry to full assimilation. After 10 years living in the United States, immigrants travel much like U.S. born residents.
As shown in Exhibit 1-3, new immigrants (in the United States less than 10 years) differ significantly in key demographic indicators of travel. Compared with the national average, the percentage of immigrants who drive is smaller; on average, immigrants work closer to home, live in larger households, make a greater number of household trips per day, and are less likely to own vehicles.
Immigrants have a disproportionate impact on work travel, as over 80 percent of immigrants arriving in the 5 years prior to the 2000 Census were in their main working years of 16–64. In fact, new immigrants constituted all the growth in the number of workers between the ages of 16–54 during the same period. New immigrants are much more likely to carpool, walk, bike, or use public transit for their commute to work; as they represent a growing proportion of the workforce, their commuting patterns will tend to affect the overall national trends.
| Functional System | New Immigrants | National Average |
|---|---|---|
| Demographic Characteristics | ||
| Average Household Size | 3.6 | 2.6 |
| Average Workers per Household | 2.0 | 1.4 |
| Average Vehicles per Household | 1.3 | 1.7 |
| Home Ownership | 16.1% | 72.3% |
| Travel Characteristics | ||
| Percent Drivers (16+) | 60.6% | 91.5% |
| Usual Distance to Work (miles) | 9.5 | 13.2 |
| Usual Time to Work (minutes) | 24.6 | 25.5 |
| Average Daily Trips per Household | 10.2 | 9.6 |
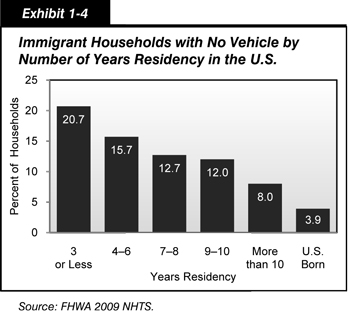
NHTS data show that when looking at all trips, new immigrants are seven times as likely to use transit and are twice as likely to walk as the U.S. born population. Nineteen percent of new immigrants do not have a household vehicle as compared with 13 percent of immigrants in the United States for 11 or more years. The average percentage of U.S. born households without a vehicle is just under 8 percent. Exhibit 1-4 shows vehicle acquisition for immigrant household by year in the United States.
As immigrants assimilate into the United States, the share of trips they make by vehicle tends to increase. Asian immigrants make a faster transition to automobile use, while Hispanic immigrants remain more likely to use transit than the U.S. born population even after 20 years in the United States. New immigrants on average are more transit dependent, having lower levels of vehicle ownership; they also tend to carpool more.
Overall Trends in Demand
Accompanying these contextual transformations are more subtle changes to some basic travel demand indicators, such as the growth in the driving-age population, vehicle saturation, changes in household structure, and a more flexible workforce. Understanding these changes will put the trends in travel demand into a context that will help develop "evidence-based" policies and initiatives.
The United States experienced a long period of growing travel demand in the last half of the Twentieth Century. This growth was a product of demographic shifts and economic bounty fueled partially by baby boomers entering the workforce, acquiring vehicles, and starting their own families, and a dramatic rise in service sector substitutes for traditional "at-home" activities such as child care and meal preparation.
Over the four decades the NHTS has been collecting data, growth in travel demand, and especially vehicle travel, has been correlated with the following:
- Growth in the population of drivers and workers
- Increased vehicle availability
- Increased vehicle miles per driver
- More recently, shifts in household composition toward smaller and more single-family households.
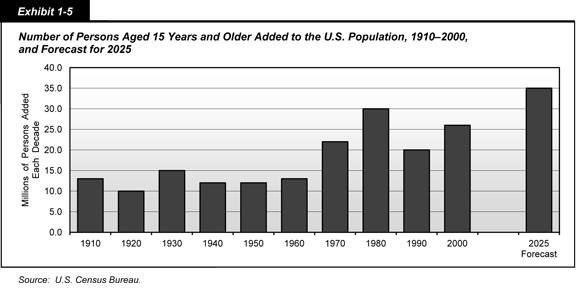
The growth in drivers and workers has been dramatic. Exhibit 1-5 shows the number of added persons 15 years and older between 1910 and 2000 and forecast for 2025. For example, in the decade from 1970 to 1980, labeled "1980" in Exhibit 1-5, 30 million people over 15 were added to the U.S. population, joining the 22 million added between 1960 and 1970. The decade between 1970 and 1980 added 30 million more, and the "echo boom" between 1990 and 2000 added another 25 million.
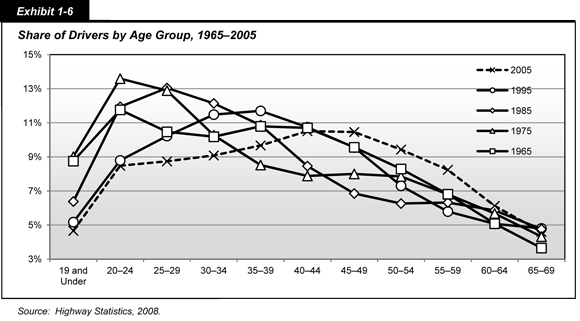
The added workers and drivers resulted in tremendous growth in VMT. But now, as the population ages, the driving pool is also aging. Exhibit 1-6 shows the percentage share of the driving population, in 10-year increments from 1965 to 2005. The baby-boomer "bulge" is clearly visible in the graph, moving rightward as this group ages over the years. The number of drivers 19 and younger peaked in 1975, when teen drivers were 11.7 million and 9 percent of driver population. In 2005, teen drivers numbered 9.3 million, but because the driving population had doubled from 100 million to 200 million, the teen share of the population declined to 4.6 percent.
The growth in the adult population is accompanied by a decline in the number of households with children, and a striking decline in household size. In 1960, 61 percent of the households had a father working outside the home, a homemaker mother, and three children. Today, less than one-third of U.S. households are composed of nuclear families, the lowest proportion in history. Instead:
- 28 percent are married couples with no children
- 26 percent are people living alone
- 13 percent are other structures, including roommates and unmarried partners.
The growth in vehicle availability is also dramatic. In 1969, about 70 percent of licensed drivers had access to a vehicle. In 2009, there are a sufficient number of vehicles for every licensed driver, plus some. More than 60 percent of households own two or more vehicles, and 25 percent own three or more. Overall, one-third of households have more vehicles than drivers. The correlated increases in travel demand indicators are shown in Exhibit 1-7.
| Total Number of Drivers | 1969 100 million |
2009 200 million |
|---|---|---|
| Parameter | ||
| Average Vehicles per Licensed Driver | 0.7 | 1.1 |
| Average Vehicle Trips per Driver | 2.3 | 3.3 |
| Average Daily Person Miles per Household | 61.6 | 95.5 |
| Average Daily Vehicle Miles per Household | 34.0 | 58.1 |
| Average Household Size | 3.2 | 2.6 |
| Percent Single-Person Households | 13% | 27% |
All the more striking given the declines in household size is the change in per-household daily travel—more than 70 percent growth from 1969 to 2009. In 1969, there were 3.2 persons per household, compared with 2.6 in 2009. The share of single-person households has increased from 13 percent in 1969 to 27 percent in 2009.
Trip-Making and Mode-Sharing Trends
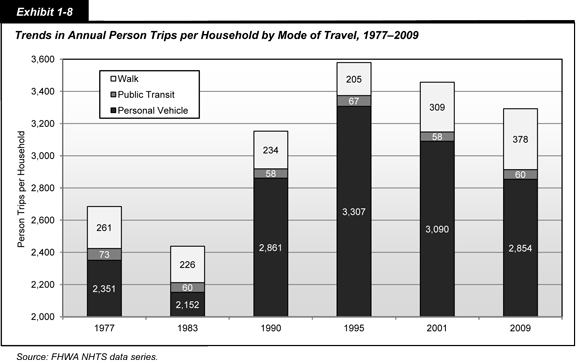
Since 1969 when the first NHTS was conducted, 45 million households have been added in the Nation, and the number of trips by each household has also grown. Exhibit 1-8 shows the historic trend in the number of annual person trips per household by mode of travel, 1977 to 2009 (1969 did not collect walk trips). The average U.S. household currently produces 9.5 trips a day, by all modes, about 82 percent of which are vehicle trips. The remaining trips include other modes of travel such as transit, bicycling, and walking.
| How is a "trip" defined? | |
|
A "trip" is defined as travel directly between two anchor destinations, such as a trip from home to work. Trips can also involve a stop on the way to another destination, at which point the trip is defined as a "trip chain." An operational definition of trip chain is a sequence of trips bounded by stops of 30 minutes or less. If a stop lasts longer than 31 minutes, it becomes the terminus of the trip. Trip chains can include multiple stops such as dropping children at school and stopping for coffee, gasoline, or other errands before continuing to work or home.
|
|
The mobility offered by vehicle travel has increased the range of goods and services available within easy travel distance, but has created a number of concerns, including growing carbon emissions and oil dependency. The personal vehicle is such a ubiquitous travel mode in the United States that when people have to cease driving, because of age, for instance, it can dramatically limit their mobility options.
Increasing longevity means that more and more people age past their safe driving years. For older people who no longer drive, travel to the store, to the doctor's office, or to visit friends and family is often difficult. Suburbanization coupled with the tendency of most seniors to age in their family homes means that many older non-drivers do not have access to alternative means of transportation.
According to the 2009 NHTS, about half of non-drivers aged 65 and older do not travel at all, by any means, on an average day. There are various reasons for this lack of travel, some by choice and some from disability. About half of aging non-drivers indicate that they would like to get out more. Providing mobility options to a rising number of older non-drivers will be a planning challenge as both life expectancy and the number of older Americans grow.
How People Use the Transportation System
The United States has a vast transportation system; the extent of the Nation's highway and transit networks are discussed in detail in Chapter 2. Trips on the Interstate Highway System are almost three times longer than other trips—nearly 28 miles on average compared with just 10 miles for other vehicle trips.
| Can we walk to get there? | |
|
Walking continues to be the second most common form of travel in the United States after vehicle travel. The percent of walk-only trips grew from 7 percent of all trips in 1990 to 11 percent in 2009. To obtain better information about walking, the NHTS asks about the number of walk trips "Last Week." About one-third of people in the United States report no walk trips at all in the previous week. This concerns planners and policy makers because walking contributes to health, reduces emissions, and adds to the quality of life in a community.
In addition, NHTS tracks all trips by all modes and finds that most walking trips are short trips for exercise and dog walking. As shown in Exhibit 1-9, more than 60 percent of trips less than ½ mile in distance are made by walking. People walk for a range of other reasons, such as shopping, escorting children to school, and walking to work. The greatest barrier to walking more is the perception of too much traffic, not enough street lighting, or wide road crossings. People are also concerned about crime, had no nearby paths or sidewalks, and were too busy to walk more often.
|
|
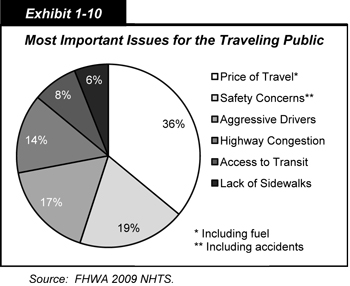
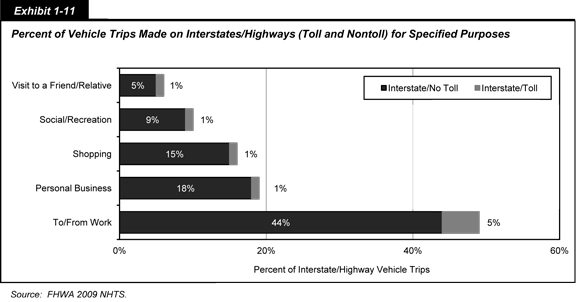
Exhibit 1-10 shows the issues ranked as the most important to Americans in the 2009 NHTS. Exhibit 1-11 shows the unsurprising finding that 44 percent of vehicle trips on the Interstate/highway are commutes, while the remainder are shopping, personal business, and recreational trips. Currently, a toll is paid for about 6 percent of their trips, most often for work, but also for other purposes.
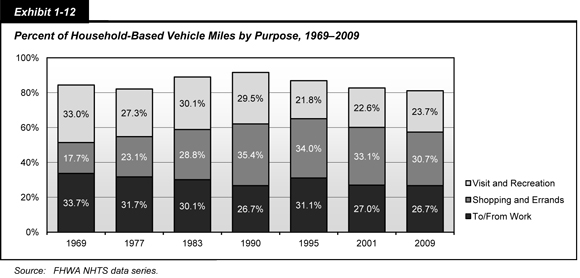
Congestion used to be associated with peak travel hours and work trips, but now congestion affects travel for non-work purposes, such as shopping, medical visits, and recreation. Although the total amount of household-based vehicle travel has increased dramatically, the proportion of travel to work has remained relatively constant; Exhibit 1-12 shows that travel to work accounted for 27 percent of household-based vehicle travel in 2009, compared with 34 percent in 1969. In 1969, commuting and recreational travel accounted for two-thirds of all vehicle miles. During the 1980s and 1990s, more and more vehicle miles were devoted to shopping and family errands; in the early 2000s, errands started to decline while vehicle miles for recreation increased slightly. Importantly, these non-work vehicle trips have widely different destinations, times of day, vehicle occupancies, and other characteristics that make planning and policies targeting non-work travel more complex.
Work Travel
Travel to work has historically defined peak hour travel demand and, in turn, influenced the design of the transportation infrastructure. Work trips are critical to transit planning and help determine the corridors served and the levels of transit service available. The average automobile commuter spends 22.8 minutes commuting a one-way distance of 12.6 miles. Other modes of travel and variations in travel times, distances, and speeds by commute mode are shown in Exhibit 1-13.
| Travel Mode | Time, minutes | Distance, miles | Estimated Speed, mph |
|---|---|---|---|
| Walk | 14.2 | 1.1 | 4.8 |
| Privately Owned Vehicle | 22.8 | 12.6 | 33.2 |
| Bus | 48.9 | 9.4 | 11.5 |
| Commuter Rail | 51.7 | 12.2 | 14.1 |
Data on work travel reveal two trends: more flexible hours in the workplace, including an increase in telecommuting; and workers' commutes becoming more complex, including stops for incidental purposes and the linking of work and non-work activities.
The 2009 NHTS data series shows that many workers have flexibility in work arrival times—more than 36 percent of full-time workers can "set or change their own start work time." In addition, the data series shows that nearly 12 million Americans work at home, and within urban areas the number has doubled since 1995.
Another trend in the workplace is the growing number of older workers. The 2009 NHTS shows a sharp rise in the number of people over the age of 65 who continue to work. Some of the people in "Working Retirement" may have more flexible schedules and are more likely to work at home and work part-time. Whether because of increased longevity, need for social interaction, interest in continued mental challenges, or economic reasons, more workers may decide to continue working in their 60s and 70s.
The growing flexibility of work, coupled with the power of communications technology, has potential effects on miles of travel, congestion, and travel time-of-day, characteristics that are still being studied. In addition, the typical commute is becoming more complex—for instance, trip chaining is increasing and encompassing a broader range of activities. Trip chaining has become a rational response to the burden of time and duties, such as household-sustaining activities involving child care, home care, parent care, and vehicle care. Commuters stop for a variety of reasons, such as to drop children at school or to stop at the grocery store on the way home from work. Real-life examples show that the time, location, and frequency of these other trips can be dictated by the work trip as people respond to the pressures of work and home. However, the NHTS also shows that some of the growth in trip chaining has been to grab a coffee or meal, traditional in-home activities that previously would not have involved travel.
Non-Work Travel
Over the last four decades, the greatest growth in travel has been travel not related to work. The growth in travel for shopping, family errands, and social and recreational purposes reflects the busy lives of the traveling public. In many instances the timing of these non-work trips conflicts with commute trips, such as weekend recreational trips that start Friday afternoon. Peak congestion around attractions and leisure spots can be worse than congestion in the city center at rush hour.
|
Shopping On-Line More and more households are choosing to shop on-line. The FHWA 2009 NHTS indicates that one-third of adults made Internet purchases in the last month, and these purchases resulted in nearly four (3.7) deliveries a month to the average household. That equals just about 500 million deliveries of goods purchased on-line each month to U.S. households. Distributing e-commerce goods to households is poised to create a huge new demand on the transportation system, additionally taxing the existing infrastructure to handle the capacity and speed demands of a virtual marketplace. Until recently, the fastest-growing sectors of on-line sales and services were those that do not require delivery of a product (financial services, music, games, and software) or small packaged goods that are delivered via existing third-party vehicles (books, computers, and drugs). Future growth may come from consumer demand for more everyday needs—groceries, for instance—or specialty items that require a new method of delivery and possibly are more infrastructure-dependent, such as large-scale deliveries in common carrier trucks. American consumers demand flexibility of delivery options for on-line purchases in terms of timed slots and specified delivery days, as well as overall improvement in reliability and reduction in cost. The ability of the local and national transportation systems to accommodate demands of retailers and consumers for fast, flexible, on-time delivery of goods to households, and the potential growth in light-duty truck volumes that may accompany greater home delivery, will become an important policy and planning question in the future. |
Since non-work travel has a different time-of-day profile than commuting, the growth of non-work travel affects the shoulders of the peak and midday the most, but weekend travel is also growing fast. This is changing the historical idea of the design peak—the highest volume of traffic that determines the roadway specifications—which, for some communities, occurs on Saturday afternoon rather than during weekday commuting.
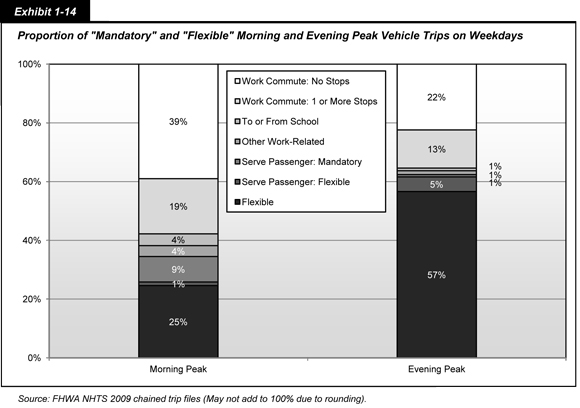
In looking only at weekday vehicle travel, about half of all travel in the combined morning and evening peak periods is not related to work—but that does not imply that all non-work travel is completely discretionary. Some non-work trips may be constrained by the individual's schedule or, in the case of medical trips, the doctor's schedule. Trips to drop someone or pick someone up may be constrained by auto availability and the schedule and purpose of the passenger. The nature of these trips, whether "flexible" or "mandatory," is subjective and based on the traveler's perception, but these two simple categories—mandatory and flexible—can be helpful for discussion.
As shown in Exhibit 1-14, the weekday morning peak and the weekday evening peak have very different characteristics in terms of the purpose of vehicle travel. The morning peak, between 6 and 9 a.m., is dominated by mandatory travel to work, school, and taking passengers to work and school. In contrast the evening peak, between 4 and 7 p.m., is composed of more flexible travel, such as shopping, getting a meal, and social activities. Peak travel is usually considered workday commute times; much of the morning peak travel occurs between 6 and 9 a.m. In the morning peak, mandatory travel accounts for three-quarters of all vehicle trips. Within mandatory travel, 39 percent of all vehicle trips are direct trips to or from work, 19 percent are commutes with at least one stop, 4 percent are students driving to school, and 4 percent are other trips related to work. Driving a passenger to work or school adds another 9 percent. In the evening peak, mandatory travel falls to 38 percent while flexible rises to 62 percent, including the 5 percent of drivers serving a passenger in trips not related to work or school.
These data use the trip chain file, which combines work travel into tours that can include intermediary stops for any purpose, such as getting coffee. Understanding peak period travel is vital for potential finance initiatives and congestion mitigation and air quality policies, among other important policy and planning programs.
Household Vehicle Use and Greenhouse Gas Impacts
With concerns about the negative impact of continued growth in vehicle travel on the environment, three measures in addition to those mentioned earlier (growth in the population over 16 years old, increased vehicle availability, and growth in vehicle miles per driver) help to track the potential for increased fuel use associated with increased vehicle miles:
- Household fleet use (miles/vehicle)
- Household fleet mix (cars/trucks/sports utility vehicles (SUVs)/hybrids)
- Gas costs.
Even as the total vehicle fleet has grown by two and a half times, from 72.5 million in 1969 to well over 200 million in 2009, the value of annual miles per vehicle has remained constant: an average of 10,242 miles per vehicle in 1969 compared with 10,547 in 2009.
However, the household fleet mix has changed dramatically. The household fleet consists of passenger vehicles (cars and station wagons, vans, SUVs, and pickups) available for use in daily travel and does not normally include rental cars, company or government fleets, or taxi and delivery vehicles. Trends in the household fleet composition and use are vital to assess the impact of policies such as the "Cash for Clunkers" and the new CAFE (Corporate Average Fuel Economy) standards. Safety researchers are also keen to measure motorcycle vehicle miles traveled, as the number of motorcycle fatalities has increased in recent years. For instance, SUVs were introduced in the early 1990s and continue to be very popular. In 1995, SUVs were 6.9 percent of the fleet (this was the first year SUVs were identified in the survey); by 2009, they had grown to 19.4 percent of the fleet (Exhibit 1-15). On the other side of the spectrum, hybrids and smaller passenger cars rose in popularity during the gas-price spike of 2008. The most recent NHTS shows that passenger cars are a larger share of newer vehicles (0–2 years old), perhaps showing a growing demand for more fuel-efficient vehicles.
| Vehicle Type | Travel Survey Year | |||||
|---|---|---|---|---|---|---|
| 1977 | 1983 | 1990 | 1995 | 2001 | 2009 | |
| Automobile | 79.6% | 75.9% | 74.7% | 64.3% | 56.8% | 49.9% |
| Van | 2.8% | 3.6% | 5.5% | 7.8% | 9.0% | 8.2% |
| SUV | 6.9% | 12.1% | 19.4% | |||
| Pickup Truck | 12.8% | 15.2% | 17.2% | 17.7% | 18.4% | 17.8% |
| Motorcycle | 2.7% | 2.5% | 1.3% | 0.9% | 2.1% | 3.3% |
Overall, the passenger fleet continues to age as vehicles can be reliably driven well past 100,000 miles. In 1969, the average vehicle was just 5.6 years old, compared with 2009 where the average was 9.4 years. The aging fleet presents consequences, as older vehicles are generally less fuel efficient and contribute disproportionately to greenhouse gas emissions. Aging fleets also contribute to the longer lead time for introducing new technology and safety equipment. For any individual household, the GHG emissions of daily travel are based on the types of vehicles that are available for use in a household, the number of miles each vehicle is driven, the fuel efficiency in each vehicle, and usual driving patterns for each vehicle. Because the 2009 NHTS shows more aging SUVs, vans, and pickups, the proportion of CO2 emissions from older vehicles can be expected to grow even as more efficient, newer vehicles are added to the fleet.
According to the NHTS, rural families drive more miles than suburban and urban households, with an average annual VMT of 28,345—well above the average of 22,418 for all households. Although a much smaller percentage of the population lives in rural locations, these families typically need to drive farther to get to places.
Also, rural families own twice as many vehicles compared to households in high density areas—and these rural vehicles are likely to be less-efficient vehicles like pickup trucks. In fact, a rural family is twice as likely to own a pickup truck (28 percent of the rural fleet mix) compared to urban households (14 percent of the fleet mix). The lower fuel efficiency of pickups combined with higher average miles of driving translates into a greater "carbon footprint" for daily travel produced from rural households.
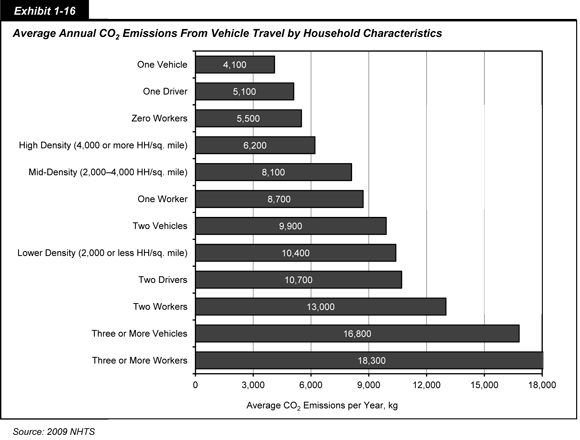
Based on an analysis of NHTS and Highway Statistics 2008, VM-1 data, the average household in the lower density areas (0–2,000 housing units per square mile) produces almost two-thirds more CO2 from daily vehicle travel than does the average household in the high density areas (urban areas of 4,000 or more housing units per square mile). However, many other factors, including socio-economic and land-use characteristics, affect the amount of CO2 emissions by households. Exhibit 1-16 shows a ranking of households by some factors that affect the miles driven, or are correlated to the number and type of vehicles owned, and therefore significantly affect CO2 emissions from travel. These categories are not mutually exclusive, for example, a single household can have "three or more vehicles" and also have "two workers." In general, households with more workers and more vehicles travel more miles, emitting more CO2 than households with fewer vehicles and fewer workers. Chapter 11 includes a more extended discussion of GHGs in the context of sustainability.
To view PDF files, you need the Acrobat® Reader®.