

2.0 LITERATURE AND PRACTICE REVIEW
Prior to the model development, a comprehensive literature and practice review was conducted to assess current knowledge on long distance multimode passenger travel modeling. This section discusses that review and is organized as follows: Section 2.1 sets the stage for the literature and practice review by providing some background material. This is followed in Section 2.2 by the review methodology, including research criteria and sources used in the search. Findings from the literature and practice reviews are included in Sections 2.3 and 2.4, respectively. Finally, a discussion of the results in terms of how they influence the model development is provided in Section 2.5.
2.1 Background
The research team believes that a crucial first step in developing and implementing a rigorous set of quantitative methods to analyze how long-distance passenger travelers make their modal choices is finding a complete, detailed, and accurate data source or sources that can be used as inputs to the mathematical models. At a minimum, the data source(s) should:
- Contain the passenger-selected mode of travel (i.e. air, rail, bus, private passenger vehicle) for long distance trips;
- Contain detailed information on the long-distance travel trips and traveler (e.g. social, economic, and demographic characteristics of traveler, availability of passenger vehicle, trip length, trip purpose, available infrastructure facilities such as rail, airport and highways);
- Be nationally representative of long distance travel in the U.S.; and
- Be available from public domain sources without the requirement of programs or purchases from private commercial vendors.
Prior to the literature search, the research team proposed that data from the 2001 NHTS be the primary data source for this modeling effort. It meets the four criteria above. The 2001 NHTS is a national survey of daily and long-distance travel. The survey includes demographic characteristics of households, people, vehicles, and detailed information on long-distance travel for all purposes by all modes. NHTS survey data are collected from a sample of U.S. households and expanded to provide national estimates of trips and miles by travel mode, trip purpose, and a host of household attributes. According to the Bureau of Transportation Statistics (BTS), the NHTS provides the only authoritative source of information at the national level on the relationships between the characteristics of personal travel and the demographics of the traveler.
Overall, literature and practices that explore the following topics were reviewed:
- Research performed on mathematical techniques for long distance passenger travel modal choice modeling;
- Data sources used for long distance passenger travel modeling that could supplement the NHTS data;
- Applied practices used by organizations such as tourism/travel bureaus and economic development agencies; and
- Factors that were found to influence long-distance passenger travel mode choice.
Although the NHTS contains a large amount of data needed to model long distance passenger travel modal choices, the research team recognizes that the dataset is ten years old and may need to be updated and that other data sources could supplement the data from the NHTS because they contain additional, value added attributes related to long distance travel. Thus, the identification of such data sources was a primary objective of this review process. Efforts were made to quantify the strengths of the data sources (i.e. they have information that would provide an added value to the modeling, they can be linked to NHTS data, and they are publically available). Only data sources that meet these criteria would be considered as inputs to the modeling. One example is the Metropolitan Travel Survey Archive located at the University of Minnesota and funded by FHWA and BTS. This is an archive to store, preserve, and make publicly available, via the internet, over 80 travel surveys conducted from almost 45 metropolitan areas, states and localities. Another example is the American Travel Survey (ATS) conducted by BTS in 1995 which collected information from approximately 80,000 households about their long-distance travel through 1995.
The review of current knowledge by researchers or the applied practices of travel-related organizations was used to identify best-practices. Specifically, it helped identify the list of factors that have been found to be significantly related to long-distance travel mode choice. Although the main focus of this research is to develop mathematical models for domestic long-distance passenger travel, the review of current knowledge and best practices focuses both on domestic and international research into long-distance passenger travel. International research was included to increase the number of research studies reviewed mainly because the number of long-distance travel data sources and research domestically is limited but also because it was hypothesized that international research would provide additional insights into long-distance multimodal passenger travel modal choice modeling that could be used in developing models in this research.
2.2 Methodology
In order to identify as many publicly available documents as possible for consideration in the assessment of current knowledge on long distance multimodal passenger travel modeling, the research team sought out documents from various sources. The types of documents included international, regional, and national-level reports, workshop and conference proceedings, summaries and presentations, peer-reviewed journal articles, and other published documents. The research team used the following key methods in the document identification process:
- Searched the bibliographic database TRID. TRID is a newly integrated database that combines the records from the Transportation Research Board's Transportation Research Information Services (TRIS) Database and the Organization for Economic Co-operation and Development’s (OECD) Joint Transport Research Centre’s International Transport Research Documentation (ITRD) Database. TRID provides access to over 900,000 records of transportation research worldwide.
- Searched the websites of universities known to be active in transportation research (e.g., Virginia Tech, University of Florida, and University of California).
- Performed web-based literature searches using standard search tools and databases. Key words used to perform searches included variations on phrases such as “long distance passenger mode choice modeling“, and “passenger stated preference”.
- Referred to the references listed in the documents identified through other methods to provide potential new sources of information.
As part of the practice review, the research team reached out to several tourism/travel bureaus and economic agencies via telephone and email to learn about applied practices involving long-distance multimodal passenger travel mode choice modeling used by such organizations. Phone interviews were conducted once the appropriate contact at the organization was reached. Organizations that responded via email received a follow-up phone call and were interviewed.
2.3 Literature Review Findings
Findings from the literature review are organized around the following three main areas that correspond to the objectives of the literature review:
- Research performed on mathematical techniques for long distance passenger travel modal choice modeling;
- Data sources used for long distance passenger travel modeling; and
- Factors that were found to influence long-distance passenger travel mode choice.
2.3.1 Mathematical Techniques for Long-distance Passenger Travel Modeling
The literature review showed that analyses of long-distance multimodal passenger travel mode choice range in complexity from simple summary statistics and cross tabulations to more sophisticated mathematical modeling techniques such as nested multinomial logistic regression. One common theme in most of the research is that analysis on mode choice is performed separately by trip purpose. This section discusses both domestic and international research conducted starting with the more simple analyses and continuing through more sophisticated modeling applications.
2.3.1.1 Analyses Based on Cross Tabulation and Descriptive Statistics
There has been numerous research projects conducted on U.S.-based long-distance travel using the 2001 NHTS and the 1995 ATS. Several reports published by the BTS provide interesting facts and figures as well as highlight main findings from the NHTS and ATS. Examples of these documents include:
- America on the Go … Findings from the National Household Travel Survey (BTS, 2006)
- A Picture of Long-Distance Travel Behavior of Americans Through Analysis of the 2001 National Household Travel Survey (Sharp et al., 2006)
- NHTS 2001 Highlights Report (BTS, 2003).
These publications focus mainly on frequencies based on long-distance travel such as:
- Long-distance trips by mode
- Longs distance trips by trip purpose
- Destinations of long-distance trips (e.g., within same state, out of state, international)
In addition, cross-tabulations are provided of travel mode by various factors such as:
- Trip purpose
- Trip distance
- Geography (urban vs. rural area)
- Traveler demographics
- Access and egress modes
- Gender
- Household income.
Among the key findings from these cross tabulations include:
- Long-distance trips originating in urban and metropolitan areas are more likely to use public/commercial transportation modes than trips originating in rural and non-metro areas.
- About eight percent of long-distance trips that use a public/commercial transportation mode use a different mode in each direction of travel.
- Almost 90 percent of long-distance trips are by personal vehicle.
- Mode choice varies somewhat by trip purpose and distance.
- Personal vehicle is the most frequent mode used to initially access long distance public/commercial transportation, but on the arrival end a greater mix of modes is used. (BTS, 2006)
Other research on the 2001 NHTS and 1995 ATS based on cross tabulations and other non-modeling techniques has been targeted to a specific area or hypothesis within long-distance travel. Bricka (1999) examined regional variations in long-distance travel in the U.S. by comparing geographically diverse regions (New York, Massachusetts, and Oklahoma). Using national- and state-level data, comparisons of long-distance trips were performed to identify differences in trip length, purpose, mode, and demographic characteristics of the travelers. Mallett (1999a) studied the long-distance travel behavior of low-income households in comparison with higher income households using the ATS. Also, Georggi and Pandyala (1999) provided a detailed analysis of long-distance travel behavior for two key socioeconomic groups of the population – the elderly and low income. Mallett (1999b) researched long-distance travel behavior by women, presenting data on women’s long-distance travel broken out by trip purpose, trip mode, age, race/ethnicity, and household type.
2.3.1.2 Model-Based Analyses
Discrete choice models are statistical procedures that model choices made by people among a finite set of alternatives. Specifically, discrete choice models statistically relate the choice made by each person to the attributes of the person and the attributes of the alternatives available to the person. In terms of long-distance travel, discrete mode choice models consider the travel mode that travelers choose for a particular long-distance trip based on certain attributes about the traveler or the trip to be taken. Although discrete choice models can take many forms, the majority of the mode choice models encountered in the literature review are logit based. The mathematical framework of logit models in based on the theory of utility maximization which is discussed in detail in Ben-Akiva and Lerman (1985). Utility theory assumes that travelers prefer an alternative with the highest utility where utility is a representation of the attractiveness of the mode choice alternatives as derived from the traveler. Logistic regression models are used to predict the probabilities of the different possible outcomes of a categorical dependent variable (mode choices), given a set of independent variables (socioeconomic characteristics, trip purpose, trip length, etc).
2.3.1.2.1 Binary Logit Models
The most basic logistic regression models are binary logit models where the dependent or response variable is dichotomous in nature (e.g., airplane vs. rail). The literature review identified three studies where binary logit modeling was employed to analyze travel mode choice behavior.
- The Delaware Transportation Institute and the State of Delaware Department of Transportation examined factors that affect or can alter mode choice by analyzing transit trips in New Castle County, DE. (Racca and Ratledge, 2003) The study used data from a Delaware DOT Household Survey conducted annually from 1995 through 2001. Binary logit models were fitted to three trip purposes separately (transit trips, passenger trips, and walking trips) using factors such as mode travel time and costs, socioeconomic variables, access to alternative modes, vehicle availability, and time of day of transit service. Since driving trips were not studied in this case, the focus was more on short-distance trips.
- Using the 1998 Netherlands National Travel Survey, Limtanakool et al (2006) fit a series of binary logit models survey data to address the question of how socioeconomic factors, land use attributes, and travel time affect mode choice (train vs. private car) for long distance travel and how their role varies across trip purpose. Separate models were fit to commuting trips, business trips, and leisure trips. The authors state that their study was one of the first to incorporate land use attributes such as population density, proximity to infrastructure, and land use diversity. Specifically, they considered the associations between mode choice and land use attributes at the origin and destination sides while controlling for the influence of socioeconomic characteristics of persons, households, and travel times.
- In Japan, Kitagawa et al (2005) fit a series of binary logit models to estimate the mode share (air vs. high speed rail) between the cities of Keihanshin and Fukuoka. Analysis was performed based on data from a web survey in 2004. Factors of interest were based on cost and waiting time (e.g., fare cost, travel time, egress time, egress expense, access time, access expense, and time outside vehicle).
2.3.1.2.2 Multinomial Logit Models
Several researchers have employed a multinomial logit model to predict modal choice for long distance travelers. A multinomial logit model is a regression model which generalizes binary logistic regression by allowing more than two discrete outcomes. This type of model is more useful when dealing with long-distance travel because of the multiple modes available from origin to destination. Figure 2-1 presents an example of a simple multinomial logit model specification.
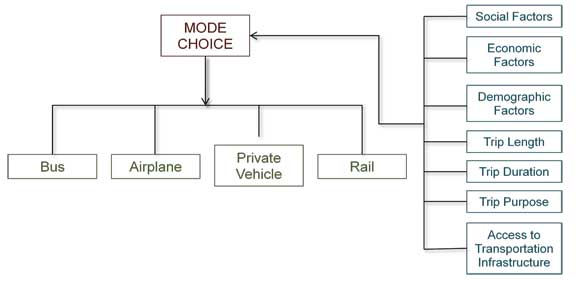
Figure 2-1. Visualization of Simple Multinomial Logit Model.
One assumption of the multinomial logit model is that the model error terms are independent and identically distributed. As a result, when the multinomial logit model is used to model choices, it relies on the assumption of independence of irrelevant alternatives (IIA) which is not always desirable. Ben-Akiva and Lerman (1985) give the definition as “the ratio of the chosen probabilities of any two alternatives is entirely unaffected by the systematic utilities of any other alternatives.” They continue on to show that IIA can produce wrong estimates when a new mode with similar characteristics is introduced into the mode choice set. As such, nested logit models are sometimes used as an extension of the multinomial logit model to capture the correlation of alternatives when alternatives are not independent. Nested logit models relax the independence assumption by grouping similar alternatives into nests.
Presented below are summaries and/or the published abstracts from national followed by international research studies conducted where multinomial or nested multinomial logit models were employed for long-distance passenger travel mode choice.
- Using data from the 2001 NHTS, Rasmidatta (2006) fits both binary and nested multinomial logit models to study the behavior of long-distance travelers in the U.S. Separate models are fit to each of three different trip purposes: business, personal business, and pleasure. Models were fit using data from the NHTS national sample and then validated with samples from Texas and Wisconsin. Data from external sources were not used. Factors used in the analysis included socioeconomic variables, availability of a car to the traveler, and various trip aspects (length, number of nights away). Rasmidatta also used Neural Networks to study the long distance travel behavior. The author found that the advantages to using Neural Networks are that there are no assumptions for the data and parameters (i.e. they can handle multicollinearity and lack of correlation). A Neural Network is an iterative non-linear model that can solve problems like people naturally solve problems. Rasmidatta found that both the nested logit models and Neural Networks generated strong results with the Neural Networks having slightly better prediction.
- Ashiabor et al (2007) developed nested and mixed logit models to study national level intercity transportation in the United States. The models are used to estimate the market share of automobile and commercial air transportation between 3091 counties and 443 commercial service airports in the United States. Models were calibrated using the 1995 American Travel Survey and separate models were developed for business and non-business trip purposes. Factors explored in the models are travel time, travel cost, and traveler’s household income. Given an input county-to-county trip demand table, the models were used to estimate county-to-county travel demand by automobile and commercial airline between all counties and commercial service airports in the United States. The model has been integrated into a computer software framework called the Transportation Systems Analysis Model (TSAM) that estimates nationwide intercity travel demand in the United States.
- Prior to their research, Ashiabor et al (2007) indicate that four major attempts were made between 1976 and 1990 to develop disaggregate national-level intercity mode choice models in the U.S. All of these attempts made use of national travel studies conducted by the Bureau of the Census and BTS. These four attempts along with the model developed by Ashiabor et al is presented in Table 2-1 (Table 2-1 is extracted from Table 1 of Ashiabor et al. report).
- The first major attempt was made by Stopher and Prashker (1976) which used the 1972 National Travel Survey (NTS). This was followed by Grayson (1982) utilizing the 1977 NTS. Morrison and Winston (1985) and Koppelman (1990) fit nested logit models using data from the 1977 NTS. Finally, Ashiabor et al fit nested logit and mixed logit models to the 1995 ATS as part of the mode choice model in their transportation system analysis model. Each of the authors created separate models for business and non-business trips and included modes of transportation that included automobile, air, train, and bus.
- Using data from a Swedish national travel study conducted in 1984-1985, Algers (1993) developed a system of models consisting of nested logit models partly estimated by the use of simultaneous estimation techniques. There are different models for business and private trip purposes. The models studied traveler socio-economic characteristics, travel cost, travel time (including access and egress time), and some elements of land use attributes at the destination.
- In Australia, Khan et al (2007) develops a mode choice module capability that could be incorporated into the Brisbane Strategic Transport Model. The module consists of a series of multinomial logit models for eight trip purpose categories (home based work – white collar, home based work – blue collar, home based education – primary and secondary, home based education – tertiary, home based shopping, home based other, work based work, and other non-home based trips). Data came from the Southeast Queensland Travel Survey. Factors incorporated into the models including demographic characteristics (number of adults and number of vehicles in household), land use characteristics (employment density), and travel characteristics (travel cost and travel time related to transit, access/egress, and waiting). Models developed for this study were mainly reflective of local travel as opposed to long-distance travel but were included here to provide another example of modeling techniques used in mode choice research.
- Rand (Burge et al., 2011) conducted a stated preference study in Great Britain to study long distance passenger travel defined as one-way trips over 50 miles. Using data from this survey, nested multinomial logit models were created to predict mode choice (rail, high speed rail, air, car) based on a series of factors that included socio-economic characteristics, values of time, cost sensitivity, out-of-vehicle components such as frequency, interchanges, and access and egress time, rail service components such as rail reliability and crowding, and whether there existed an additional preference for high speed rail over classic rail.
| Author | Model Type | Data and Scope | Modes of Transportation | Variables in Utility Function | Market Segmentation |
|---|---|---|---|---|---|
| Stopher and Prashker (1976) | Multinomial logit | 1972 NTS | Automobile, commercial air, bus, rail | Relative time, relative distance, relative cost, relative access-egress distance, departure frequency | Trip purpose (business, nonbusiness) |
| Alan Grayson (1982) | Multinomial logit | 1977 NTS | Automobile, commercial air, bus, rail | Travel time, travel cost, access time, departure frequency | Trip purpose (business, nonbusiness) |
| Morrison and Winston (1985) | Nested logit | 1977 NTS | Automobile, commercial air, bus, rail | Travel time, cost, party size, average time between departures | Trip purpose (business, nonbusiness) |
| Koppelman (1990) | Nested logit | 1977 NTS | Automobile, commercial air, bus, rail | Travel time, cost, departure frequency, distance between city pairs, household income | Trip purpose (business, nonbusiness) |
| Ashiabor et al. (2007) | Nested logit and mixed logit models | 1995 ATS | Automobile, commercial air, train, SATS | Travel time, travel cost, household income, region type | Trip purpose (business, nonbusiness) Household Income |
2.3.1.2.3 Other Model-Based Analyses
As discussed in the previous section, the assumption of independently and identically distributed error terms in the multinomial logit model leads to the IIA property. The nesting of travel modes within the multinomial logit model has been used to overcome the IIA property. In addition, researchers have developed other alternatives to the multinomial logit model. Presented below are summaries and/or the published abstracts from research studies conducted that explore alternative models when modeling long-distance travel choice behavior.
- Bhat (1995) developed a new heteroscedastic extreme value model of intercity mode choice that overcomes the “independence of irrelevant alternatives” (IIA) property of the commonly used multinomial logit model. The proposed model allows a more flexible cross-elasticity structure among alternatives than the nested logit model. Using data from a 1989 Rail Passenger Review conducted by VIA Rail to develop travel demand models to estimate shifts in mode choice, Bhat evaluates the multinomial logit, alternative nested logit structures, and the heteroscedastic model in examining the impact of improved rail service on business travel in the Toronto-Montreal corridor. Bhat finds that the heteroscedastic extreme value model is found to be superior to the multinomial logit model in terms of its ability to predict mode choice and to limit overestimation of certain modes as was observed in the multinomial logit model.
- Koppelman and Sethib (2005) observed that the relaxation of the independently and identically distributed error term assumption has been undertaken along a number of isolated dimensions leading to the development of a rich set of discrete choice models, that are more flexible than the multinomial logit model. In some cases, these more general models lose the mathematically convenient closed-form structure of the multinomial logit.
- In their research, Koppelman and Sethib combine the most flexible isolated closed-form extensions of the multinomial and nested logit models in an integrated model structure to yield a behaviorally rich, yet computationally tractable choice model. Specifically, they combine the generalized nested logit model that allows for non-independent errors, the Heteroscedastic multinomial which allows non-constant errors across observations, and the Covariance Heterogeneous nested logit model which allows for non-constant correlation structure across observations. The resulting model, called the heterogeneous generalized nested logit model extends the ability to represent the complex behavioral processes involved in choice decision-making. The value and need for the additional modeling complexity of the heterogeneous generalized nested logit model was tested in the empirical context of mode and rail service class choice behavior for long distance intercity travel. An incremental modeling approach was adopted where the researchers started from the simple multinomial logit model and sequentially relaxed some of its restrictive assumptions to estimate progressively more flexible model structures. The researchers found that the statistical fit and behavioral appeal of the estimated models improved substantially with each additional relaxation of the restrictive model assumptions, strongly supporting the concept of integrating generalizations of multinomial and nested logit models.
- Koppelman and Wen (2000) provide another alternative model to the multinomial logit model. They ran various models on rail data from 1989 between Toronto and Montreal to estimate demand for high speed rail. They also argue that the IIA property of the multinomial logit model inappropriate for many choice situations in which some pairs or sets of alternatives share the same unobserved attributes (because the model imposes a restriction of zero covariance between the utilities of pairs of alternatives). The nested logit model relaxes the zero covariance restriction of the multinomial model but imposes the restriction of equal covariance among all alternatives in a common nest and zero covariance otherwise. The paired combinatorial logit model relaxes these restrictions further by allowing different covariances for each pair of alternatives. This relaxation enables the estimation of differential competitive relationships between each pair of alternatives. The closed form of the paired combinatorial logit model retains the computational advantages of other logit models while the more flexible error correlation structure, compared to the multinomial model and nested logit models, enables better representation of many choice situations. This paper describes the derivation, structure, properties and estimation of the paired combinatorial logit model. The empirical results demonstrate that the paired combinatorial logit model is statistically superior to the multinomial and nested logit models and may lead to importantly different travel forecasts and policy decisions.
The research presented in this section demonstrates a broad range of techniques on a variety of data sources both domestically and internationally. It also highlights some of the important issues in developing a sound, technically correct modeling system. The next section focuses in greater detail on the data sources used in the research.
2.3.2 Data Sources used for Long-distance Multimodal Passenger Travel Modal Choice Modeling
As evidenced in Section 2.3.1, there were many long-distance multimodal passenger travel modal choice studies conducted outside the United States using various data sources. In the Netherlands, modeling was performed on the 1998 Netherlands National Travel Survey, a household survey asking respondents to record all journeys made in a particular day. In Sweden, the Swedish National Travel Study was used to study long-distance travel. In the Swedish survey, respondents are asked to report on their recent trips. Because both the air and rail authorities have had a major role in the survey, long-trip surveying, trips over 100 km is an important facet of the design. In Japan, a web survey of passengers who traveled between Keihanshin and Fukuoka in 2004 was conducted to examine passenger’s mode choice between air and rail. In Canada, the 1989 Rail Passenger Review conducted by VIA Rail (the Canadian national rail carrier) consisting of travel surveys conducted in the corridor to collect data on intercity travel by four modes (car, air, train and bus) were used to model intercity mode choice.
These studies provided a broad understanding of the different data sources available for long-distance travel in terms of size, scope, methods, and data collected. The main focus of this section, however, is data sources used to model long-distance multimodal passenger travel modal choice within the United States. The ultimate goal of this research project is to develop quantitative mathematical methods to analyze how long-distance passenger travelers make their modal choices within the U.S. As such, one objective of this literature review was to identify those data sources used for long distance passenger travel modeling that could supplement the 2001 NHTS data or that could be used instead of the 2001 NHTS in this research effort.
The lack of available U.S.-based data on long distance travel is the main hindrance to long distance travel research. As a result, not many people have conducted research on long distance travel within the U.S. Fortunately for this effort, most of the limited research focuses on long distance travel impact on mode choice (Rasmidatta, 2006). Most research identified in this literature review focused on the U.S. has made use of either the 1995 ATS or the 2001 NHTS which are the most recent sources of long-distance travel data or the past NTS surveys conducted by the U.S. Census Bureau. Ashiabor et al (2007) indicate that four major attempts were made between 1976 and 1990 to develop disaggregate national-level intercity mode choice models in the U.S. All of these attempts plus the research of Ashiabor et al. made use of the 1995 ATS or the previous NTS surveys. These are detailed in Table 2-1 in Section 2.3.1.2.2.
Even though the 1995 ATS and 2001 NHTS are the richest and most used data sources on domestic long-distance travel, there are some drawbacks. First, the surveys do not contain information on level-of-service variables such as travel time and travel cost. Second, geographical information at the origin and destination of trips is aggregated to protect the confidentiality of respondents. Trips in the survey are only identified by state and whether they are in an MSA. As a result, some researchers have developed synthetic travel time and cost data from published fare and schedule guides, such as the official airline, railroad, and bus guides (Ashiabor et al., 2007). However, analysis was restricted to those trips that originated and destinated in metropolitan statistical areas (MSAs) because it was very difficult to estimate travel times and costs for any trip originating or ending in non-MSA areas (Ashiabor et al., 2007). Ashiabor et al. also found that the major constraints in developing credible models are related more to the national survey databases than the modeling techniques. Specifically, the two major issues are the restriction of the minimum level of geographic detail to MSA and the absence of information related to airports and access and egress distance to airports and terminals. National surveys (e.g. versions of the NTS) prior to the 1995 ATS were not reviewed in detail given the time elapsed since they were performed.
This literature review examined the possibility that there existed data sources at smaller levels of aggregation (i.e., state and local level) that contained information on long-distance travel. A few states have conducted household travel surveys where modal choice is investigated but they mainly focus on daily travel and short distance trips. For example, the Delaware Transportation Institute and the State of Delaware Department of Transportation regularly conducted a household telephone survey that examined factors that affect or can alter mode choice. Analysis was conducted on data from 1995-2001 by analyzing transit trips in New Castle County, DE. The survey contained information on mode travel time and costs, socioeconomic variables, access to alternative modes, vehicle availability, and time of day of transit service. Since driving trips were not studied in this case, the analysis focus was more on short-distance trips and compared walking, transit, and bus modes.
Another domestic data source investigated was the Metropolitan Travel Survey Archive located at the University of Minnesota and funded by FHWA and BTS. This is an archive to store, preserve, and make publicly available, via the internet, over 80 travel surveys conducted from almost 45 metropolitan areas, states and localities. Located in the archive for each survey, if available, are the raw data, documentation, rectangularized dataset, xml dataset, and an analysis tool whereby users can summarize and analyze the survey data on the website. Generally, the reports did not address long-distance travel but short home-based travel. Although it is possible that the surveys could have some records of long-distance trips, intercity travel is not the focus of the Metropolitan Travel Survey Archive and thus the number of such trips would be extremely limited.
2.3.3 Factors that Influence Long-distance Passenger Travel Modeling
The majority of academic research is heavily concentrated on short-distance travel or trips conducted in daily urban systems (Limtanakool et al., 2006). Among the most important factors affecting mode choice for daily trips or short-distance trips are the socioeconomic characteristics of travelers. For a lot of studies that examine long-distance travel, the focus has been primarily on the impact of socioeconomic factors at the individual and household levels (Algers, 1993; Georggi and Pendyala, 1999; Mallett, 1999a,b; O’Neill and Brown, 1999). Although it is unclear whether conclusions about mode choice for short-distance trips can be translated easily to long-distance trips given that the latter involve more time and monetary expense, this limited number of studies dealing with long-distance travel suggests that these also play a significant part in modal choice for these types of trips (Limtanakool et al., 2006).
Analysis of the 1995 ATS shows that 80 percent of trips greater than 100 miles are taken by private car (Georggi and Pendyala, 1999). Mallett found that mode choice for long-distance trips does not differ much between men and women; however, women do tend to travel by bus more often and men by airplane (1999b). Age also affects mode choice. Georggi and Pendyala (1999) found that the elderly are significantly more dependent on the bus mode than the rest of the population. Also, the automobile mode share diminishes significantly for people over 75 years of age as the airplane and bus are used instead of the automobile more frequently (Georggi and Pendyala, 1999). In regards to income, Mallett (1999a) found that about two-thirds of people in low-income households did not make a single long-distance trip in 1995 with the most important limiting factors being the availability of a vehicle. Moreover, lower income groups were found to be much more likely to travel by automobile or bus when compared to other income groups (Georggi and Pendyala, 1999). Air travel was a more popular choice for long-distance travel as income levels increased.
In addition to socioeconomic factors, Rasmidatta (2006) examined trip characteristics such as trip distance, trip purpose (business, personal business, pleasure), and whether the trip was a short weekend, long weekend, or non-weekend trip using the 2001 NHTS. The analysis shows that socioeconomic factors such as occupation, income, race, whether a household is in an urban or rural area, and availability of a vehicle as well as trip characteristics such as nights away on a trip, household members on the trip, route distance, and trip characteristics all have a significant impact on mode choice.
Another area of focus for long-distance travel studies is the incorporation of land-use factors. Research has found that land-use factors have a significant impact on travel mode choice. In addition to studying traveler socioeconomic characteristics, travel time, and travel cost, Algers (1993) examined some elements of destination land use. He found that the total number of trips over 100 kilometers was sensitive to the characteristics of the destination including population size and number of jobs. However, the influence of travel mode choice on land use factors was not the main focus of his research. Bricka (1999) analyzed variations in long distance trips in New York, Massachusetts, and Oklahoma via descriptive cross-tabulation of survey results from the three locations. She finds that mode choice between states can be explained by differences between rural and urban areas such as dissimilar demographic profiles, availability of modes, and urban form. Using the 1989 Netherlands National Travel Survey, Limtanakool et al (2006) studied the effects of land use attributes such as population density, proximity to infrastructure, and land use diversity on travel mode choice. They concluded that spatial configuration of land use and transport infrastructure has a significant impact even when socioeconomic characteristics and travel time are taken into account.
One last set of factors used to model long-distance passenger travel mode choice is travel costs and travel time. These factors are not part of the 1995 ATS or 2001 NHTS or previous NTS surveys so Ashiabor et al. (2007) generated synthetic level-of-service variables from external data sources. They found that travel time and costs were a significant factor in travel mode choice. In general, as travel times and costs increased, the utility of any of the modes decreased. Furthermore, an examination of the travel costs for modes over the range of income levels in their research show that high-income travelers are less sensitive to travel cost.
One constant across all the research encountered is that mode choice varies across types of trip. Georggi and Pendyala (1999) assert that the mode choice varies considerably with trip purpose and trip length. For example, they found that personal vehicle is higher for personal or social trips, while air travel is the preferred method for business travel. As a result, researchers have consistently fit separate logit-based models to data by trip purpose. The amount of models fit is a function of the number of trip purposes in the data source.
In summary, the existing literature has shown that mode choice for long-distance travel is based on the socioeconomic characteristics of the traveler, aspects of the trip such as distance and duration, land use characteristics, as well as travel time and costs. In addition, the effect of these factors on mode choice varies by trip purpose.
2.4 Practice Review Findings
Of the 20 tourism/travel bureaus and economic development agencies that were contacted, a handful responded with valuable information for the practice review. Other organizations reported that they did not focus on long-term travel or simply did not respond to emails or voicemail messages left for them. This section presents the findings from those few organizations where useful information was obtained.
2.4.1 Metropolitan Transportation Commission in California
The Metropolitan Transportation Commission in Oakland, California is primarily concerned with intra-regional, short-distance travel and thus does not measure traveler mode choices themselves. However, when this information is needed, it is received from the California Statewide Travel Demand Model (CSTDM). This model is used by the State of California Department of Transportation to forecast personal travel by California residents on a typical weekday. The Long Distance Personal Travel Model (LDPTM) is one component of this application that applies to all trips greater than 100 miles. At the traffic zone level, the following travel information are modeled: trip frequency, party size, destination, main mode, and access/egress modes. Survey data as well as micro-simulation is used during model estimation to determine model parameters tied to decision choice probabilities. The main mode modeling uses a nested logit model to determine which of four potential modes of travel (car, air, conventional rail, and high speed rail) will be chosen for the long distance trip between the home and the destination zone. Separate models are created by type of trip (recreation/other purpose, or business/commute). Factors examined in the models are related to accessibility (e.g., cost, in-vehicle time, access/egress mode), demographics of the traveler or household (e.g., household size, income), and airport interchanges. The length of the trip is not considered. In addition, reliability indices such as the percent of flights/trains that arrive on time are assigned to each mode type (car, air, conventional rail, high speed rail), and used as explanatory parameters to explain long distance trip mode choice.
2.4.2 State of Michigan
Contacts in the State of Michigan reported that their state does not predict long distance travel by mode. They occasionally conduct surveys to capture information on long distance trips by car, rail or bus separately. Primarily, however, they use a report prepared by D.K. Shifflet and Associates (DKSA) in 2009 for the Michigan Economic Development Corporation that breaks out long-distance trips by mode when they need long-distance travel mode information. The report is titled “Michigan 2009 Visitor Profile” and focuses on a number of different travel and tourism related metrics, including U.S. and Michigan travel segments as well as travel parameters such as purpose of stay, travel composition and size, stay length, activities, daily spending, trip timing, accommodation type, and mode of transportation for leisure travel.
Data for this report comes from a DKSA-conducted, ongoing, monthly survey of U.S. consumers’ travel behavior—the PERFORMANCE/MonitorSM. Approximately 50,000 households are surveyed per month via mail and online panels. Each survey collects the previous three months of travel behavior. DKSA uses an overlapping monthly mail sequence which reduces sample bias for maximum accuracy. More than 75,000 traveling households respond to the survey each year. This results in more than 154,000 Stays at destinations throughout the U.S. According to DKSA, the 50,000 average monthly contacts as well as returned questionnaires are balanced to the U.S. population across six demographic variables (age, gender, income, education, number of adults, and state of residence). This rebalancing ensures findings are reflective of the U.S. population and enables findings to be projected to the entire U.S. population.
The report contains graphics on the frequency of automobile vs. air transportation as the main mode as measured in leisure person days in 2009. Also shown is the travel distance by auto and air as measured in leisure person-days for Michigan, the U.S., as well as the five geographical regions within Michigan. A representative from DKSA reported that these reports have been completed for a number of states and their respective economic development or travel bureaus. Some examples include Indiana, Tennessee, New Jersey, and Illinois.
2.4.3 American Automobile Association (AAA)
Each quarter, AAA publishes a holiday forecast that combines information from several sources to provide a prospective assessment of likely travel patterns for the upcoming holiday season. The most recent report is the AAA Independence Day 2001 Travel Forecast (AAA, 2011). This report is comprised of two key components – the actual travel forecast and the holiday traveler profile. The actual travel forecast is based on economic conditions while the holiday traveler profile is developed employing survey data on travel behaviors. AAA partners with two organizations in preparing the travel forecast: IHS Global Insight and D.K. Shifflet and Associates (DKSA). IHS Global Insight developed the approach for forecasting actual domestic travel volumes based on macroeconomic drivers such as employment, output, household net worth, asset prices including stock indices, interest rates, housing market indicators and variables related to travel and tourism, including prices of gasoline, airline travel and hotel stays. The historical travel volume estimates come from the ongoing travel survey database of DKSA who interviews over 50,000 U.S. households per month tracking trip incidence, party composition, traveler behavior, and spending all after the trips have been taken.
Actual travel is forecasted by person-trips, where a person-trip is defined as a trip that involves travel of 50 miles or more away from home. In particular, AAA and IHS Global Insight forecasts total US holiday travel, travel by mode of transportation, and travel by US census region.
According to a representative from IHS Global Insight, travel mode forecasts are based off of historical travel numbers and trends received from DKSA. IHS Global Insight then ties those historical trends to the current fuel price, miles traveled, and disposable income (of the sampled population) to predict the mode of travel. The change in each of those parameters, especially as compared to previous analyses, are crucial in forecasting future holiday travel modes. The other microeconomic factors mentioned in the report, such as unemployment, output, household net worth, are used to predict travel demand and not mode forecasting. However these and other factors may be applied to the travel mode model results in a qualitative/general way, to confirm the output with AAA findings or other market findings.
The previous examples provide a small sampling of the applied practices of travel/tourism bureaus and economic development agencies in relation to long-distance multimodal passenger travel mode choice. Many agencies contacted were non-responsive or were not able to provide valuable information for this report. Time on this research effort did not permit a more detailed examination.
2.5 Discussion
This section presents the results of a comprehensive literature and practice review to assess current knowledge on long distance multimodal passenger travel modeling. This review served as a precursor to the development of quantitative mathematical methods to analyze how long-distance passenger travelers make their modal choices. Knowledge gained during this review on the mathematical techniques used, data sources that served as the inputs, as well as the factors that were found to significantly affect long distance travel mode choice was used in the development of mathematical models for this research.
While the literature review found a range of analysis techniques, the predominant methodology employed to model modal choice was logistic regression modeling. Given the number of mode choices available to long-distance passenger travels, a multinomial logit model was used in the next phase of this research. The literature identified that mode choice varies considerably across trip purpose and trip length. Thus, separate models were fit by trip purpose. The decision on which model structure (i.e. nested logit model, mixed logit model) that was utilized and how many models were created was based on a thorough analysis of the final dataset and input factors that were to be used.
Going into this review, the research team believed that a crucial first step in developing and implementing a rigorous set of quantitative methods to analyze how long distance passenger travelers make their mode choices is having a complete, detailed, and accurate data source that can be used as inputs to the mathematical models. This review strengthens that belief. At a minimum, the data source(s) should:
- Contain the passenger-selected mode of travel (i.e. air, train, bus, personal passenger vehicle) for long distance trips;
- Contain detailed information on the long-distance travel trips and traveler (e.g. social, economic, and demographic characteristics of the traveler, availability of passenger vehicle, trip length, trip purpose, and available infrastructure facilities such as train, airport and highways);
- Be nationally representative of long distance travel in the U.S.; and
- Be available from public domain sources without the requirement of programs or purchases from private commercial vendors.
Based on the literature review, the research team decided to use the 2001 NHTS as the main data source when developing models for long-distance multimode passenger travel mode choice. It meets most of the four criteria above. Data from other sources were used to supplement the NHTS data in areas where the NHTS is lacking (level-of-service variables such as available transportation infrastructure, travel cost (indirectly through financial proxies such as those used by AAA), and land use characteristics at the origin or destination were used to capture information not present in the NHTS. The 2001 NHTS is preferred over the 1995 ATS solely because the NHTS contains more recent information. Although there do exist other travel surveys that have some data on long-distance travel, the literature review found that they lack the richness and size of the ATS or NHTS.