U.S. Department of Transportation
Federal Highway Administration
1200 New Jersey Avenue, SE
Washington, DC 20590
202-366-4000
Also available as Adobe PDF (1MB)
| Version | Issue Date | Summary of Changes |
|---|---|---|
| 1.0 | February 2018 | PM2 and Non-PM2 rule-related technical corrections (e.g., reporting requirement edits, data collection/reporting guidance clarifications, etc.) |
| 1.1 | November 2018 | Non-PM2 rule-related technical corrections (e.g., data model revisions, data collection/reporting guidance clarifications, image updates, appendices revisions, etc.) |
| 1.2 | December 2019 | Non-PM2 rule-related technical corrections (e.g., data collection/reporting guidance clarifications, appendices revisions, etc.) |
| 1.3 | November 2020 | Non-PM2 rule-related technical corrections (e.g., data collection/reporting guidance clarifications, appendices revisions, etc.) |
Notes:
Errata Key:
| Page | Discussion | Original Text | Revised Text | ||||||||||||||||||||||||
|---|---|---|---|---|---|---|---|---|---|---|---|---|---|---|---|---|---|---|---|---|---|---|---|---|---|---|---|
| 1-3 | Table 1.1: Minimum Data Reporting for Selected HPMS Products - Footnotes | 1/ Data for Lane-Miles on Rural Minor Collector, and Local roads are calculated using Summary miles times 2. Since the States are not required to report the number of through lanes on these systems, except for NHS sections, FHWA uses a multiplier of 2 for the number of lanes, to be consistent across all States. |
Total Daily VMT 3/ |
||||||||||||||||||||||||
| 1.5 | Section 1.5: Reporting Requirements - 1st paragraph | For example, Interstate pavement data and related data elements collected from January 1st 2016 through December 31st 2016 must be submitted (to FHWA) by April 15th 2017. | For example, Interstate pavement data and related data elements collected from January 1st |
||||||||||||||||||||||||
| 1-6 | Section 1.5: HPMS Submission Deadlines - 2nd paragraph | The tiered HPMS submission process is depicted in Figure 1.1. Submission deadlines begin with Interstate pavement and other related data items on April 15th (HPMS Submission 1), followed by the Certified Mileage on June 1st. Non-Interstate pavement, non-pavement, sample, and summary data are due to be submitted on June 15th (HPMS Submission 2). Moreover, the following pavement condition-related data must be reported by April 15 of the year following the data inventory year: Sections data for Functional System (Data Item 1 in Section 4.2), Urban Code (Data Item 2 in Section 4.2), Facility Type (Data Item 3 in Section 4.2), Structure Type (Data Item 4 in Section 4.2), Through Lanes (Data Item 7 in Section 4.2), IRI (Data Item 47 in Section 4.2), Surface Type (Data Item 49 in Section 4.2), Rutting (Data Item 50 in Section 4.2), Faulting (Data Item 51 in Section 4.2), Cracking Percent (Data Item 52 in Section 4.2), NHS (National Highway System) (Data Item 64 in Section 4.2) and a dual-carriageway, LRS-enabled, geospatial Routes dataset (Section 3.3). See Chapter 4, Sec. 4.3 and 4.4 for details on data item-specific collection and reporting requirements. |
The tiered HPMS submission process is depicted in Figure 1.1. Submission deadlines begin with Interstate pavement and other related data items on April 15th (HPMS Submission 1), followed by the Certified Mileage on June 1st. Non-Interstate pavement, non-pavement, sample, and summary data are due to be submitted on June 15th (HPMS Submission 2). Moreover, the following pavement condition-related data must be reported by April 15 of the year following the data inventory year: Sections data for Functional System (Data Item 1 in Section 4.2), Urban Code (Data Item 2 in Section 4.2), Facility Type (Data Item 3 in Section 4.2), Structure Type (Data Item 4 in Section 4.2), Through Lanes (Data Item 7 in Section 4.2), IRI (Data Item 47 in Section 4.2), Surface Type (Data Item 49 in Section 4.2), Rutting (Data Item 50 in Section 4.2), Faulting (Data Item 51 in Section 4.2), Cracking Percent (Data Item 52 in Section 4.2) |
||||||||||||||||||||||||
| 2-2 | Table 2.1: Data Items to be Reported - Data Item 1: Functional System | 1 | Functional System | FE + R | | | 1 | Functional System | FE + R* | | | ||||||||||||||||||||||||
| 2-2 | Table 2.1: Data Items to be Reported - Data Item 3: Facility Type | 3 | Facility Type | FE + R | | | 3 | Facility Type | FE + R* | | | ||||||||||||||||||||||||
| 2-2 | Table 2.1: Data Items to be Reported - Data Item 14: Speed Limit |
|
|
||||||||||||||||||||||||
| 2-2 | Table 2.1: Data Items to be Reported - Data Item 20: Alternate Route Name |
|
|
||||||||||||||||||||||||
| 2-3 | Table 2.1: Data Items to be Reported - Data Item 47: International Roughness Index (IRI) |
|
|
||||||||||||||||||||||||
| 2-4 | Table 2.1: Data Items to be Reported - Data Item 68: Maintenance and Operations |
|
|
||||||||||||||||||||||||
| 2-4 | Table 2.1: Data Items to be Reported - Data Item 63: County Code |
|
|
||||||||||||||||||||||||
| 2-4 | Table 2.1: Data Items to be Reported - Footnotes | FE = Full Extent for all functional systems (including State and non-State roadways) FE* = Full Extent for some functional systems, (see Chap. 4, Sec. 4.4 for more details) FE** = Full Extent wherever data item is applicable, (see Chap. 4, Sec. 4.4 for more details) FE*** = Full Extent for all NHS roadways (including State and non-State roadways) FE***# = (Optional) Full Extent for NHS roadways (including State and non-State roadways) FE****# = (Optional) Full Extent for Interstate roadways (including State and non-State roadways) FE + R = Full Extent including ramps located within grade-separated interchanges SP = All Sample Panel Sections (as defined by HPMS) SP* = Some Sample Panel Sections (see Chap. 4, Sec. 4.4 for more details) |
FE = Full Extent for either all FE* = Full Extent for some FE** = Full Extent for either all Federal-aid systems, or all public roads wherever data item is applicable, (see Chap. 4, Sec. 4.4 for more details) FE*** = Full Extent for all NHS roadways (including State and non-State roadways) FE***# = (Optional) Full Extent for NHS roadways (including State and non-State roadways) FE****# = (Optional) Full Extent for Interstate roadways (including State and non-State roadways) FE + R = Full Extent for all Federal-aid systems, including ramps located within grade-separated interchanges FE + R* = Full Extent for all Federal-aid systems, including ramps located within grade-separated interchanges SP = SP* = |
||||||||||||||||||||||||
| 2-5 | Summary Data - Discussion | The following summaries are to be reported as five individual datasets, which will be stored as tables within FHWA's database: 1 - Statewide Summaries 2 - Vehicle Summaries 3 - Urban Summaries 4 - County Summaries 5 - NAAQS Summaries |
The following summaries are to be reported as 1 - Statewide Summaries 2 - Vehicle Summaries 3 - Urban Summaries 4 - County Summaries |
||||||||||||||||||||||||
| 2-6 | NAAQS Summaries - Discussion | This summary includes system length and travel data for rural minor collectors and rural/urban locals summarized by non-attainment and maintenance areas, and pollutant type. HPMS uses the Environmental Protection Agency (EPA) defined non-attainment or maintenance area for identification purposes. | |||||||||||||||||||||||||
| 3-1 | Overview - Discussion | This data model is organized conceptually into a group of six catalogs. Each catalog groups the various datasets by type and/or function. The types of data can be categorized as: (1) geospatial data, representing various highway systems, geographic boundaries etc., (2) roadway attribute data that can be linked to a related GIS dataset, which allows the attribute data to be represented spatially via linear referencing or (3) metadata, which provides additional global information about the data. Figure 3.1 illustrates the structure of the HPMS data model. The HPMS attribute data that are submitted by the States are grouped within the Sections Catalog. The Sections dataset that is identified in this catalog stores all of the records for each data item as they are reported by the States. The Sample Panel Identification dataset stores the limits for each State's sample panel as identified by the States. The Data Item field in the Sections dataset specifies the type of record (e.g. AADT, Lane Width, etc.), with the corresponding data stored in the Value (Numeric, Text, or Date) fields. These records act independently of one another, as they indicate the properties of the attribute they portray. Furthermore, the records in both the Sections and Sample Panel Identification datasets are linked to each State's geospatial network (i.e. LRS network) via its attribute table, which is identified as the Routes dataset that is identified in the model's Shapes Catalog. Data associated with the lower functional systems (i.e. minor collectors in rural areas and local roads in all areas) are summarized and reported in the datasets identified in the Summaries Catalog. The level of data for these functional systems is commensurate with the Federal need for analyzing and reporting these data. The Estimates Catalog contains a dataset of pavement attributes that will be used as input to FHWA's pavement models. The Metadata Catalog contains data that describe the methods and tools that are used for the collection and reporting of traffic, pavement, and ramp data. The References Catalog identifies the geospatial data which will ultimately be maintained by FHWA or other non-State entities. The data in these datasets are available for use by the States throughout the year for reference. |
This data model is organized conceptually into a group of Figure 3.1 illustrates the structure of the HPMS data model. The HPMS attribute data that are submitted by the States are grouped within the Sections Catalog. The Sections dataset that is identified in this catalog stores all of the records for each data item as they are reported by the States. The Sample Panel Identification dataset stores the limits for each State's sample panel as identified by the States. The Data Item field in the Sections dataset specifies the type of record (e.g. AADT, Lane Width, etc.), with the corresponding data stored in the Value (Numeric, Text, or Date) fields. These records act independently of one another, as they indicate the properties of the attribute they portray. Furthermore, the records in both the Sections and Sample Panel Identification datasets are linked to each State's geospatial network (i.e. LRS network) via its attribute table, which is identified as the Routes dataset that is identified in the model's Shapes Catalog. Data associated with the lower functional systems (i.e. minor collectors in rural areas and local roads in all areas) are summarized and reported in the datasets identified in the Summaries Catalog. The level of data for these functional systems is commensurate with the Federal need for analyzing and reporting these data. The Estimates Catalog contains a dataset of pavement attributes that will be used as input to FHWA's pavement models. The Metadata Catalog contains data that describe the methods and tools that are used for the collection and reporting of traffic, pavement, and ramp data. |
||||||||||||||||||||||||
| 3-2 | Figure 3.1 HPMS Data Model Structure - Image | 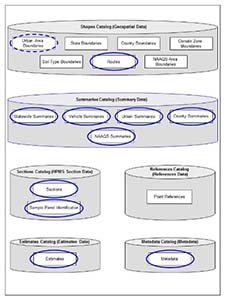 |
Removed the 'NAAQS Summaries' object from the 'NAAQS Area Boundaries', and 'Summaries Catalog' portions of the image; removed the 'References Catalog' from the image. | ||||||||||||||||||||||||
| 3-3 | Geospatial Component - Discussion | Furthermore, the geospatial component of the data model involves the use of a LRS, which links the HPMS attribute data to a series of shape files. Both the geospatial and attribute data contain three referencing elements that are used to perform the linkage for linear features: (1) A unique Route ID, (2) a beginning milepoint, and (3) an ending milepoint. Point features use a route milepoint in place of a beginning and ending milepoint for referencing purposes. Data Items are identified in the Point References datasets of the model's References Catalog and are linked to and spatially referenced in the same manner. For general guidance on the development of a State wide LRS, see the FHWA publication, All Public Roads Geospatial Representation Study. | Furthermore, the geospatial component of the data model involves the use of a LRS, which links the HPMS attribute data to a series of shape files. Both the geospatial and attribute data contain three referencing elements that are used to perform the linkage for linear features: (1) A unique Route ID, (2) a beginning milepoint, and (3) an ending milepoint. |
||||||||||||||||||||||||
| 3-5 | Shapes Catalog - Image | N/A | Deleted [NAAQS Area Boundaries] Object from Shapes Catalog image | ||||||||||||||||||||||||
| 3-7 | Table 3.5 Routes Footnotes | Extent – All public roads including Federal-aid highways, and ramps located within grade-separated interchanges (including NHS routes). This roadway network is termed 'All Roads Network' or ARNOLD. | Extent – All public roads including Federal-aid highways, and ramps located within grade-separated interchanges (including NHS routes). This roadway network is termed the 'All Roads Network of Linear Referenced Data' or ARNOLD. | ||||||||||||||||||||||||
| 3-9 | Table 3.7 NAAQS Area Boundaries - Discussion & Table | Table 3.7 describes the polygon shapes dataset representing the EPA-defined non-attainment and maintenance areas for each State. This dataset will be maintained by FHWA. The definition of a Maintenance Area is any geographic region of the Unites States previously designated as non-attainment pursuant to the Clean Air Act (CAA) Amendments of 1990 and subsequently re-designated to attainment subject to the requirement to develop a maintenance plan under Section 175A of the CAA, as amended. The national HPMS database is used for tracking travel for air quality assurance purposes in non-attainment and maintenance areas as required by EPA under the 1990 CAA (Section 187) and the Transportation Conformity Rule, 40 CFR parts 51 and 93. More specifically, the database is used primarily for establishing regional transportation-related emissions for transportation conformity purposes. Estimated travel based on these data is used for the calibration and validation of base-year network travel models when required for non-attainment or maintenance areas. [NAAQS AREA BOUNDARIES TABLE] |
The definition of a Maintenance Area is any geographic region of the Unites States previously designated as non-attainment pursuant to the Clean Air Act (CAA) Amendments of 1990 and subsequently re-designated to attainment subject to the requirement to develop a maintenance plan under Section 175A of the CAA, as amended. The national HPMS database is used for tracking travel for air quality assurance purposes in non-attainment and maintenance areas as required by EPA under the 1990 CAA (Section 187) and the Transportation Conformity Rule, 40 CFR parts 51 and 93. More specifically, the database is used primarily for establishing regional transportation-related emissions for transportation conformity purposes. Estimated travel based on these data is used for the calibration and validation of base-year network travel models when required for non-attainment or maintenance areas. [NAAQS AREA BOUNDARIES TABLE] |
||||||||||||||||||||||||
| 3-11 | Table 3.8 Sections Description | Table 3.8 describes the State reported HPMS Section dataset representing all Federal-aid highways and other applicable sections. The specific requirements for the information to be reported in the Data Item field are defined in detail in Chapter 4. See Table 4.2 for a full list of the required HPMS Data Items and related reporting requirements. | Table 3.8 describes the State reported HPMS Section dataset representing all Federal-aid highways and |
||||||||||||||||||||||||
| 3-11 | Table 3.8 Sections Footnotes | Extent: All Federal-aid highways and ramps located within grade separated interchanges and applicable items on other sections where a toll facility exists; optional for other sections. | Extent: All Federal-aid highways and ramps located within grade separated interchanges |
||||||||||||||||||||||||
| 3-13 | Summaries Catalog - Image |  |
Removed the 'NAAQS Summaries' object from the 'Summaries Catalog' portion of the image. | ||||||||||||||||||||||||
| 3-13 | Summaries Catalog - Discussion | This catalog is comprised of the following five datasets:
|
This catalog is comprised of the following
|
||||||||||||||||||||||||
| 3-14 | Table 3.10 Statewide Summaries Description | Table 3.10 describes the dataset which contains demographic and system length estimates for all Urban and Rural public roads, functionally classified as minor collector in rural areas or local in any area, summarized by State. In addition, this dataset contains daily vehicle-miles traveled (VMT) estimates for all public roads located in Small Urban areas, functionally classified as minor collector or local. This includes NHS roads located on these functional systems. | Table 3.10 describes the dataset which contains demographic and system length estimates for all |
||||||||||||||||||||||||
| 3-14 | Table 3.10 Statewide Summaries Table | Rural Population (> 5,000) | Rural Population ( |
||||||||||||||||||||||||
| 3-14 | Table 3.10 Statewide Summaries Footnotes | Extent: All public roads functionally classified as Rural Minor Collector/Local and Small Urban Local. Any NHS routes or toll roads on these functional systems should be included. | Extent: All public roads functionally classified as Rural Minor Collector |
||||||||||||||||||||||||
| 3-18 | Table 3.14 NAAQS Summaries - Discussion, Table, & Footnotes | Table 3.14 describes the dataset which contains system length and travel data for all roads functionally classified as minor collector in rural areas or local in any area summarized by EPA Non-Attainment or Maintenance Area, and the relative pollutant standard. [NAAQS Summary Table] Extent: All public roads functionally classified as minor collector in rural areas or local in any area. Any NHS routes or toll roads on these functional systems should be included. Reporting cycle: Review annually; update as needed. Collection requirements: Travel and system length data for each pollutant standard within the applicable NAAQS area within the State. |
[NAAQS Summary Table] Extent: All public roads functionally classified as minor collector in rural areas or local in any area. Any NHS routes or toll roads on these functional systems should be included. Reporting cycle: Review annually; update as needed. Collection requirements: Travel and system length data for each pollutant standard within the applicable NAAQS area within the State. |
||||||||||||||||||||||||
| 3-19 | References Catalog - Discussion | The References Catalog identifies the reference data that will be maintained by FHWA or other Non-State DOT entities at some point in the future. This catalog identifies the Point References dataset, which contains data for grade-separated interchanges that are located on the Federal-aid system, excluding roads functionally classified as minor collector in rural areas or local in any area. [References Catalog Image] |
[References Catalog Image] |
||||||||||||||||||||||||
| 3-20 | Table 3.15 Point References - Discussion, & Table | Table 3.15 describes the dataset which contains data for grade-separated interchanges that are located on the Federal-aid system, excluding roads functionally classified as minor collector in rural areas or local in any area. Currently, this dataset only contains the location and type of grade-separated interchanges. This dataset will be populated by FHWA for the States that do not currently have these data. [Point References Table] |
[Point References Table] |
||||||||||||||||||||||||
| 3-22 | Table 3.16 Estimates Discussion | Table 3.16 describes the dataset which contains statewide estimates to be used as default inputs for FHWA's pavement deterioration models. Table 3.18 contains a list of the valid entries for the Estimate Type Field and their associated values. | Table 3.16 describes the dataset which contains statewide estimates to be used as default inputs for FHWA's pavement deterioration models. Table |
||||||||||||||||||||||||
| 3-22 | Table 3.18 Estimates Estimate Type - Valid Values | A detailed list of the estimate types is provided in Table 3.18 below. | A detailed list of the estimate types is provided in Table |
||||||||||||||||||||||||
| 3-22 | Table 3.18 Estimates Value Numeric - Valid Values | Must be numeric as specified (in Table 3.18) under the Value Numeric descriptions. | Must be numeric as specified (in Table 3. |
||||||||||||||||||||||||
| 3-26 | Table 3.18 Metadata Discussion | Table 3.18 describes the dataset which contains data that captures and explains variability in the collection and reporting of traffic and pavement data in HPMS. Table 3.20 lists the valid entries for the Metadata Type Field and their associated values. | Table 3.18 describes the dataset which contains data that captures and explains variability in the collection and reporting of traffic and pavement data in HPMS. Table |
||||||||||||||||||||||||
| 3-26 | Table 3.18 Metadata - Metadata Type - Valid Values | A detailed list of the metadata types is provided in Table 3.20 below. Multiple metadata types are permitted per data item. | A detailed list of the metadata types is provided in Table |
||||||||||||||||||||||||
| 3-26 | Table 3.18 Metadata - Value Numeric - Valid Values | Must be numeric as specified (in Table 3.20) under the Value Numeric descriptions. | Must be numeric as specified (in Table |
||||||||||||||||||||||||
| 3-27 | Table 3.19 Metadata Types and Valid Values - AADT_24 / Description | Number of permanent and portable counter locations that were counted for a duration of 24 hours or more | Number of |
||||||||||||||||||||||||
| 3-27 | Table 3.19 Metadata Types and Valid Values - Class_24 / Description | Number of permanent and portable classification count locations that were counted for a duration of 24 hours or more | Number of |
||||||||||||||||||||||||
| 3-27 | Table 3.19 Metadata Types and Valid Values - Class_48 / Description | Number of permanent and portable classification count locations that were counted for a duration of 48 hours or more | Number of |
||||||||||||||||||||||||
| 3-27 | Table 3.19 Metadata Types and Valid Values - AADT_48 / Description | Number of permanent and portable counter locations that were counted for a duration of 24 hours or more | Number of |
||||||||||||||||||||||||
| 4-10 | Table 4.2 Data Items, Related Submission Deadlines and Required Reporting Formats – Data Item 1: Functional System | 1 | Functional System | FE + R | | April 15th# | I&NI | 1 | Functional System | FE + R* | | April 15th# | I&NI | ||||||||||||||||||||||||
| 4-10 | Table 4.2 Data Items, Related Submission Deadlines and Required Reporting Formats – Data Item 3: Facility Type | 3 | Facility Type | FE + R | | | April 15th# | I&NI | | 3 | Facility Type | FE + R* | | April 15th# | I&NI | | ||||||||||||||||||||||||
| 4-10 | Table 4.2 Data Items, Related Submission Deadlines and Required Reporting Formats – Data Item 7: Through Lanes |
|
|
||||||||||||||||||||||||
| 4-10 | Table 4.2: Data Items to be Reported - Data Item 14: Speed Limit |
|
|
||||||||||||||||||||||||
| 4-10 | Table 4.2: Data Items to be Reported - Data Item 20: Alternate Route Name |
|
|
||||||||||||||||||||||||
| 4-10 | Table 4.2: Data Items to be Reported - Data Item 22: Single-Unit Truck and Bus AADT |
|
|
||||||||||||||||||||||||
| 4-12 | Table 4.2: Data Items to be Reported - Data Item 63: County Code |
|
|
||||||||||||||||||||||||
| 4-12 | Table 4.2: Data Items to be Reported - Data Item 68: Maintenance and Operations |
|
|
||||||||||||||||||||||||
| 4-12 | Table 4.2: Data Items to be Reported - Footnotes | FE = Full Extent for all functional systems (including State and non-State roadways) FE* = Full Extent for some functional systems, (see Chap. 4, Sec. 4.4 for more details) FE** = Full Extent wherever data item is applicable, (see Chap. 4, Sec. 4.4 for more details) FE*** = Full Extent for all NHS roadways (including State and non-State roadways) FE***# = (Optional) Full Extent for NHS roadways (including State and non-State roadways) FE****# = (Optional) Full Extent for Interstate roadways (including State and non-State roadways) FE + R = Full Extent including ramps located within grade-separated interchanges SP = All Sample Panel Sections (as defined by HPMS) SP* = Some Sample Panel Sections (see Chap. 4, Sec. 4.4 for more details) |
FE = Full Extent for either all FE* = Full Extent for some FE** = Full Extent for either all Federal-aid systems, or all public roads wherever data item is applicable, (see Chap. 4, Sec. 4.4 for more details) FE*** = Full Extent for all NHS roadways (including State and non-State roadways) FE***# = (Optional) Full Extent for NHS roadways (including State and non-State roadways) FE****# = (Optional) Full Extent for Interstate roadways (including State and non-State roadways) FE + R = Full Extent for all Federal-aid systems, including ramps located within grade-separated interchanges FE + R* = Full Extent for all public roads, including ramps located within grade-separated interchanges SP = SP* = *NOTE: The extent requirement specifications in Sec. 4.4 will be updated, for the applicable data items, to reflect the revisions noted above. |
||||||||||||||||||||||||
| 4-16 | Item 1: Functional System - Extent Grid | Grid/table indicates that this data item is required to be reported on a FE+R basis | Grid/table should indicate that this data item is required to be reported on a FE+R* basis | ||||||||||||||||||||||||
| 4-17 | Item 2: Urban Code - Extent | All Public highways including ramps located within grade-separated interchanges as identified in 23 U.S.C. 101.a(27). | All |
||||||||||||||||||||||||
| 4-17 | Item 2: Urban Code - Extent Grid |
|
|
||||||||||||||||||||||||
| 4-18 | Item 3: Facility Type - Extent Grid | Grid/table indicates that this data item is required to be reported on a FE+R basis | Grid/table should indicate that this data item is required to be reported on a FE+R* basis | ||||||||||||||||||||||||
| 4-28 | Item 6: Ownership - Coding Options | 31 | State Toll Road | | 31 | State Toll |
||||||||||||||||||||||||
| 4-30 | Item 7: Through Lanes - Guidance | For LRS purposes, this Data Item can be reported independently for both directions of travel associated with divided highway sections, for which dual carriageway GIS network representation is required per guidance in Chapter 3, Section 3.3 and Table 3.5. | |||||||||||||||||||||||||
| 4-42 | Figure 4.29: Multiple Turn Lanes (Code '2') Example - Image | Figure 4.29: Multiple Turn Lanes (Code '2') Example | |||||||||||||||||||||||||
| 4-44 | Item 14: Speed Limit - Guidance | If the speed limit changes within the limits of a section, the State shall determine and report the predominant speed limit. Baseline speed limit data for the National Highway System (NHS) will be provided by FHWA. The State shall validate or update this information annually as needed. |
If the speed limit changes within the limits of a section, the State shall determine and report the predominant speed limit. Baseline speed limit data for the National Highway System (NHS) will be provided by FHWA. The State shall validate or update this information annually as needed. For sections where minimum and maximum posted speed limits (PSLs) are present, this data item shall be coded in accordance with the maximum PSLs. For sections where dynamically controlled (e.g., gantry-controlled) speed limits are present, code the PSL. If the speed limit for these sections during the peak period is lower than the PSL, code the lower value (i.e., peak period speed limit). |
||||||||||||||||||||||||
| 4-48 | Item 18: Route Signing - Coding Requirements |
|
|
||||||||||||||||||||||||
| 4-49 | Item 19: Route_Qualifier - Coding Requirements |
|
|
||||||||||||||||||||||||
| 4-52 | Item 21: AADT - Guidance | If average weekday, average weekly, or average monthly traffic is calculated or available, it shall be adjusted to represent the annual average daily traffic (AADT). AADT is an average daily value that represents all days of the reporting year. | If average weekday, average weekly, or average monthly traffic is calculated or available, it shall be adjusted to represent the annual average daily traffic (AADT). AADT is an average daily value that represents all days of the |
||||||||||||||||||||||||
| 4-53 | Item 22: Single-Unit Truck and Bus AADT - Guidance | - For two-way facilities, provide the bidirectional Single-unit Truck and Bus AADT; for one-way roadways, and ramps, provide the directional Single-unit Truck and Bus AADT. - This value shall be representative of all single-unit truck and bus activity based on vehicle classification count data from both the State's and other agency's traffic monitoring programs over all days of the week and all seasons of the year. Actual vehicle classification counts shall be adjusted to represent average conditions as recommended in the Traffic Monitoring Guide (TMG). Single-unit trucks and buses are defined as vehicle classes 4 through 7 (buses through four-or-more axle, single-unit trucks). - AADT values shall be updated annually to represent current year data. Section specific measured values are requested based on traffic counts taken on a minimum three-year cycle. If these data are not available, values derived from classification station data on the same route, or on a similar route with similar traffic characteristics in the same area can be used. - Specific guidance for the frequency and size of vehicle classification data collection programs, factor development, age of data, and other applications is contained in the Traffic Monitoring Guide. |
- For two-way facilities, provide the bidirectional combined Single-unit Truck and Bus AADT; for one-way roadways, and ramps, provide the directional combined Single-unit Truck and Bus AADT. This value shall be representative of all combination truck activity based on vehicle classification data from traffic monitoring programs over all days of the week and all seasons of the year. - Historical AADT values shall be - Sample -Specific guidance for the frequency and size of vehicle classification data collection programs, factor development, age of data, and other applications is contained in the Traffic Monitoring Guide. |
||||||||||||||||||||||||
| 4-56 & 57 | Item 24: Combination Truck AADT - Guidance | - For two-way facilities, provide the bidirectional Combination Truck AADT; for one-way roadways, and ramps, provide the directional Combination Truck AADT. - This value shall be representative of all combination truck activity based on vehicle classification data from traffic monitoring programs over all days of the week and all seasons of the year. Actual vehicle classification counts shall be adjusted to represent average conditions as recommended in the Traffic Monitoring Guide (TMG). Combination trucks are defined as vehicle classes 8 through 13 (four-or-less axle, single-trailer trucks through seven-or-more axle, multi- trailer trucks). - AADT values shall be updated annually to represent current year data. - Section specific measured values are requested based on traffic counts taken on a three-year cycle, at a minimum. If these data are not available, use values derived from classification station data on the same route or on a similar route with similar traffic characteristics in the same area. Specific guidance for the frequency and size of vehicle classification data collection programs, factor development, age of data, and other applications is contained in the Traffic Monitoring Guide. |
- For two-way facilities, provide the bidirectional Combination Truck AADT; for one-way roadways, and ramps, provide the directional Combination Truck AADT. - This value shall be representative of all combination truck activity based on vehicle classification data from traffic monitoring programs over all days of the week and all seasons of the year. - Historical AADT values shall be - Sample Specific guidance for the frequency and size of vehicle classification data collection programs, factor development, age of data, and other applications is contained in the Traffic Monitoring Guide. |
||||||||||||||||||||||||
| 4-64 | Item 30: Percent Green Time - Guidance | Additional Guidance: Code this Data Item for all sections where right and left turn data (Data Items 12 and 13) are coded. For uncoordinated traffic actuated signals only, data can be collected when monitoring green time. Consider the surrounding environment and determine if the inventory direction of the signal would actually carry the peak flow for the intersection. Based on this approach, the value received may be an estimate depending upon the operation of the traffic signal during the peak hour. Furthermore, if the traffic signal is fully actuated, or the approach of interest is actuated, estimate the percent of green time based on the maximum green time available for that phase of operation versus the maximum cycle length. This would provide the "worst case" scenario since the volume on the actuated approach typically varies cycle by cycle. Where peak capacity for a section is governed by a particular intersection that is on the section, this Data Item shall be coded based on the percent green time at that location; otherwise code this Data Item for the predominate intersection. For traffic actuated traffic signals, use the results of a field check of several (three complete cycles) peak period light cycles to determine a "typical" green time. Ignore separate green-arrow time for turning movements. |
Additional Guidance: Code this Data Item for all sections where right and left turn data (Data Items 12 and 13) are coded. For uncoordinated traffic actuated signals only, data can be collected when monitoring green time. Consider the surrounding environment and determine if the inventory direction of the signal would actually carry the peak flow for the intersection. Based on this approach, the value received may be an estimate depending upon the operation of the traffic signal during the peak hour. Furthermore, if the traffic signal is fully actuated, or the approach of interest is actuated, estimate the percent of green time based on the maximum green time available for that phase of operation versus the maximum cycle length. This would provide the "worst case" scenario since the volume on the actuated approach typically varies cycle by cycle. Where peak capacity for a section is governed by a particular intersection that is on the section, this Data Item shall be coded based on the percent green time at that location; otherwise code this Data Item for the predominate intersection. For traffic actuated traffic signals, use the results of a field check of several (three complete cycles) peak period light cycles to determine a "typical" green time. Ignore separate green-arrow time for turning movements. If this data is not available for the signalized intersections associated with a given sample section, percent green time data from other signalized intersections located on the same route, or on a similar route with similar traffic characteristics in the immediate vicinity can be used for reporting purposes. |
||||||||||||||||||||||||
| 4-65 | Item 31: Number of Signalized Intersections - Guidance | Only signals which cycle through a complete sequence of signalization (i.e., red, yellow (amber), and green) for all or a portion of the day shall be counted as a signal. Access points to large traffic generators (e.g., shopping centers, malls, large work sites, office parks, apartment complexes, etc.) shall be counted as intersections if the access point is controlled by a traffic signal. Special treatment is required when a Sample Panel section begins and/or ends with a traffic control device (i.e., Data Items 31, 32, and 33). This is accomplished by doing the following as illustrated in Figure 4.42:
Roundabouts (see Figure 4.20) shall be coded under Data Item 33 (At-Grade/Other) intersections. The sum of Data Items 31, 32, and 33 shall be equal to the total number of intersections on the section. |
Only signals which cycle through a complete sequence of signalization (i.e., red, yellow (amber), and green) for all or a portion of the day shall be counted as a signal. Access points to large traffic generators (e.g., shopping centers, malls, large work sites, office parks, apartment complexes, etc.) shall be counted as intersections if the access point is controlled by a traffic signal. Special treatment is required when a Sample Panel section begins and/or ends with a traffic control device (i.e., Data Items 31, 32, and 33). This is accomplished by doing the following as illustrated in Figure 4.42:
Roundabouts (see Figure 4.20) shall be coded under Data Item 33 (At-Grade/Other) intersections. The sum of Data Items 31, 32, and 33 shall be equal to the total number of intersections on the section. At-grade crossings where pedestrian-activated signals are present shall not be included in the count for this data item, unless a cross-street is present. |
||||||||||||||||||||||||
| 4-67 | Item 32: Number of Stop Sign-Controlled Intersections - Guidance | A continuously operating (i.e. all day), flashing red signal shall be counted as a stop sign. Stop signs on intersecting roads shall not be included in the total count. Access points to large traffic generators (e.g., shopping centers, malls, large work sites, office parks, apartment complexes, etc.) shall be counted as intersections if the access point is controlled by a stop sign. Special treatment is required when a Sample Panel section begins and/or ends with a traffic control device (i.e., Data Items 31, 32, and 33). This is accomplished by doing the following as illustrated in Figure 4.44:
Roundabouts (see Figure 4.20) shall be coded under Data Item 33 (At-Grade/Other) intersections. The sum of Data Items 31, 32, and 33 shall be equal to the total number of intersections on the section. |
A continuously operating (i.e. all day), flashing red signal shall be counted as a stop sign. Stop signs on intersecting roads shall not be included in the total count. Access points to large traffic generators (e.g., shopping centers, malls, large work sites, office parks, apartment complexes, etc.) shall be counted as intersections if the access point is controlled by a stop sign. Special treatment is required when a Sample Panel section begins and/or ends with a traffic control device (i.e., Data Items 31, 32, and 33). This is accomplished by doing the following as illustrated in Figure 4.44:
Roundabouts (see Figure 4.20) shall be coded under Data Item 33 (At-Grade/Other) intersections. The sum of Data Items 31, 32, and 33 shall be equal to the total number of intersections on the section. At-grade crossings where pedestrian-activated signals are present shall not be included in the count for this data item, unless a cross-street is present. |
||||||||||||||||||||||||
| 4-67 | Figure 4.43 Title | Figure 4.43 Stop Sign Controlled Intersection | Figure 4.43 Stop-Sign Controlled Intersection | ||||||||||||||||||||||||
| 4-69 | Item 33: Number of Intersections, Type - Other - Guidance | Intersections with either no traffic control devices, or specialized traffic control devices existing in the inventory direction, shall be included in the count for this data item. Continuously operating (i.e. all day) flashing yellow signals and roundabouts (see Figure 4.20) shall be considered as an "at-grade/other" type of traffic control devices. Access points to large traffic generators (e.g., shopping centers, malls, large work sites, office parks, apartment complexes, schools, etc.) shall be included in the evaluation for this Data Item. Special treatment is required when a Sample Panel section begins and/or ends with a traffic control device (i.e., Data Items 31, 32, and 33). This is accomplished by doing the following as illustrated in Figure 4.46:
The sum of Data Items 31, 32, and 33 shall be equal to the total number of intersections on the section. |
Intersections with either no traffic control devices, or specialized traffic control devices existing in the inventory direction, shall be included in the count for this data item. Continuously operating (i.e. all day) flashing yellow signals and roundabouts (see Figure 4.20) shall be considered as an "at-grade/other" type of traffic control devices. Access points to large traffic generators (e.g., shopping centers, malls, large work sites, office parks, apartment complexes, schools, etc.) shall be included in the evaluation for this Data Item. Special treatment is required when a Sample Panel section begins and/or ends with a traffic control device (i.e., Data Items 31, 32, and 33). This is accomplished by doing the following as illustrated in Figure 4.46:
The sum of Data Items 31, 32, and 33 shall be equal to the total number of intersections on the section. At-grade crossings where pedestrian-activated signals are present shall not be included in the count for this data item, unless a cross-street is present. |
||||||||||||||||||||||||
| 4-72 | Item 35: Median Type - Coding Requirements for Fields 8, 9, and 10 Footnote | These definitions are summarized from AASHTO Policy on Geometric Design of Highways and Streets 2004. * Codes 5, 6, and 7 are optional. |
* Codes 5, 6, and 7 are optional. |
||||||||||||||||||||||||
| 4-77 | Item 38: Right Shoulder Width - Coding Requirements for Fields 8, 9, and 10 | Value_Numeric: Enter the width of the right shoulder to the nearest whole foot. | Value_Numeric: Enter the width of the right shoulder to the nearest whole foot. Zero (0) values shall only be reported for sections where shoulders do not exist. | ||||||||||||||||||||||||
| 4-80 | Item 39: Left Shoulder Width - Coding Requirements for Fields 8, 9, and 10 | Value_Numeric: Enter the width of the left shoulder to the nearest whole foot. | Value_Numeric: Enter the width of the left shoulder to the nearest whole foot. Zero (0) values shall only be reported for sections where shoulders do not exist. | ||||||||||||||||||||||||
| 4-84 | Item 42: Widening Potential - Coding Requirements for Fields 8, 9, and 10 | Value_Numeric: Code the number of lanes (0-9) for which it is feasible to widen the existing road, in both directions. Code a '9,' if it is possible to add nine or more lanes. | Value_Numeric: Code the number of lanes (0-9) for which it is feasible to widen the existing road, in both directions. Code a '9,' if it is possible to add nine or more lanes to the entire cross-section (i.e., sample section). | ||||||||||||||||||||||||
| 4-90 | Item 46: Percent Passing Sight Distance - Guidance | This data item shall be reported for sample sections where passing is permitted in the inventory direction. When there is a discernable directional difference in permitted passing per the roadway striping, code for the more restrictive direction (i.e., the direction that produces the lower value). |
This data item shall be coded |
||||||||||||||||||||||||
| 4-90 | Item 46: Percent Passing Sight Distance - Guidance | N/A | Inserted new image: "Figure 4.XX: Passing Permitted (Northbound)"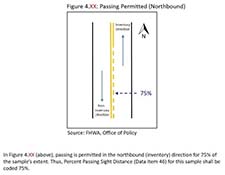 |
||||||||||||||||||||||||
| 4-91 | Item 47: IRI (International Roughness Index) - Coding Requirements for Fields 8, 9, and 10 | Value_Text: No entry required if the Value_Numeric field has been populated with a newly measured value for a NHS section. If the Value_Numeric has not been populated with a newly measured value, then one of the following codes shall be provided: | Value_Text: |
||||||||||||||||||||||||
| 4-91 | Item 47: IRI (International Roughness Index) - Coding Requirements for Fields 8, 9, and 10 - Value Text: | Code | Description A | Construction – Roadway was under construction B | Closure – Roadway was closed to traffic C | Disaster – Roadway was located in an area declared as a disaster zone D | Deterioration – Roadway is too deteriorated to measure and is already designated as "Poor" |
Code | Description A | Construction – Roadway was under construction (i.e., not open to traffic due to capital improvement activities) B | Closure – Roadway was closed to traffic (i.e., not open to traffic, and not under construction, impassable due to earthquake damage, etc.) C | Disaster – Roadway was located in an area declared as a disaster zone (e.g., not open to traffic due to being flooded) D | Deterioration – Roadway E | Other – Section added to NHS post-data collection |
||||||||||||||||||||||||
| 4-91 | Item 47: IRI (International Roughness Index) - Coding Requirements for Fields 8, 9, and 10 | Value Date: Report the month and year in MM/YYYY format, excluding leading zeroes) for when the data was collected. A default date may be used if the exact date of collection is unknown. | Value Date: Report the month and year (in MM/YYYY format, excluding leading zeroes) for when the data was collected. A default date may be used if the exact date of collection is unknown. This field should not be populated when the Value Numeric Field has not been populated. | ||||||||||||||||||||||||
| 4-92 | Item 47: IRI (International Roughness Index) - Guidance | - For the sections on the Interstate System, measured IRI shall be: o continuously collected in a manner that will allow for reporting in nominally uniform section lengths of 0.1 mile (528 feet); shorter sections are permitted only at the beginning of a route, end of a route, at bridges, or other locations where a section length of 0.1 mile is not achievable; the maximum length of a section shall not exceed 0.11 mile in length; and |
- For the sections on the Interstate System, measured IRI shall be: o continuously collected in a manner that will allow for reporting in nominally uniform section lengths of 0.1 mile (528 feet); shorter sections are permitted only at the beginning of a route, end of a route, at bridges, or other locations where a section length of 0.1 mile is not achievable (e.g., locations where a change in Surface Type occurs); the maximum length of a section shall not exceed 0.11 mile in length; and |
||||||||||||||||||||||||
| 4-92 | Item 47: IRI (International Roughness Index) - Guidance | - For the sections on the non-Interstate System NHS, measured IRI shall be: o continuously collected in a manner that will allow for reporting in nominally uniform section lengths of 0.1 mile (528 feet); shorter sections are permitted only at the beginning of a route, end of a route, at bridges, or other locations where a section length of 0.1 mile is not achievable; the maximum length of a section shall not exceed 0.11 mile in length; and |
- For the sections on the non-Interstate System NHS, measured IRI shall be: o continuously collected in a manner that will allow for reporting in nominally uniform section lengths of 0.1 mile (528 feet); shorter sections are permitted only at the beginning of a route, end of a route, at bridges, or other locations where a section length of 0.1 mile is not achievable (e.g., locations where a change in Surface Type occurs); the maximum length of a section shall not exceed 0.11 mile in length; and |
||||||||||||||||||||||||
| 4-93 | Item 48: PSR (Present Serviceability Rating) - Extent | NHS, urban minor arterial, major collector, and minor collector Sample Panel sections and rural major collector Sample Panel sections where IRI is not reported. | Value Date: Report the month and year (in MM/YYYY format, excluding leading zeroes) for when the data was collected. A default date may be used if the exact date of collection is unknown. | ||||||||||||||||||||||||
| 4-93 | Item 48: PSR (Present Serviceability Rating) - Coding Requirements for Fields 8, 9, and 10 | Value Date: No entry required. Available for State use. | NHS, and non-NHS urban minor arterial, major collector, and minor collector Sample Panel sections, and rural major collector |
||||||||||||||||||||||||
| 4-94 | Item 48: PSR - Guidance | For the non-NHS sections (i.e., Sample Panel sections located on non-Principal Arterial System (PAS) roadways), PSR can be reported in lieu of IRI. If reported, measured PSR values shall be: | For the non-NHS sections (i.e., |
||||||||||||||||||||||||
| 4-94 | Item 48: PSR - Guidance | o reported for milepoint limits (i.e., sections) that are consistent with those reported for Data Item 47 (IRI); and | |||||||||||||||||||||||||
| 4-97 | Item 49: Surface Type - Guidance | Code 1, Unpaved, on the NHS should be verified since they are very rare except in a couple of States. | Code 1, Unpaved, on the NHS should be verified since these sections are very rare except in a couple of States. Roadway sections where subgrade/subbase of a pavement is exposed and roadway sections that are currently being rehabilitated/reconstructed shall not be coded as "Unpaved". | ||||||||||||||||||||||||
| 4-99 | Item 50: Rutting - Coding Requirements for Fields 8, 9, and 10 - Value Text: | Value_Text: No entry required if the Value_Numeric field has been populated with a newly measured value for a NHS section. If the Value_Numeric has not been populated with a newly measured value, then one of the following codes shall be provided: | Value_Text: |
||||||||||||||||||||||||
| 4-99 | Item 50: Rutting - Coding Requirements for Fields 8, 9, and 10 - Value Text: | Code | Description A | Construction – Roadway was under construction B | Closure – Roadway was closed to traffic C | Disaster – Roadway was located in an area declared as a disaster zone D | Deterioration – Roadway is too deteriorated to measure and is already designated as "Poor" |
Code | Description A | Construction – Roadway was under construction (i.e., not open to traffic due to capital improvement activities) B | Closure – Roadway was closed to traffic (i.e., not open to traffic, and not under construction, impassable due to earthquake damage, etc.) C | Disaster – Roadway was located in an area declared as a disaster zone (e.g., not open to traffic due to being flooded) D | Deterioration – Roadway E | Other – Section added to NHS post-data collection |
||||||||||||||||||||||||
| 4-99 | Item 50: Rutting - Coding Requirements for Fields 8, 9, and 10 | Value Date: Report the month and year (either in MM/YYYY format, excluding leading zeroes) for when the data was collected. A default date may be used if the exact date of collection is unknown. | Value Date: Report the month and year ( |
||||||||||||||||||||||||
| 4-100 | Item 50: Rutting - Guidance | - For the sections on the Interstate System, measured IRI shall be: o continuously collected in a manner that will allow for reporting in nominally uniform section lengths of 0.1 mile (528 feet); shorter sections are permitted only at the beginning of a route, end of a route, at bridges, or other locations where a section length of 0.1 mile is not achievable; the maximum length of a section shall not exceed 0.11 mile in length; and |
- For the sections on the Interstate System, measured IRI shall be: o continuously collected in a manner that will allow for reporting in nominally uniform section lengths of 0.1 mile (528 feet); shorter sections are permitted only at the beginning of a route, end of a route, at bridges, or other locations where a section length of 0.1 mile is not achievable (e.g., locations where a change in Surface Type occurs); the maximum length of a section shall not exceed 0.11 mile in length; and |
||||||||||||||||||||||||
| 4-100 | Item 50: Rutting - Guidance | - For the sections on the non-Interstate System NHS, measured IRI shall be: o continuously collected in a manner that will allow for reporting in nominally uniform section lengths of 0.1 mile (528 feet); shorter sections are permitted only at the beginning of a route, end of a route, at bridges, or other locations where a section length of 0.1 mile is not achievable; the maximum length of a section shall not exceed 0.11 mile in length; and |
- For the sections on the non-Interstate System NHS, measured IRI shall be: o continuously collected in a manner that will allow for reporting in nominally uniform section lengths of 0.1 mile (528 feet); shorter sections are permitted only at the beginning of a route, end of a route, at bridges, or other locations where a section length of 0.1 mile is not achievable (e.g., locations where a change in Surface Type occurs); the maximum length of a section shall not exceed 0.11 mile in length; and |
||||||||||||||||||||||||
| 4-101 | Item 50: Rutting - Guidance | N/A | For the non-NHS sections (i.e., where sample section reporting is required), measured rutting values shall be: - in the rightmost through lane or one consistent lane for all data if the rightmost through lane carries traffic that is not representative of the remainder of the lanes or is not accessible due to closure, excessive congestion, or other events impacting access; - continuously collected in a manner that will allow for reporting in nominally uniform section lengths of 0.1 mile (528 feet); shorter sections are permitted only at the beginning of a route, end of a route, at bridges, or other locations where a section length of 0.1 mile is not achievable (e.g., locations where a change in Surface Type occurs); the maximum length of a section shall not exceed 0.11 mile in length; and - on a biennial frequency (note: data collection shall be performed during a given 2-year duration and must conclude by December 31st of that 2-year duration for reporting purposes). |
||||||||||||||||||||||||
| 4-102 | Item 51: Faulting - Description | Faulting is defined as a vertical misalignment of pavement joints in Portland Cement Concrete Pavements (Jointed Concrete Pavement). Jointed Concrete Pavements is defined as pavements where the top-most surface is constructed of Portland cement concrete with joints (Item 49 codes '3', '4', '9', '10', and '11'). It may be constructed of either reinforced or unreinforced (plain) concrete. | Faulting is defined as a vertical misalignment of pavement joints in Portland Cement Concrete Pavements (Jointed Concrete Pavement). Jointed Concrete Pavements is defined as pavements where the top-most surface is constructed of Portland cement concrete with joints (Item 49 codes '3', '4', '9', and '10' |
||||||||||||||||||||||||
| 4-103 | Item 51: Faulting - Coding Requirements for Fields 8, 9, and 10 - Value Text: | Value_Text: No entry required if the Value_Numeric field has been populated with a newly measured value for a NHS section. If the Value_Numeric has not been populated with a newly measured value, then one of the following codes shall be provided: | Value_Text: |
||||||||||||||||||||||||
| 4-103 | Item 51: Faulting - Coding Requirements for Fields 8, 9, and 10 - Value Text: | Code | Description A | Construction – Roadway was under construction B | Closure – Roadway was closed to traffic C | Disaster – Roadway was located in an area declared as a disaster zone D | Deterioration – Roadway is too deteriorated to measure and is already designated as "Poor" |
Code | Description A | Construction – Roadway was under construction (i.e., not open to traffic due to capital improvement activities) B | Closure – Roadway was closed to traffic (i.e., not open to traffic, and not under construction, impassable due to earthquake damage, etc.) C | Disaster – Roadway was located in an area declared as a disaster zone (e.g., not open to traffic due to being flooded) D | Deterioration – Roadway E | Other – Section added to NHS post-data collection |
||||||||||||||||||||||||
| 4-103 | Item 51: Faulting - Coding Requirements for Fields 8, 9, and 10 | Value Date: Report the month and year (either in MM/YYYY format, excluding leading zeroes) for when the data was collected. A default date may be used if the exact date of collection is unknown. | Value Date: Report the month and year ( |
||||||||||||||||||||||||
| 4-104 | Item 51: Faulting - Guidance | - For the sections on the Interstate System, measured IRI shall be: o continuously collected in a manner that will allow for reporting in nominally uniform section lengths of 0.1 mile (528 feet); shorter sections are permitted only at the beginning of a route, end of a route, at bridges, or other locations where a section length of 0.1 mile is not achievable; the maximum length of a section shall not exceed 0.11 mile in length; and |
- For the sections on the Interstate System, measured IRI shall be: o continuously collected in a manner that will allow for reporting in nominally uniform section lengths of 0.1 mile (528 feet); shorter sections are permitted only at the beginning of a route, end of a route, at bridges, or other locations where a section length of 0.1 mile is not achievable (e.g., locations where a change in Surface Type occurs); the maximum length of a section shall not exceed 0.11 mile in length; and |
||||||||||||||||||||||||
| 4-104 | Item 51: Faulting - Guidance | - For the sections on the non-Interstate System NHS, measured IRI shall be: o continuously collected in a manner that will allow for reporting in nominally uniform section lengths of 0.1 mile (528 feet); shorter sections are permitted only at the beginning of a route, end of a route, at bridges, or other locations where a section length of 0.1 mile is not achievable; the maximum length of a section shall not exceed 0.11 mile in length; and |
- For the sections on the non-Interstate System NHS, measured IRI shall be: o continuously collected in a manner that will allow for reporting in nominally uniform section lengths of 0.1 mile (528 feet); shorter sections are permitted only at the beginning of a route, end of a route, at bridges, or other locations where a section length of 0.1 mile is not achievable (e.g., locations where a change in Surface Type occurs); the maximum length of a section shall not exceed 0.11 mile in length; and |
||||||||||||||||||||||||
| 4-104 | Item 51: Faulting - Guidance | N/A | For the non-NHS sections (i.e., where sample section reporting is required), measured faulting values shall be: - in the rightmost through lane or one consistent lane for all data if the rightmost through lane carries traffic that is not representative of the remainder of the lanes or is not accessible due to closure, excessive congestion, or other events impacting access; - continuously collected in a manner that will allow for reporting in nominally uniform section lengths of 0.1 mile (528 feet); shorter sections are permitted only at the beginning of a route, end of a route, at bridges, or other locations where a section length of 0.1 mile is not achievable (e.g., locations where a change in Surface Type occurs); the maximum length of a section shall not exceed 0.11 mile in length; and - on a biennial frequency (note: data collection shall be performed during a given 2-year duration and must conclude by December 31st of that 2-year duration for reporting purposes). |
||||||||||||||||||||||||
| 4-106 | Item 52: Cracking Percent - Description | For Asphalt pavements (Item 49 codes '2', '6', '7', and '8'), Cracking Percent is the percentage of the total area exhibiting visible fatigue type cracking for all severity levels in the wheelpath in each section. | For Asphalt pavements (Item 49 codes '2', '6', '7', and '8'), Cracking Percent is the percentage of the total area exhibiting visible fatigue type cracking (both longitudinal and/or pattern) for all severity levels in the wheelpath in each section (see Figure 4.78 for an illustration of these cracking scenarios). | ||||||||||||||||||||||||
| 4-106 | Item 52: Cracking Percent - Description | For Jointed Concrete Pavements (Item 49 codes '3', '4', '9', '10', and '11'), Cracking Percent is the percentage of slabs within the section that exhibit transverse cracking. Partial slabs shall contribute to the section that contains the majority of the slab length. | For Jointed Concrete Pavements (Item 49 codes '3', '4', '9', and '10' |
||||||||||||||||||||||||
| 4-107 | Item 52: Cracking Percent - Coding Requirements for Fields 8, 9, and 10 | Value Numeric: Report the percent of total section area for asphalt pavement and CRCP and percent of slabs for Jointed Concrete Pavements to the nearest 1%. Zero (0) values shall only be reported for roadway sections where cracks are not present. | Value Numeric: Report the percent of total section area for asphalt pavement and Continuously Reinforced Concrete Pavement (CRCP), and percent slabs of Jointed Concrete Pavements to the nearest 1%. Zero (0) values shall be reported either for roadways sections where cracks are not present, or roadway sections where recorded values are less than 0.5%. | ||||||||||||||||||||||||
| 4-107 | Item 52: Cracking Percent - Coding Requirements for Fields 8, 9, and 10 - Value Text: | Value_Text: No entry required if the Value_Numeric field has been populated with a newly measured value for a NHS section. If the Value_Numeric has not been populated with a newly measured value, then one of the following codes shall be provided: | Value_Text: |
||||||||||||||||||||||||
| 4-107 | Item 52: Cracking Percent - Coding Requirements for Fields 8, 9, and 10 - Value Text: | Code | Description A | Construction – Roadway was under construction B | Closure – Roadway was closed to traffic C | Disaster – Roadway was located in an area declared as a disaster zone D | Deterioration – Roadway is too deteriorated to measure and is already designated as "Poor" |
Code | Description A | Construction – Roadway was under construction (i.e., not open to traffic due to capital improvement activities) B | Closure – Roadway was closed to traffic (i.e., not open to traffic, and not under construction, impassable due to earthquake damage, etc.) C | Disaster – Roadway was located in an area declared as a disaster zone (e.g., not open to traffic due to being flooded) D | Deterioration – Roadway E | Other – Section added to NHS post-data collection |
||||||||||||||||||||||||
| 4-107 | Item 52: Cracking Percent - Coding Requirements for Fields 8, 9, and 10 | Value Date: Report the month and year (either in MM/YYYY format, excluding leading zeroes) for when the data was collected. A default date may be used if the exact date of collection is unknown. | Value Date: Report the month and year ( |
||||||||||||||||||||||||
| 4-109 | Item 52: Cracking Percent - Guidance | - For the sections on the Interstate System, measured IRI shall be: o continuously collected in a manner that will allow for reporting in nominally uniform section lengths of 0.1 mile (528 feet); shorter sections are permitted only at the beginning of a route, end of a route, at bridges, or other locations where a section length of 0.1 mile is not achievable; the maximum length of a section shall not exceed 0.11 mile in length; and |
- For the sections on the Interstate System, measured IRI shall be: o continuously collected in a manner that will allow for reporting in nominally uniform section lengths of 0.1 mile (528 feet); shorter sections are permitted only at the beginning of a route, end of a route, at bridges, or other locations where a section length of 0.1 mile is not achievable (e.g., locations where a change in Surface Type occurs); the maximum length of a section shall not exceed 0.11 mile in length; and |
||||||||||||||||||||||||
| 4-109 | Item 52: Cracking Percent - Guidance | - For the sections on the non-Interstate System NHS, measured IRI shall be: o continuously collected in a manner that will allow for reporting in nominally uniform section lengths of 0.1 mile (528 feet); shorter sections are permitted only at the beginning of a route, end of a route, at bridges, or other locations where a section length of 0.1 mile is not achievable; the maximum length of a section shall not exceed 0.11 mile in length; and |
- For the sections on the non-Interstate System NHS, measured IRI shall be: o continuously collected in a manner that will allow for reporting in nominally uniform section lengths of 0.1 mile (528 feet); shorter sections are permitted only at the beginning of a route, end of a route, at bridges, or other locations where a section length of 0.1 mile is not achievable (e.g., locations where a change in Surface Type occurs); the maximum length of a section shall not exceed 0.11 mile in length; and |
||||||||||||||||||||||||
| 4-109 | Item 52: Cracking Percent - Guidance | N/A | For the non-NHS sections (i.e., where sample section reporting is required), measured cracking percent values shall be: - in the rightmost through lane or one consistent lane for all data if the rightmost through lane carries traffic that is not representative of the remainder of the lanes or is not accessible due to closure, excessive congestion, or other events impacting access; - continuously collected in a manner that will allow for reporting in nominally uniform section lengths of 0.1 mile (528 feet); shorter sections are permitted only at the beginning of a route, end of a route, at bridges, or other locations where a section length of 0.1 mile is not achievable (e.g., locations where a change in Surface Type occurs); the maximum length of a section shall not exceed 0.11 mile in length; and - on a biennial frequency (note: data collection shall be performed during a given 2-year duration and must conclude by December 31st of that 2-year duration for reporting purposes). |
||||||||||||||||||||||||
| 4-116 | Item 54: Year of Improvement - Guidance | Reporting shall be consistent with IRI inventory direction and lane. 0.5 inch or more of compacted pavement material must be put in place for it to be considered a surface improvement. Completion date is the actual date the construction ended or the date when the project was opened to traffic. Retain the coded improvement year until another improvement affecting the surface is completed. |
Reporting shall be consistent with IRI inventory direction and lane. 0.5 inch or more of compacted pavement material must be put in place for it to be considered a surface improvement. Completion date is the actual date the construction ended or the date when the project was opened to traffic. Retain the coded improvement year until another improvement affecting the surface is completed. This data item shall be coded for resurfacing treatments of at least 0.5 inch that impact the wheelpath/traveled way. For scenarios where only certain lanes have been resurfaced (e.g., 2 out of 3 lanes), this data item should be coded in cases where one of those lanes is the right-most outer lane (or lanes). |
||||||||||||||||||||||||
| 4-117 | Item 55: Year of Last Construction - Guidance | If a new pavement surface were placed without first removing the old pavement surface, the resulting pavement should be considered an overlay (surface improvement, not construction), even if the existing pavement was rubblized prior to placing the new pavement surface. | If a new pavement surface were placed without first removing the old pavement surface, the resulting pavement should be considered an overlay (surface improvement, not construction) |
||||||||||||||||||||||||
| 4-118 | Item 55: Last Overlay Thickness - Guidance | An overlay is more than 0.5 inch. | |||||||||||||||||||||||||
| 4-124 | Item 63: County Code - Extent | All Public highways as Identified in 23 U.S.C 101.a(27). | All |
||||||||||||||||||||||||
| 4-124 | Item 63: County Code - Extent Grid |
|
|
||||||||||||||||||||||||
| 5-8 | Vehicle Classification - Guidance | Data reported in HPMS shall represent data for the reporting year. Prior year classification counts shall be adjusted with annual adjustment factors to represent current year data and to accurately develop percent trucks and truck travel trends. | Data reported in HPMS shall represent data for the |
||||||||||||||||||||||||
| D | Appendix D - Toll Facility Listing | < Multiple Ferry Facility Listings > | |||||||||||||||||||||||||
| D-1 | Appendix D - Toll Facility Listing | Alaska | 1008 | Motor Vessel Susitna | Alaska | 1009 | Hover Craft Suna X | Alaska | 1015 | Motor Vessel Taku | |
Alaska | 1009 | Hover Craft Suna X | Alaska | 1015 | Motor Vessel Taku | |
||||||||||||||||||||||||
| D-2 | Appendix D - Toll Facility Listing | N/A | Colorado | 358 | I-70 Eastbound Mountain Express Lane | * Colorado | 359 | I-25 North to 120th Avenue | |
||||||||||||||||||||||||
| D-3 | Appendix D - Toll Facility Listing | Georgia | 67 | Georgia 400 Extension | | Florida | 361 | Wekiva Parkway | * Florida | 362 | Orchard Pond | * Florida | 363 | Poinciana Parkway | * Georgia | 360 | I-85 Express Lanes, I-285 to Old Peachtree Rd | * |
||||||||||||||||||||||||
| D-4 | Appendix D - Toll Facility Listing | Illinois | 69 | Wabash Memorial Bridge | Illinois | 304 | St. Francisville Bridge - Old Wabash Cannonball Railroad Bridge | Indiana | 68 | New Harmony Bridge | Indiana | 69 | Wabash Memorial Bridge | |
Illinois | 364 | Elgin O'Hare Expressway | * Indiana | 68 | New Harmony Bridge | Indiana | 69 | Wabash Memorial Bridge | Kentucky | 346 | Lincoln & Kennedy Bridges - D'town Crossing | * Kentucky | 347 | Lewis and Clark Bridge | * |
||||||||||||||||||||||||
| D-4 | Appendix D - Toll Facility Listing | Iowa | 71 | Fort Madison Bridge | Iowa | 80 | Bellevue Bridge | Iowa | 81 | Decatur Bridge | Iowa | 82 | Plattsmouth Bridge | |
Iowa | 71 | Fort Madison Bridge | Iowa | 80 | Bellevue Bridge | Iowa | 82 | Plattsmouth Bridge | |
||||||||||||||||||||||||
| D-5 | Appendix D - Toll Facility Listing | N/A | Louisiana | 1127 | Belle Chase Ferry | * Louisiana | 1128 | Pointe-a-LA-Hache Ferry | * Maine | 1129 | Captain E. Frank Thompson | * |
||||||||||||||||||||||||
| D-6 | Appendix D - Toll Facility Listing | Minnesota | 111 | 12th/15th Avenue, N Bridge Minnesota | 113 | MNPass Missouri | 114 | Lake of the Ozark Com Bridge Nebraska | 80 | Bellevue Bridge Nebraska | 82 | Plattsmouth Bridge Nevada | 115 | Valley of Fire Road New Hampshire | 117 | Blue Star Turnpikes New Hampshire | 118 | F. E. Everett Turnpike Minnesota | 112 | International Falls Bridge Minnesota | 113 | MNPass Missouri | 114 | Lake of the Ozark Com Bridge Nebraska | 80 | Bellevue Bridge Nebraska | 81 | Decatur Bridge Nebraska | 82 | Plattsmouth Bridge Nevada | 115 | Valley of Fire Road New Hampshire | 116 | Cheshire Bridge New Hampshire | 117 | Blue Star Turnpikes New Hampshire | 118 | F. E. Everett Turnpike New Hampshire | 119 | Henry Bourque Highway (Route 3) |
Minnesota | 113 | MNPass Missouri | 114 | Lake of the Ozark Com Bridge Nebraska | 80 | Bellevue Bridge Nebraska | 82 | Plattsmouth Bridge Nevada | 115 | Valley of Fire Road New Hampshire | 117 | Blue Star Turnpikes New Hampshire | 118 | F. E. Everett Turnpike Minnesota | 112 | International Falls Bridge Minnesota | 113 | MNPass Missouri | 114 | Lake of the Ozark Com Bridge Nebraska | 80 | Bellevue Bridge Nebraska | 82 | Plattsmouth Bridge Nevada | 115 | Valley of Fire Road New Hampshire | 117 | Blue Star Turnpikes New Hampshire | 118 | F. E. Everett Turnpike |
||||||||||||||||||||||||
| D-10 | Appendix D - Toll Facility Listing | Pennsylvania | 209 | Pennsylvania Turnpike Eastern Extension | Pennsylvania | 211 | Pennsylvania Turnpike Western Extension | Pennsylvania | 213 | Mosey Wood Toll Road | Pennsylvania | 1088 | Fredericktown | |
Pennsylvania | 211 | Pennsylvania Turnpike Western Extension | Pennsylvania | 213 | Mosey Wood Toll Road | Pennsylvania | 367 | I-95 Extension… | * |
||||||||||||||||||||||||
| D-10 | Appendix D - Toll Facility Listing | Pennsylvania | 215 | Beaver Valley Expressway Pennsylvania | 216 | Monavalley Expressway Pennsylvania | 217| Mon-Fayette Expressway |
Pennsylvania | 215 | Beaver Valley Expressway Pennsylvania | 217| Mon-Fayette Expressway |
||||||||||||||||||||||||
| D-11 | Appendix D - Toll Facility Listing | Rhode Island | 333 | Saknonnet River Bridge… | Tennessee | 1094 | Helms | Texas | 227 | Brownsville & Matamoros Express Bridge&M Bridge | Texas | 230 | Weslaco-Progreso International Bridge | Texas | 232 | McAllen-Hidalgo-Reynosa International Bridge | Texas | 235 | Juarez-Lincoln International Bridge | Texas | 236 | Laredo International Bridge (Convent St.) … | Texas | 238 | Laredo-Columbia Solidarity Bridge | Texas | 242 | Presidio Bridge | |
Tennessee | 1094 | Helms | Texas | 305 | Lewisville Lake Bridge | * Texas | 227 | Brownsville & Matamoros Express Bridge Texas | 230 | Texas | 232 | McAllen-Hidalgo Texas | 235 | Juarez-Lincoln International Bridge | Texas | 236 | Texas | 238 | |
||||||||||||||||||||||||
| D-12 | Appendix D - Toll Facility Listing | Texas | 246 | Katy I-10 QuickRide and U.S. 290Managed Lanes | Texas | 248 | Sam Houston Tollway - East | Texas | 249 | Sam Houston Tollway - West | Texas | 250 | Sam Houston Tollway - SW Belt | Texas | 251 | Sam Houston Tollway - SE Belt | Texas | 256 | US 183-A | Texas | 257 | Fort Bend Parkway Extension | Texas | 258 | SH 45 N | Texas | 261 |Toll Loop 49 | Texas | 264 | Central Texas Turnpike | Texas | 266 | Harris County Beltway 8 | Texas | 305 | Lewisville Lake Bridge | Texas | 306 | Donna International Bridge | Texas | 307 | I-635 LBJ Managed Lanes, Dallas/Ft. Worth | Texas | 308 | NTE - (I-820/SH-183 Managed Lanes - Ft. Worth)North Tarrant Express | Texas | 319 | Anzalduas International Bridge | Texas | 330 | Tomillo-Guadalupe International Bridge | Texas | 322 | Sam Houston Tollway - NE | Texas | 324 | SH99 (Grand Parkway) - Segment I-2 | Texas | 325 | SH99 (Grand Parkway) - Segment E | Texas | 326 | SH99 (Grand Parkway) - Segments F-1, F-2, and G | |
Texas | 306 | Donna International Bridge | * Texas | 246 | Katy Texas | 248 | Sam Houston Tollway - Texas | 250 | Sam Houston Tollway - SW Belt | Texas | 251 | Sam Houston Tollway - SE Belt | Texas | 256 | Texas | 257 | Fort Bend Parkway Texas | 258 | SH 45 N | Texas | 261 | Toll Texas | 266 | Harris County Beltway 8 | Texas | 305 | Lewisville Lake Bridge | Texas | 306 | Donna International Bridge | Texas | 307 | Texas | 308 | Texas | 319 | Anzalduas International Bridge | Texas | 330 | Tomillo-Guadalupe International Bridge | Texas | 324 | SH99 (Grand Parkway) - Segment I-2 | Texas | 325 | SH99 (Grand Parkway) - Segment E | Texas | 326 | SH99 (Grand Parkway) - Segments F-1, F-2, and G | |
||||||||||||||||||||||||
| D-12 | Appendix D - Toll Facility Listing | Texas|252|Hardy Toll Road Texas|253|Westpark Tollway Texas|254|President George Bush Turnpike Texas|255|Camino Colombia Texas|256|US 183-A Texas|257|Fort Bend Parkway Extension Texas|258|SH 45 Texas|259|SH 45 SE Texas|260|SH 130 Texas|261|Loop 49 Texas|262|Sam Rayburn Tollway Texas|263|Loop 1 Texas|264|Central Texas Turnpike Texas|266|Harris County Beltway 8 Texas|305|Lewisville Lake Bridge Texas|306|Donna International Bridge Texas|307|I-635 LBJ Managed Lanes, Dallas/Ft. Worth Texas|308|NTE - (I-820/SH 183 Managed Lanes - Ft. Worth) Texas|319|Anzalduas International Texas|320|Tornillo-Guadalupe Texas|321|Chisholm Trail Parkway Texas|322|Sam Huston Tollway- NE Texas|323|DFW Connector Texas|324|SH99 (Grand Parkway) - Segment I-2 Texas|325|SH99 (Grand Parkway) - Segment E Texas|326|SH99 (Grand Parkway) - Segments F-1, F-2, and G Texas|327|SH 130 Seg 5/6 Texas|328|Loop 375 (Cesar Chavez Managed Lanes) Texas|329|Tom Landry Expressway (I-30) Texas|330|SH 550 Texas|331|Manor Expressway - Phase 1 Texas|332|Manor Expressway - Phase 2 Texas|341|IH 45 North (North Freeway) HOV/HOT Lane Texas|342|IH 45 South (Gulf Freeway ) HOV/HOT Lane Texas|343|US 59 (Southwest Freeway) HOV/HOT lane Texas|344|US 59 (Eastex Freeway) HOV/HOT lane Texas|345|US 290 (Northwest Freeway) HOV/HOT lane Texas|1095|Los Ebanos Ferry Utah|267|Express Lanes (Salt Lake City) Utah|268|Adams Avenue Parkway Utah|1096|Charles Hall Vermont|116|Cheshire Bridge Vermont|269|Equinox Sky Line Drive Vermont|270|Mt. Mansfield Toll Road Vermont|271|Burke Mountain Toll Road Virgin Islands|1116|Trans Services - St. John Virginia|91|Harry W. Nice Memorial Bridge |
Texas|252|Hardy Toll Road (Harris County) Texas|253|Westpark Tollway (Harris County) Texas|374|Westpark Tollway (Fort Bend County) Texas|254|President George Bush Turnpike Texas|255|Camino Colombia Texas|256|US 183-A Texas|257|Fort Bend Parkway Extension (Harris County) Texas|375|Fort Bend Parkway (Fort Bend County) Texas|258|SH 45 N Texas|259|SH 45 SE Texas|260|SH 130 Texas|261|Toll 49 Texas|262|Sam Rayburn Tollway Texas|263|Loop 1 Texas|264|Central Texas Turnpike Texas|266|Harris County Beltway 8 Texas|305|Lewisville Lake Bridge Texas|306|Donna International Bridge Texas|307|LBJ TEXpress Lanes Texas|308|TEXpress Lanes Texas|319|Anzalduas International Bridge Texas|320|Tornillo-Guadalupe International Bridge Texas|321|Chisholm Trail Parkway Texas|323|DFW Connector Texas|324|SH99 (Grand Parkway) Texas|327|SH 130 Seg 5/6 Texas|328| Texas|329| Texas 330 I-169/SH 550 Texas 331 Manor Expressway Texas 341 I-45 North (North Freeway HOV/HOT Lane) Texas 342 I-45 South (Gulf Freeway ) HOV/HOT Lane Texas 343 I-69/US 59 (Southwest Freeway) HOV/HOT lane Texas 344 I-69/US 59 (Eastex Freeway) HOV/HOT lane Texas 345 US 290 (Northwest Freeway) HOV/HOT lane Texas 348 SH 249 Tomball Tollway Texas 350 SH 249 Direct Connector Texas 351 IH-30 Tom Landry Freeway: Phase 1 opened 2016. Located in Grand Prairie in Dallas County. IH-30 from w SH 161. Texas|352|LBJ TEXpress Lanes Texas|353|SH 71 Express. Opened Feb 28, 2017. Located in Austin along SH 71 from Ross Rd. to Spirit of TX. Dr. Texas|354|35Express. Expected to open summer 2017. Dallas at I-635 along I-35E to Denton stopping at US 380. Texas|355|Mopac Express Texas|369|SH 45 SW Texas|370|360 Tollway Texas|371|SH 114 TEXpress Lanes Texas|372|SH183 TEXpress Lanes Texas|373|Loop 12 TEXpress Lanes Utah|267|Express Lanes (Salt Lake City) Utah|268|Adams Avenue Parkway Vermont|269|Equinox Sky Line Drive Vermont|270|Mt. Mansfield Toll Road Vermont|271|Burke Mountain Toll Road Virginia|91|Harry W. Nice Memorial Bridge |
||||||||||||||||||||||||
| D-13 | Appendix D - Toll Facility Listing | Texas | 331 | Manor Expressway - Texas | 332 | Manor Expressway - Phase 2 | Texas | 341 | IH 45 North (North Freeway) OV/HOT Lane (Gulf Freeway) | * Vermont | 116 | Cheshire Bridge | |
Texas | 331 | Manor Expressway - Phase 1 | Texas | 341 | IH 45 North Texas | 348 | SH 249 Tomball Tollway | * Texas | 349 | SH 242 Direct Connector | * Texas | 350 | SH249 Direct Connector | * Texas | 351 | IH-30 Tom Landry Freeway: Phase 1 | * Texas | 352 | LBJ East | * Texas | 353 | SH 71 Express | * Texas | 354 | 35 Express | * Texas | 355 | Mopac Express | * |
||||||||||||||||||||||||
| G-2 | Field Format Specifications |
Route_ID Character(60)
Pct_Peak_Single Numeric(2,0)
Pct_Peak_Combination Numeric(2,0)
Rutting Numeric(3,1)
Faulting Numeric(3,1)
Cracking_Percent Numeric(3,1) |
Route_ID Character
Pct_Peak_Single Numeric
Pct_Peak_Combination Numeric
Rutting Numeric
Faulting Numeric
Cracking_Percent Numeric |
||||||||||||||||||||||||
| G-2 | Appendix G | Deleted this appendix in its entirety. |

