|
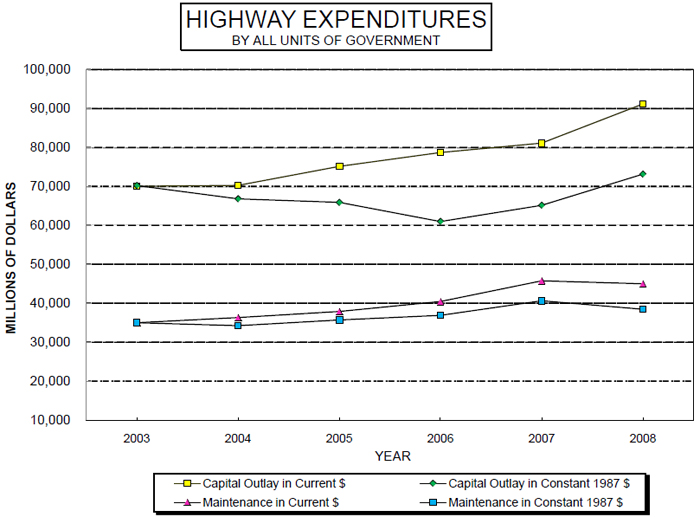
Chart PT-3C
Excel Version (260 kb)
PDF Version (19 kb)
Highway Price Trends and Consumer Price Index
| Index |
2003 |
2004 |
2005 |
2006 |
2007 |
2008 |
| National Highway Construction Cost Index (NHCCI) |
100.0 |
105.2 |
114.1 |
129.0 |
124.5 |
124.6 |
| Consumer Price Index |
100.0 |
106.1 |
106.1 |
109.6 |
112.7 |
117.0 |

| Year |
Federal-Aid Highway Construction Index |
Consumer Price Index-Urban |
Capital Outlay
(Current) |
Index |
Capital Outlay
(Constant) |
Maintenance
(Current) |
Index - 2003 = 100 |
Maintenance
(Constant) |
| 2003 |
70,004 |
0.997 |
70,215 |
35,011 |
1.000 |
35,011 |
| 2004 |
70,274 |
1.052 |
66,800 |
36,327 |
1.061 |
34,225 |
| 2005 |
75,162 |
1.141 |
65,874 |
37,882 |
1.061 |
35,690 |
| 2006 |
78,676 |
1.29 |
60,989 |
40,426 |
1.096 |
36,897 |
| 2007 |
81,098 |
1.245 |
65,139 |
45,759 |
1.127 |
40,616 |
| 2008 |
91,144 |
1.246 |
73,149 |
44,972 |
1.170 |
38,434 |
|