U.S. Department of Transportation
Federal Highway Administration
1200 New Jersey Avenue, SE
Washington, DC 20590
202-366-4000
August 2011
Table MF-202
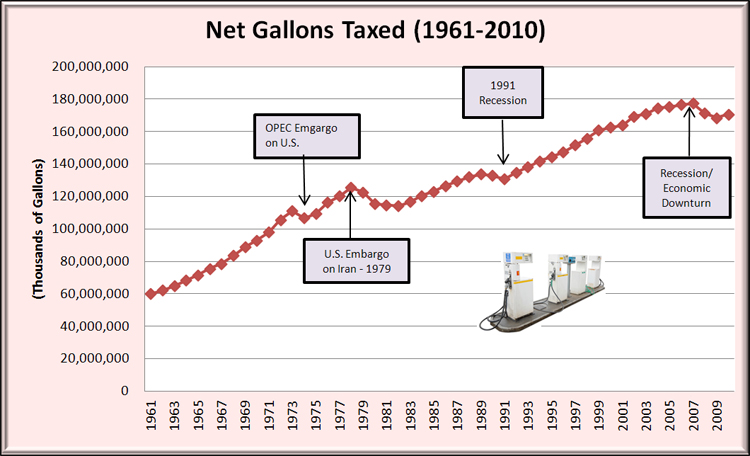
(Thousands of Gallons)
| Year | Gallons (000) |
|---|---|
| 1961 | 60,005,619 |
| 1962 | 62,204,117 |
| 1963 | 64,967,583 |
| 1964 | 68,318,133 |
| 1965 | 71,592,485 |
| 1966 | 75,475,069 |
| 1967 | 78,620,902 |
| 1968 | 83,745,907 |
| 1969 | 88,935,299 |
| 1970 | 92,966,742 |
| 1971 | 98,149,985 |
| 1972 | 105,652,586 |
| 1973 | 111,021,020 |
| 1974 | 106,746,129 |
| 1975 | 109,450,104 |
| 1976 | 116,299,524 |
| 1977 | 120,313,712 |
| 1978 | 125,585,504 |
| 1979 | 122,653,146 |
| 1980 | 115,537,614 |
| 1981 | 114,881,785 |
| 1982 | 114,149,333 |
| 1983 | 116,776,658 |
| 1984 | 120,482,423 |
| 1985 | 123,148,953 |
| 1986 | 126,678,636 |
| 1987 | 129,479,868 |
| 1988 | 131,946,807 |
| 1989 | 133,731,191 |
| 1990 | 132,918,073 |
| 1991 | 130,691,588 |
| 1992 | 134,919,914 |
| 1993 | 138,229,316 |
| 1994 | 141,917,536 |
| 1995 | 144,521,600 |
| 1996 | 147,450,907 |
| 1997 | 151,760,039 |
| 1998 | 155,911,776 |
| 1999 | 160,863,343 |
| 2000 | 162,594,612 |
| 2001 | 164,049,396 |
| 2002 | 169,381,186 |
| 2003 | 170,897,477 |
| 2004 | 174,649,326 |
| 2005 | 175,301,159 |
| 2006 | 176,693,937 |
| 2007 | 177,394,307 |
| 2008 | 171,229,244 |
| 2009 | 168,550,982 |
| 2010 | 170,776,438 |
1/ The data in this table were obtained chiefly from State authorities. Where data were not available, estimates were made by the Federal Highway Administration. The net volume taxed represents the volume of motor fuel which was initially taxed.

