U.S. Department of Transportation
Federal Highway Administration
1200 New Jersey Avenue, SE
Washington, DC 20590
202-366-4000
July 2013
Table MF-201

(Thousands of Dollars)
| YEAR | ADJUSTED NET TOTAL RECEIPTS |
|---|---|
| 1961 | 3,547,749 |
| 1962 | 3,761,299 |
| 1963 | 3,962,868 |
| 1964 | 4,217,495 |
| 1965 | 4,495,236 |
| 1966 | 4,757,636 |
| 1967 | 5,006,739 |
| 1968 | 5,470,199 |
| 1969 | 5,994,343 |
| 1970 | 6,477,019 |
| 1971 | 6,901,204 |
| 1972 | 7,611,498 |
| 1973 | 8,352,556 |
| 1974 | 8,124,158 |
| 1975 | 8,353,191 |
| 1976 | 8,891,460 |
| 1977 | 9,319,297 |
| 1978 | 9,716,246 |
| 1979 | 9,784,273 |
| 1980 | 9,577,740 |
| 1981 | 10,083,810 |
| 1982 | 10,610,419 |
| 1983 | 11,627,177 |
| 1984 | 13,149,742 |
| 1985 | 13,991,805 |
| 1986 | 14,932,258 |
| 1987 | 16,473,496 |
| 1988 | 17,828,521 |
| 1989 | 18,869,419 |
| 1990 | 19,877,713 |
| 1991 | 21,305,467 |
| 1992 | 23,995,000 |
| 1993 | 24,989,864 |
| 1994 | 25,853,471 |
| 1995 | 26,881,169 |
| 1996 | 27,554,989 |
| 1997 | 28,476,881 |
| 1998 | 29,802,864 |
| 1999 | 31,752,790 |
| 2000 | 31,291,017 |
| 2001 | 31,783,843 |
| 2002 | 32,275,459 |
| 2003 | 33,257,334 |
| 2004 | 34,491,295 |
| 2005 | 34,984,939 |
| 2006 | 35,818,306 |
| 2007 | 36,811,361 |
| 2008 | 36,168,970 |
| 2009 | 35,019,410 |
| 2010 | 35,568,433 |
| 2011 1/ | 38,228,430 |
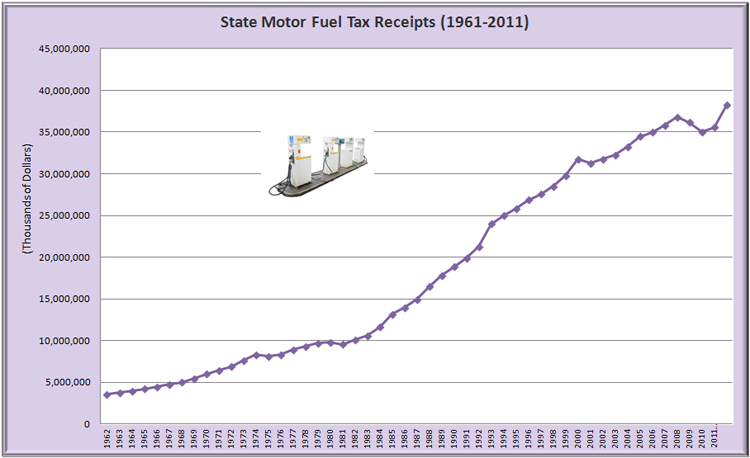
1/ The jump in revenue in 2011 from 2010, is due to the fact that in California, 2009 and 2010 had partial fuel suspensions of six months each. In 2011 all twelve months had fuel taxes in efffect, increasing the revenue in 2011. In addition, the gasohol tax rate (majority of fuel sold in California), went from 35.3 cents in 2010 to 35.7 cents in 2011.