U.S. Department of Transportation
Federal Highway Administration
1200 New Jersey Avenue, SE
Washington, DC 20590
202-366-4000
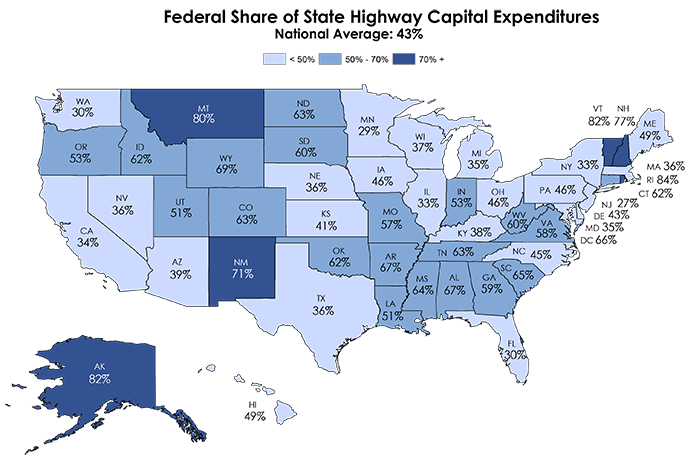
Table HF-202FS
| STATE | 2004 | 2005 | 2006 | 2007 | 2008 | 2009 | 2010 | 2011 | 2012 2/ | 2013 2/ | 10-yr Avg |
|---|---|---|---|---|---|---|---|---|---|---|---|
| Alabama | 63.7% | 53.5% | 60.0% | 67.3% | 71.0% | 60.2% | 78.2% | 80.4% | 64.3% | 75.7% | 67.4% |
| Alaska | 79.0% | 92.3% | 94.5% | 87.5% | 72.6% | 54.9% | 94.9% | 88.7% | 91.8% | 62.9% | 81.9% |
| Arizona | 27.3% | 32.7% | 31.9% | 27.2% | 32.1% | 32.9% | 36.4% | 54.7% | 53.7% | 59.6% | 38.8% |
| Arkansas | 47.0% | 61.0% | 75.8% | 72.0% | 75.3% | 74.5% | 79.6% | 69.0% | 68.9% | 46.4% | 66.9% |
| California | 38.6% | 45.1% | 41.8% | 29.2% | 34.8% | 20.8% | 18.5% | 27.5% | 31.8% | 55.0% | 34.3% |
| Colorado | 32.8% | 35.6% | 48.3% | 78.9% | 54.2% | 85.1% | 69.0% | 98.4% | 54.0% | 73.8% | 63.0% |
| Connecticut | 72.8% | 78.6% | 80.2% | 60.6% | 60.7% | 54.3% | 52.7% | 54.7% | 54.0% | 46.3% | 61.5% |
| Delaware | 35.1% | 27.6% | 29.6% | 33.5% | 52.6% | 53.5% | 48.5% | 61.5% | 43.1% | 48.0% | 43.3% |
| Dist. of Col. | 63.6% | 91.0% | 70.3% | 63.9% | 70.7% | 51.5% | 56.4% | 50.8% | 71.3% | 67.0% | 65.7% |
| Florida | 32.4% | 30.5% | 28.3% | 28.9% | 27.2% | 31.4% | 29.4% | 33.7% | 28.0% | 33.8% | 30.4% |
| Georgia | 53.8% | 54.5% | 48.8% | 51.6% | 39.4% | 45.1% | 61.5% | 89.8% | 73.3% | 69.3% | 58.7% |
| Hawaii | 30.0% | 27.3% | 33.9% | 48.6% | 56.6% | 61.8% | 58.2% | 59.9% | 53.2% | 61.4% | 49.1% |
| Idaho | 65.7% | 59.9% | 67.8% | 66.8% | 48.9% | 58.1% | 73.3% | 65.2% | 54.8% | 63.2% | 62.4% |
| Illinois | 22.3% | 23.9% | 33.1% | 29.6% | 35.1% | 36.7% | 36.5% | 43.7% | 35.8% | 36.8% | 33.4% |
| Indiana | 44.5% | 62.3% | 61.5% | 40.9% | 51.7% | 43.6% | 58.8% | 53.3% | 51.0% | 61.4% | 52.9% |
| Iowa | 41.8% | 39.5% | 35.7% | 42.6% | 48.9% | 48.9% | 49.9% | 57.9% | 44.4% | 45.0% | 45.5% |
| Kansas | 37.5% | 39.7% | 33.2% | 48.2% | 40.5% | 37.2% | 54.7% | 47.4% | 34.4% | 36.6% | 40.9% |
| Kentucky | 36.8% | 45.0% | 47.6% | 38.4% | 35.5% | 29.0% | 38.0% | 38.9% | 36.9% | 37.9% | 38.4% |
| Louisiana | 43.9% | 45.0% | 44.4% | 49.0% | 34.6% | 32.1% | 44.7% | 72.6% | 68.3% | 71.9% | 50.6% |
| Maine | 50.8% | 61.3% | 54.5% | 55.3% | 49.0% | 44.4% | 56.6% | 39.9% | 39.7% | 41.3% | 49.3% |
| Maryland | 42.3% | 31.8% | 49.6% | 40.4% | 30.6% | 26.9% | 27.8% | 27.8% | 39.0% | 34.2% | 35.0% |
| Massachusetts | 40.9% | 44.1% | 37.0% | 30.4% | 30.7% | 50.8% | 32.1% | 31.2% | 31.0% | 30.5% | 35.9% |
| Michigan | 42.3% | 29.1% | 28.9% | 31.4% | 25.4% | 39.1% | 36.5% | 45.1% | 37.1% | 35.9% | 35.1% |
| Minnesota | 22.3% | 23.7% | 21.7% | 29.0% | 38.5% | 31.9% | 36.8% | 32.3% | 31.2% | 25.7% | 29.3% |
| Mississippi | 52.1% | 53.6% | 76.4% | 74.3% | 69.1% | 60.4% | 65.7% | 68.1% | 63.8% | 52.0% | 63.6% |
| Missouri | 54.4% | 54.1% | 44.8% | 46.2% | 50.1% | 45.5% | 60.3% | 88.0% | 58.1% | 66.6% | 56.8% |
| Montana | 76.2% | 70.4% | 79.7% | 83.8% | 75.8% | 78.5% | 87.7% | 81.8% | 84.3% | 82.2% | 80.0% |
| Nebraska | 39.4% | 35.4% | 37.1% | 33.4% | 35.8% | 37.0% | 36.3% | 32.3% | 34.4% | 35.2% | 35.6% |
| Nevada | 21.7% | 30.8% | 31.9% | 39.1% | 36.8% | 32.5% | 44.1% | 42.5% | 43.2% | 42.5% | 36.5% |
| New Hampshire | 129.3% | 136.3% | 70.7% | 64.3% | 65.6% | 66.5% | 61.7% | 55.3% | 55.0% | 61.1% | 76.6% |
| New Jersey | 34.3% | 34.1% | 27.4% | 36.2% | 29.1% | 31.1% | 21.3% | 19.3% | 17.3% | 19.1% | 26.9% |
| New Mexico | 72.8% | 81.3% | 62.8% | 59.2% | 69.1% | 52.3% | 74.3% | 74.3% | 83.3% | 83.0% | 71.2% |
| New York | 30.0% | 31.9% | 28.9% | 33.8% | 27.9% | 37.0% | 43.5% | 32.2% | 31.8% | 35.9% | 33.3% |
| North Carolina | 49.6% | 47.6% | 51.3% | 40.7% | 37.9% | 48.1% | 37.1% | 53.8% | 43.6% | 43.6% | 45.3% |
| North Dakota | 68.2% | 56.5% | 65.4% | 65.3% | 56.8% | 71.0% | 75.0% | 64.0% | 67.0% | 35.6% | 62.5% |
| Ohio | 45.7% | 40.8% | 52.0% | 47.8% | 40.3% | 42.5% | 39.4% | 51.8% | 49.3% | 48.8% | 45.8% |
| Oklahoma | 76.9% | 85.0% | 67.8% | 62.4% | 58.1% | 68.3% | 67.1% | 42.7% | 45.9% | 43.1% | 61.7% |
| Oregon | 37.7% | 39.1% | 47.2% | 53.3% | 56.7% | 58.5% | 58.3% | 69.8% | 56.9% | 55.8% | 53.3% |
| Pennsylvania | 60.5% | 53.2% | 45.4% | 49.8% | 50.1% | 39.4% | 37.8% | 29.0% | 44.9% | 47.5% | 45.8% |
| Rhode Island | 90.8% | 83.5% | 95.3% | 81.3% | 77.8% | 88.2% | 73.6% | 90.6% | 69.1% | 91.7% | 84.2% |
| South Carolina | 85.8% | 78.5% | 83.5% | 70.6% | 61.5% | 53.5% | 52.0% | 57.2% | 59.7% | 50.2% | 65.2% |
| South Dakota | 56.6% | 52.8% | 63.8% | 61.1% | 64.0% | 53.1% | 64.2% | 62.0% | 68.7% | 52.2% | 59.9% |
| Tennessee | 72.6% | 69.0% | 61.0% | 55.1% | 56.2% | 64.3% | 63.1% | 64.5% | 66.3% | 62.1% | 63.4% |
| Texas | 49.6% | 43.3% | 45.3% | 19.3% | 48.8% | 35.6% | 34.9% | 31.9% | 27.0% | 26.8% | 36.2% |
| Utah | 51.7% | 46.9% | 54.5% | 41.1% | 53.7% | 50.4% | 43.3% | 31.2% | 51.0% | 83.9% | 50.8% |
| Vermont | 78.3% | 73.0% | 72.2% | 79.8% | 77.5% | 85.2% | 78.3% | 76.3% | 92.8% | 102.4% | 81.6% |
| Virginia | 47.3% | 46.9% | 50.1% | 48.6% | 55.3% | 51.9% | 66.9% | 71.9% | 69.9% | 73.3% | 58.2% |
| Washington | 30.8% | 29.1% | 33.5% | 34.2% | 38.2% | 32.0% | 32.8% | 26.9% | 22.7% | 22.0% | 30.2% |
| West Virginia | 60.8% | 57.0% | 60.3% | 61.5% | 50.2% | 56.8% | 66.5% | 65.0% | 58.1% | 62.6% | 59.9% |
| Wisconsin | 33.7% | 31.2% | 32.2% | 35.9% | 34.4% | 41.9% | 46.1% | 47.8% | 35.4% | 26.6% | 36.5% |
| Wyoming | 102.5% | 85.7% | 78.2% | 69.7% | 51.0% | 63.0% | 68.3% | 58.5% | 59.9% | 57.5% | 69.4% |
| Total | 42.8% | 44.9% | 44.0% | 38.7% | 41.6% | 41.9% | 44.4% | 45.3% | 43.1% | 45.1% | 43.2% |
1/ Source: FHWA Highway Statistics, 10-year average 2004-2013, Table HF-2 and unpublished Table FA-21. The percent is the ratio of reimbursements to states for capital outlays to total expenditures for capital outlays.
2/ Includes estimates of local data.

