U.S. Department of Transportation
Federal Highway Administration
1200 New Jersey Avenue, SE
Washington, DC 20590
202-366-4000
Federal Highway Administration Research and Technology
Coordinating, Developing, and Delivering Highway Transportation Innovations
| REPORT |
| This report is an archived publication and may contain dated technical, contact, and link information |
|
| Publication Number: FHWA-HRT-14-023 Date: May 2014 |
Publication Number: FHWA-HRT-14-023 Date: May 2014 |
After the cable mockup was built, a long series of cyclic corrosion tests were planned to test the sensors that were part of the proposed corrosion monitoring system. These tests consisted of subjecting the cable specimen to cycles of rain, heat, and cooling of different duration; each experiment lasted for days, and at the end of each test, measurement data were analyzed, and changes of the test conditions were made if necessary,. The total duration of this experimental phase lasted approximately 1 year.
Of the total 72 sensors initially installed in the cable, only 50 sensors provided data worthy of analysis (see figure 80 ). Those sensors measured temperature, relative humidity, and corrosion rate. Being distributed across the cross section of the cable, they provided an experimental image of the distributions of temperature, relative humidity, and corrosion activity within the cable. The sensors were hard wired, and the electrical wires were run out of the cable center and connected to a DAQ.
The sensor numbering displayed corresponded to the numbering used during data collection. A total of 17 Precon HS2000V temperature/relative humidity sensors (labeled "T" in figure 80 to represent temperature; referred to as "RH" to represent relative humidity) were evenly distributed according to depth and angle of incline. Sensor T6 was discarded from use (not referenced in figure 80) because of early installation malfunctions, while sensors T7 and T18 had some malfunctioning problems during the early tests. Both temperature and relative humidity data was collected at 300-s intervals for the duration of each test.
Eight LPR sensors (labeled "LP" in figure 80) were distributed in the upper half of the mockup cable specimen's cross section. Four sensors were placed along the upper vertical radius, while two were placed on each of the radii oriented at ±60° (see figure 3). A complete cross sectional distribution of corrosion rate sensors was desirable; however, laboratory construction operation forced the placement of LPR sensors to the upper half of the cable's cross section. LPR sensors collected corrosion rate data every 60 s.
Four CMAS sensors (one CMAS CS and one zinc sensor (CMAS Zn)) were present: one each at the top of the cable and one each at the bottom of the cable, recording corrosion rate every 300 s.
The remaining 22 sensors (not displayed in figure 80) measured pH and corrosion rate levels (using different methods). However, their measurements were erratic and considered unreliable and consequently discarded.
Cyclic Corrosion Testing Chamber
In the environmental chamber built around the cable specimen, moisture was introduced into the system via water pumps and elevated punctured PVC piping so to simulate rainfall. A 300 ppm sodium chloride solution was used to enhance corrosion activity. Midway through the test program at points approximately 3.94 ft (1.2 m) from either end of the cable mockup, four holes were placed in the cable wrapping. Two 11.89-by-11.89-inch (30.5-by-30.5-cm) openings were made in the underside of the wrapping and at a location on the topside of the cable. At 3.94 ft (1.2 m) from the jacking end, two 0.99-by-0.99-inch (2.54-by-2.54-cm) openings were made to facilitate the influx of moisture to the inside of the cable mockup. Temperature increases were controlled with heat lamps located at the top of the chamber with a cut-off temperature of 125 °F (51.67 °C), while an air conditioning unit promoted temperature stabilization and rapid chamber/cable cooling. A ventilation system allowed for increased control of the relative humidity level within the chamber environment.
The cable mockup specimen was exposed to a variety of cyclic environmental conditions consisting of different combinations of rain, heat, air conditioning, and ambient conditions. These tests provided results that were representative of all the other tests and contained all the important characteristics to understand the environmental conditions inside the cable mockup. The composition and duration of such tests is presented in table 13.
Table 13 . Environmental chamber cyclic corrosion test descriptions.
Test Composition/Duration |
Test 1 |
Test 2 |
Test 3 |
Test 4 |
|
|---|---|---|---|---|---|
Total cycle length (h) |
4 |
6 |
6 |
4 |
|
Cycle phase |
Rain (h) |
0.5 |
1 |
1 |
1 |
Heat (h) |
1 |
3 |
3 |
1 |
|
Heat-air condit. (h) |
1 |
- |
- |
1 |
|
Air conditioning (h) |
1.5 |
- |
- |
1 |
|
Ambient (h) |
- |
2 |
2 |
- |
|
Ventilation |
Open |
Closed |
Open |
Closed |
|
Cable |
None |
4 |
4 |
4 |
|
- Indicates there was no such phase.
EXPERIMENTAL RESULTS/DISCUSSIONS
Temperature and Relative Humidity Sensors
In this section, general temperature and relative humidity trends are discussed using the measurements from test 1. This test was chosen because a Precon HS2000V sensor (AT2) was placed inside the chamber, making it possible to relate the chamber environment to the environment within the cable specimen. Additionally, from the measurements, relative humidity levels within the cable varied significantly, allowing for a better understanding of the relative humidity distributions across the cable's cross section. Finally, since initial temperature levels were recorded at approximately room temperature throughout the cross section, it was possible to clearly highlight the effects that the proximity to the heat source and the cable surface had on the temperature distribution inside the cable specimen.
In the data analysis, initial data recordings were smoothed using a local regression scheme with weighted linear least squares and a second-degree polynomial model in which outlier data points received a lower weighting than others. Once smoothed, cyclic maxima and minima were identified, and temperature gradients were found for different locations within the cable cross section. Gradients were compared to highlight the effects of distance from the heat source and of the atmospheric conditions on temperature variation within the cable.
With regard to the distribution of the temperature inside the cable, particular attention was given to the analysis of the temperature distribution inside the upper part of the cable (closer to the heat source). However, similar conclusions can be drawn for the lower portion of the cable. Due to significant differences in temperature values and variations, the analysis of the upper section was subdivided based on three levels (inner, middle and outer) of the sensor distance from the center of the cable's cross section. Following the notation in figure 80, in the upper portion of the cable cross section, the inner level consists of sensors T12, T4, and T13, while the middle and outer levels consist of sensors T11 and T14 and T5 and T15, respectively (the temperature component of sensor 10 did not function). For the lower portion of the cable's cross section, the inner, middle, and outer levels consisted of sensors T9, T16, and T2; T8 and T17; and T1, respectively (sensors T7 and T18 did not function following installation).
Figure 86 clearly shows the temperature pattern inside the chamber. After an initial drop associated with the 30 min of rain, there was a constant increase of temperature in correspondence to the heat phase of the cycle, after which the temperature stabilized around a value of approximately 105 to 110 °F (40.56 to 43.33 °C). Such a temperature remains approximately constant until the heating lamps are shut off and the air conditioning only phase starts. This induces a cooling of the air inside the chamber and a corresponding decrease in temperature. In general, only minor increases of chamber temperature minima were recorded with each cycle in the tests progression.
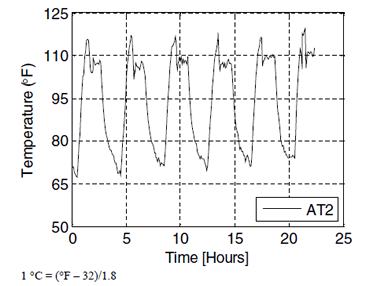
Figure 86. Graph. Test 1 AT2 chamber temperature recordings
As far as the temperature distribution inside the cable, sensor T3, which was centrally located within the cable's cross section, was taken as the baseline, and its recordings are shown in figure 87 through figure 89 for comparative purposes. It recorded temperature values between 72 and 85 °F (22.22 and 29.44 °C), showing no distinct cyclic minima and maxima. Although slight fluctuations appear, a linear regression analysis provided an R2 value of 0.9606 for the temperature increases recorded by T3 (see figure 87), stating that the temperature at the cable center appears to monotonically increase with a rate of approximately 1°F/h (0.56 °C/h).
As expected, the greatest temperature increases and fluctuations were recorded in the outer level of the cable's upper section (T5 and T15 (see figure 88 and figure 89)) because of the proximity of the sensors to the heat sources. Sensor T5, which was the closest to the heat lamp, shows sharper cycles than T15. Similar temperature cyclic variations were recorded by the middle and inner layer sensors (T11, T14, T12, T4, and T13 in figure 87 through figure 89) even though the range of such fluctuations decreased when moving toward the center of the cable. The measurements confirm that the left part of the cable shows a temperature distribution that is the mirror image of the temperature distribution in the right half, as expected because of the position of the heat lamps. At the inner level, temperature minima were recorded approximately 20 min after those recorded in the chamber. The time interval between minimum and maximum temperature at the inner level is the same as those recorded at both the middle and outer levels; however, there is a time lag of 10 to 15 min between these minimum and maximum temperatures and the corresponding temperatures at the other outer levels. This lag is a result of the thermal diffusivity properties of the cable.
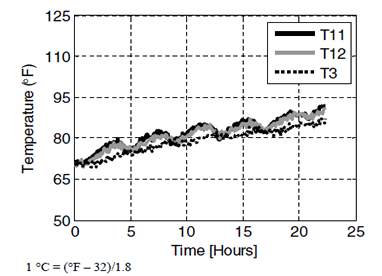
Figure 87. Graph. Test 1 upper cable temperature distributions along diameter at -60º
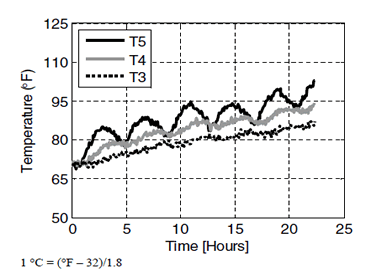
Figure 88. Graph. Test 1 upper cable temperature distributions along diameter at 0º
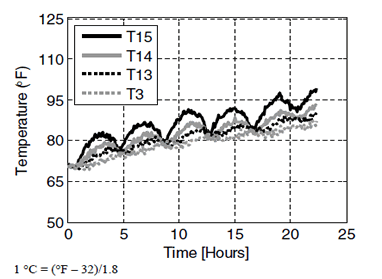
Figure 89. Graph. Test 1 upper cable temperature distributions along diameter at 60º
From these measurements, it can be concluded that with greater distance from the heat source, the temperature variations within the cable's cross section diminished with respect to the outside temperature. Maximum temperatures within the cable did not reach levels as high as those recorded in the chamber, and temperature fluctuations decreased with increased distance from the heat source. The upper outer region showed substantial temperature fluctuations, whereas near monotonic increases in temperature occurred in the center of the cable. Average temperature gradients found during the heating phase of each cycle prove that the cable heated evenly with maximum heating rates obtained at central vertical locations. Last, the time to which the cable interior was affected by temperature fluctuations increased with greater cable depth.
The interpretation of the relative humidity data is much more complex because while the temperature data lend itself to a collective analysis, general trends are not as identifiable in the relative humidity data. This is because water can penetrate inside the cable from many different locations and can find many different paths to spread in between the many wires and reach the sensors at different times. However, some general trends can still be found and provide useful information on the functioning of certain sensors. In figure 90, the recordings of the Precon sensor labeled "ARH2" are presented and display the effects of the various phases of the cycle on the relative humidity levels within the testing chamber. Starting from an average level of 55 percent relative humidity in the chamber, the onset of the rain phase caused the chamber relative humidity to increase from 55 to 99 percent. After the rain phase was over, ARH2 recorded relative humidity values of approximately 15 to 20 percent during the heat and heat plus air conditioning phases and increased to the initial 55 percent value at the end of the cycle. This type of fluctuation was as expected and showed the good functioning of the sensor placed in the environmental chamber.
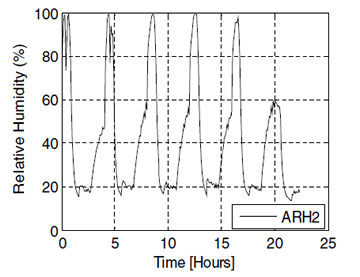
Figure 90. Graph. Test 1 Precon HS2000V ARH2 chamber relative humidity recordings
As in the temperature analysis, the relative humidity recordings of Precon sensor 3 (RH3), referring to the center of the cable, was used for comparative purposes. The sensor recorded initial relative humidity levels of 40 percent, while the reading within the chamber was at 55 percent. Over the course of testing, despite the external fluctuations in relative humidity levels, the center of the mockup cable experienced an approximate cyclic decline in relative humidity of 2 percent. A linear regression analysis returned an R2 value of 0.9701, suggesting a nearly linear decline of the relative humidity in the cable center. This is consistent with the linear increase of the temperature at the center, as shown in figure 87 through figure 89.
Sensors within the outer level (RH10, RH5, and RH15) of the upper portion of the cable mockup specimen recorded substantial variations in relative humidity levels (see figure 91 through figure 93). RH10 recorded the highest initial relative humidity levels at 88 percent (see figure 91). This occurred due to three possibilities: some local trapped water, the sensor was near complete saturation, and/or a possible sensor malfunction (the temperature component of sensor 10 (T10) was not functioning, thus the relative humidity readings may also have been inaccurate).
Inner sensors located on the diagonals in the upper section of the cable's cross section (RH12 and RH13) recorded near steady declines over the course of test. This agrees with the fact that the internal temperature of the cable steadily increased.
In general, the relative humidity levels varied significantly across the mockup cable cross section, especially in the outer layers. As previously mentioned, this was expected because of the different ways water infiltrates inside the cable. Sensors located closer to the cable surface (e.g., RH15 and RH10) recorded elevated relative humidity levels, while those closer to the cable center recorded substantially lower levels. Additionally, close to the cable's core, sensors recorded near linear monotonic decreases in relative humidity of approximately 2 percent per cycle corresponding to nearly linear increases in temperature of approximately 5 °F (-15 °C) . Conversely, over the course of testing, sensors closer to the surface displayed greater cyclic fluctuations.
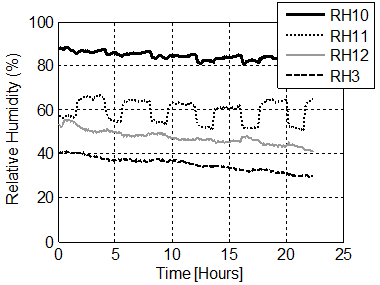
Figure 91. Graph. Test 1 upper cable relative humidity distributions along diameter at -60º
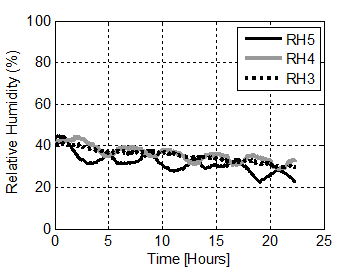
Figure 92. Graph. Test 1 upper cable relative humidity distributions along diameter at 0º
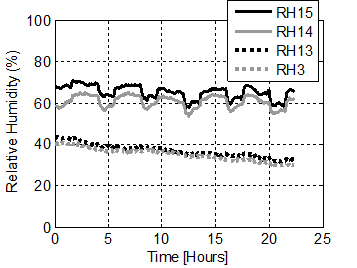
Figure 93. Graph. Test 1 upper cable relative humidity distributions along diameter at 60º
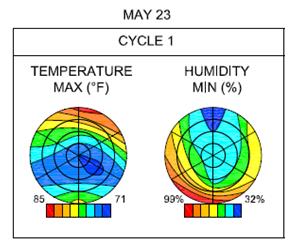
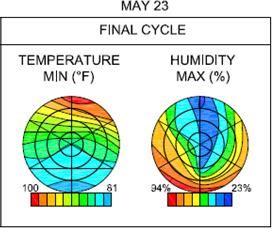
Figure 94 and figure 95 provide a visual mapping of the variation of the maximum and minimum temperatures and relative humidity over the entire cable's cross section.
1 °C = (°F - 32)/1.8
Figure 94. Illustration. Mapping of maximum and minimum temperature and relative
humidity distribution during cycle 1 over the entire cable's cross section
1 °C = (°F - 32)/1.8
Figure 95. Illustration. Mapping of maximum and minimum temperature and relative
humidity distribution during the final cycle over the entire cable's cross section
Although increased levels of relative humidity seem to correspond well with increased distances from the cable core (i.e., closer proximity to the cable surface), levels of cyclic relative humidity fluctuations do not. This could be linked to the different infiltration paths, especially in the outer layers. In general, relative humidity sensors recorded increased levels 1.5 h after the onset of cyclic rain phases.
The role of temperature and sensor saturation must be considered, as areas of the cable may be prone to collect or expunge water, resulting in inexplicable levels and fluctuations of relative humidity. Many sensors recorded prolonged periods of elevated relative humidity, suggesting that water introduced into the cable during the rain phase could not evaporate during the cyclic heat phases. The entrapment of moisture within the mockup cable represents a serious problem in the deterioration of suspension bridge main cables. Specifically, the inability for evaporation to occur results in an aggressive environment in which corrosion may occur at elevated rates, and sensing technology may be negatively affected.
This conclusion is further bolstered by a consideration of the RH5 sensor recordings. Relative humidity levels recorded by RH5 peaked with the onset of the rain phase. Peak levels proceeded to decline during the heat phase, eventually increasing with the onset of air-conditioning. The lowering of relative humidity with increased temperature was expected, as increasing temperature promotes the evaporation of the water molecules from the electrode surface. The position of sensor 5 at the top of the cable and its proximity to the cable surface may allow for the excess water/moisture to both drain and/or evaporate from the sensor surface. Furthermore, condensation and an increase of relative humidity with decreasing temperature were both expected and seen in the recordings of sensor 5 during test 1. The distribution of the relative humidity recorded by the sensors over the cross section further validates the 2004 findings of Suzumura and Nakamura in which decreased levels of relative humidity were identified in the upper portion while higher levels of relative humidity were found in the sides and lower portion of the cross section.(18)
Temperature and relative humidity recordings from this test confirm the expectation of an inversely proportional relationship between these two environmental variables. A statistical analysis of the temperature and relative humidity levels recorded by sensors 3, 5, 12, and 13 returned correlation coefficient values of less than -0.95, showing an extremely strong inversely linear relationship between the respective temperature and relative humidity recordings. Unfortunately, due to the potential presence of pockets of water, moisture, and sensor saturation, not all correlations were as strong. Thus, relative humidity levels cannot be strictly explained with temperature recordings; rather, they must be considered individually.
Corrosion Rate Sensors: LPR Sensors
Of the eight LPR sensors placed in the cable, only LPR3 and LPR4 recorded corrosion rates above noise values. The analysis of the corrosion rate sensors was twofold. Corrosion rate recordings from each sensor were compared and related to local temperature and relative humidity recordings as well as other corrosion rate sensor recordings. The effect of both the environmental conditions and the location within the cable cross section on corrosion was addressed by considering the correlation between atmospheric variables and corrosion rate fluctuation. For a better understanding of the interaction between temperature/relative humidity and corrosion rate, the recordings of LPR3 and LPR4 are presented against RH13 (figure 96), T13 (figure 97), RH15 (figure 98), and T15 (figure 99) for tests 1 and 3 (table 13). These tests were selected because while temperature ranges were similar, the relative humidity values differed enough between tests to permit an analysis of the effects of both environmental variables. Corrosion rate values recorded by LPR sensors appeared to follow distinct cyclic trends associated with temperature, while initial rate levels were affected by relative humidity.
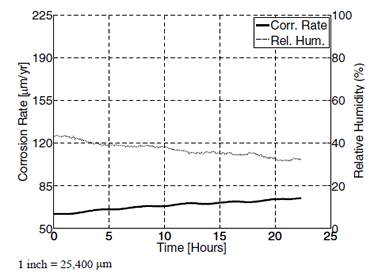
Figure 96. Graph. Test 1 LPR3 versus RH13
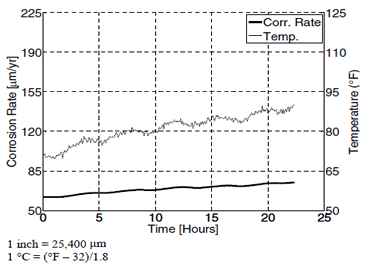
Figure 97. Graph. Test 1 LPR3 versus T13
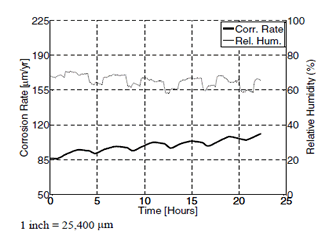
Figure 98. Graph. Test 1 LPR4 versus RH15
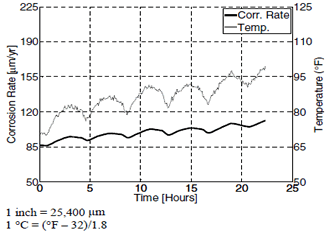
Figure 99. Graph. Test 1 LPR4 versus T15
A statistical analysis of the data presented in figure 96 and figure 97 revealed that in test 1, the LPR3 recordings had strong linear (positive and negative) relationships with temperature and relative humidity levels, respectively. A correlation coefficient of 0.9855 existed between the data recorded for LPR3 and T13, while a correlation coefficient of -0.9844 existed between the recordings for LPR3 and RH13.
Conversely, for the correlation between LPR4 and RH15, it was found that the correlation coefficient dropped to -0.3192, losing the inverse proportionality seen in LPR3 and RH13. With regard to the T15 temperatures, the correlation coefficient for the LPR4 data was 0.9841, thus confirming the strong linear relationship between corrosion rate and temperature readings. For each ±1.5 °F (0.83 °C) increase in temperature, there was a ±3.93 x 10⁻⁵ inch/year (1 µm/year) increase in corrosion rate. Comparing the measurements from RH13 and RH15, a difference in relative humidity levels of 25 percent appears to have induced an increase in baseline corrosion rates of 0.00094 inch/year (24 µm/year) between LPR3 and LPR4. For the overall test, temperature increases of 23 °F (-5 °C) recorded by T13 led to increases in corrosion rate recordings by LPR3 of 0.00047 inch/year (12 µm/year), whereas temperature increases recorded by T15 of approximately 30 °F (-1.11 °C) resulted in corrosion rate increases of 0.00094 inch/year (24 µm/year) by LPR4, maintaining almost identical increase and decrease rates within cycles. Similar conclusions were reached in test 3, with a strong linear relationship between corrosion rate and temperature (correlation coefficients of 0.9899 for LPR3 and 0.9928 for LPR4), respectively. As seen in test 1, the test 3 corrosion rate fluctuations did not strongly relate to relative humidity fluctuations.
From the analysis of the recorded data, it appears that relative humidity controls the overall (average) levels of corrosion rate fluctuations, while temperature changes affect the more localized and cyclic corrosion rates. The effects of relative humidity were shown in the readings of LPR3 and RH13 compared to those of LPR4 and RH15. At increased levels of relative humidity (test 3), a shift in temperature of approximately 1 °F (0.56 °C) resulted in a shift of approximately 3.93 x 10⁻⁵ inch/year (1 µm/year) in corrosion rate. At lower humidity levels, the ratio changes as a 1 °F (0.56 °C) shift in temperature led to a shift in corrosion rate that is less than 3.93 x 10⁻⁵ inch/year (1 µm/year) (test 1). Thus, depending on the relative humidity levels and the corresponding initial corrosion rates, it may be possible to determine a proportionality constant between temperature and corrosion rate and use temperature data to predict and verify corrosion rates within the mockup cable's cross section.
Corrosion Rate Sensors: CMAS Sensors
Corrosion rate readings from the CMAS CS sensors were analyzed in conjunction with temperature and relative humidity levels as recorded by T5. In similar fashion to the LPR analysis, the CMAS sensor analysis identified cyclic fluctuations in corrosion rate readings as well as the fluctuations of the surrounding environmental variables. The sensors being considered were located at the top of the cable cross section 0° from the vertical axis (MC2 and T5 in figure 80). Because of different characteristics, measured corrosion rates are presented for two different conditions: for relative humidity below 50 percent (test 4 in figure 100 and figure 101) and between 80 and 90 percent (test 2 in figure 102 and figure 103).
When humidity levels were consistently below 50 percent (see figure 100) and the temperature varied between 70 and 110 °F (21.11 and 43.33 °C) (see figure 101), the CMAS CS sensors recorded low yet viable corrosion rates. However, the overall level of relative humidity within the cable was sufficiently low so as to not induce much corrosion activity. Only at times when the relative humidity showed some non-negligible gradients did the CMAS CS sensor record slight activity.
The introduction of two openings on the top and two openings on the bottom in the wrapping of the mockup cable specimen as well as closing the chamber ventilation resulted in a substantial increase of relative humidity both within the chamber and within the cable (80 to 90 percent) at 92 to 119 °F (33.33 to 48.33 °C), respectively (see figure 102 and figure 103). The corrosion rate measurements showed a similar pattern as those from the previous test, but the values are much higher: an average value of 0.00098 inch/year (25 µm/year) in the stable part of the test versus a value below 0.00015 inch/year (4 µm/year) in the previous test.
From the analysis of these results, it can be concluded that the CMAS corrosion rate sensors showed a similar performance as the LPR sensors. Increases in chamber relative humidity levels led to general increases in CS corrosion rate values.
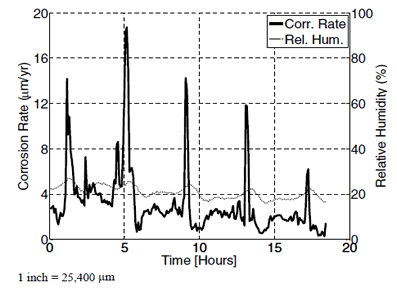
Figure 100. Graph. Test 4 CMAS CS with sensor 5 readings for relative humidity
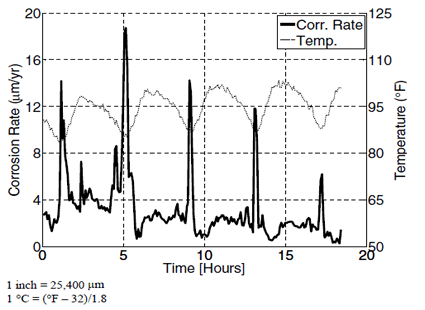
Figure 101. Graph. Test 4 CMAS CS with sensor 5 readings for temperature
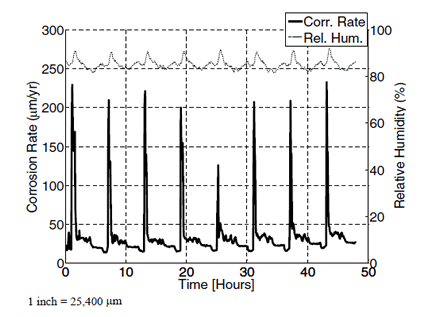
Figure 102. Graph. Test 2 CMAS CS with sensor 5 readings for relative humidity
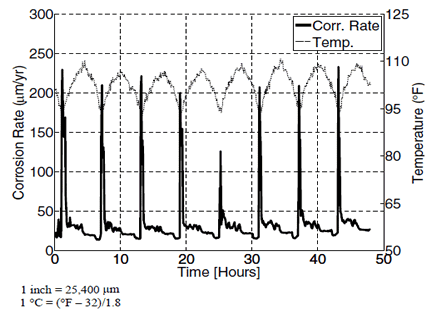
Figure 103. Graph. Test 2 CMAS CS with sensor 5 readings for temperature
With relative humidity levels of 80 to 90 percent, both CS corrosion rate peaks and baseline values increased by approximately 15 to 20 times those recorded at low levels of relative humidity (< 50 percent). At high levels of relative humidity (> 80 percent), temperature effects were more pronounced and identifiable. Increases in corrosion rate minimum values from one cycle to the next for test 2 revealed that relative humidity levels affected the baseline values of CS corrosion rates. Temperature shifts, however, contributed to minor shifts in corrosion rates both cyclically and over the total course of testing. High levels of relative humidity created the aqueous environment to cause the onset of CS corrosion, while elevated temperatures increased the kinetics of the chemical reactions and the corresponding corrosion rates.
The large decreases in corrosion rate of 0.0063 to 0.0075 inch/year (160 to 190 µm/year) during test 2 corresponding to minor relative humidity drops of 4 to 6 percent are inexplicable. Extremely elevated levels of corrosion activity may be misleading. Due to the proximity of the CMAS CS sensor to the cable surface, it is possible that with the presence of water in the cable (due to holes in the cable wrapping), the sensor became saturated at points corresponding to peak values.
The other sensors considered in this testing phase did not show the same sensitivity as the LPR and CMAS sensors. The recorded measurements were consistently below the noise threshold in any of the tests conducted. This could be due to either a reduced sensitivity of the sensor or to the lack of corrosion activity in the proximity of the sensor itself. However, as seen in the next section, extensive water penetration and salt deposition occurred inside the cable, which should have activated some of the sensors.
As an example, the BM corrosion sensors recorded some activity, but the levels of the measured corrosion rate were well below those recorded by other corrosion rate sensors. Figure 104 shows the measurements of the corrosion rate recorded by sensor BM5, which is in the proximity of the T4 and RH4. Even with high temperature levels (between 70 and 100 °F (21.11 and 37.78 °C)) and relative humidity (between 86 and 92 percent), the recorded corrosion rates for CS and zinc were low (1.97 x 10⁻⁵ to 0.00014 inch/year (0.5 to 3.5 µm/year) for steel and 3.93 x 10⁻⁵ to 0.00027 inch/year (1 to 7 µm/year) for the zinc). Also these BM sensors showed a clear dependence of the corrosion rate with the temperature; at high relative humidity levels (between 87 and 92 percent), the corrosion rate measurements for both the CS and zinc presents a strong correlation with the temperature (see figure 104).
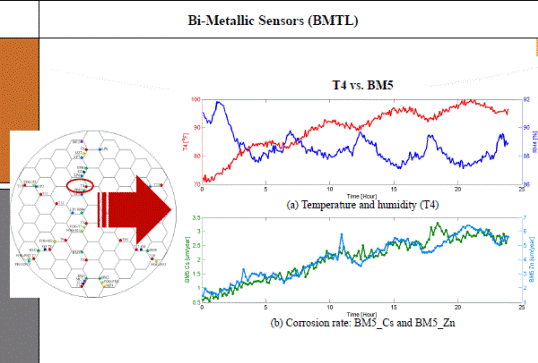
Figure 104. Illustration. Test 2 corrosion rate for CS and zinc obtained by sensor BM5 in
test 2
The laboratory testing phase of this project served to test a set of selected sensors in a cable specimen that closely resemble real-life conditions. The construction of an environmental testing chamber permitted the testing of various environments affecting the temperature, relative humidity, and corrosion rate distributions within the mockup cable. As compared with the external chamber environment, cyclic environmental fluctuations were reflected in outer sensor recordings of temperature and relative humidity, while sensors in the core of the cable recorded near constant increases in temperature and decreases in relative humidity. Temperature levels and fluctuations proved to vary according to depth within the cable.
Although they did not follow consistent trends across the cable's cross section, relative humidity values were strong indicators of corrosion rate levels, as validated by those recorded by LPR, CMAS, and BM corrosion rate sensors.
Increased levels of relative humidity resulted in increased levels of corrosion activity recorded by both types of sensors. Furthermore, statistical analyses showed that the experimental dependence of corrosion rate values, as recorded by LPR sensors, on temperature was strongly linear. In addition, while temperature values varied with cable depth and followed distinct trends in cyclic fluctuations, relative humidity did not.
While the LPR, CMAS, and BM sensors showed good sensitivity in measuring corrosion activities inside the cable, other sensors did not record values beyond the noise threshold. Fiber-optic sensors did not show any reliable measurement data, with most of them broken during operation. This information was then used in preparing the sensor system that was installed on the main cable of the Manhattan Bridge.
Testing the AE System for the Detection of Wire Breaks in the Interior of the Cable
Having a full-scale mockup of a main cable of a suspension bridge with prenotched wires in the interior allowed for the possibility to test and tune the AE system to detect wire breaks occurring in the interior of the cable. By pulling interior wires that were originally notched at specific locations along the cable's length until they failed, it allowed for the opportunity to record the signal signature of an interior wire breaks in a lab environment (without any unexpected environmental interferences) and to test the sensitivity of such an AE system in detecting this type of wire failure.
In order to accomplish this objective, two different types of AE sensors were mounted on the mockup cable: eight AE sensors R0.45I (4.5 kHz) and eight AE sensors R1.5I (15 kHz) were installed on the two cable bands at the ends of the cable specimen (see table 14). Data were collected using the PAC 16-channel sensor highway II installed as part of the permanent equipment designed for monitoring and control of the environmental chamber of the cable mockup. The sensor locations on the cable bands of the mockup are shown in figure 105.
Table 14. Positions and types of AE sensors.
Channel Number |
Type of Sensor |
Position |
|---|---|---|
1, 4, 5, and 8 |
R1.5I |
South end |
2, 3, 6, and 7 |
R0.45I |
South end |
9, 12, 13, and 15 |
R1.5I |
North end |
10, 11, 16, and 14 |
R0.45I |
North end |
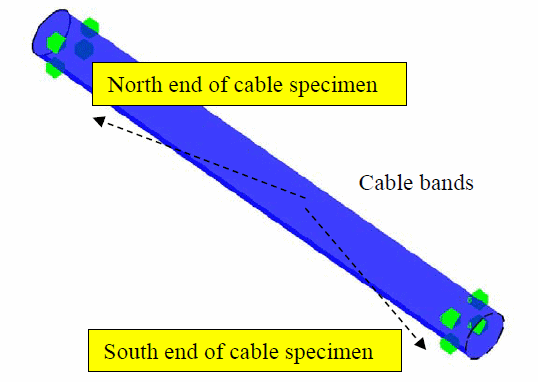
Figure 105. Illustration. Sensor locations
The sensors were used in three different location setups to determine the position of the wire breaks: linear location, two-dimensional planar location, and cylindrical location. On each test, a strain gauge was mounted on the prenotched wire being loaded, and its signal was recorded as an external parameter to monitor the load applied to the pre-notched wire. Also, average signal level (ASL), absolute energy, and root mean square voltage of the acoustic signals were monitored at a frequency of 10 Hz as time-driven data. The threshold for the AE system was set to 45 dB.
The objective of the test was to attempt to break three prenotched wires. The difficulties in pulling wires until they failed were created by the presence of the massive steel frame supporting the cable specimen (see figure 106), and this limited the number of pulled wires to three. Figure 106 shows the setup used to load the prenotched wires. In the first two wires, the prenotched wires broke at the junction with the grip used to applied load, so the results were not considered.
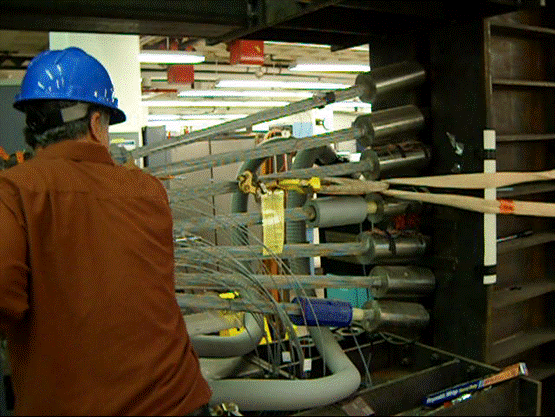
Figure 106. Photo. Mechanism to apply load to the prenotched wires
In the third attempt, the wire broke as expected. Figure 107 shows plots of acoustic ASL, absolute energy (Joules x 10-18), and load (kips) versus time during the third wire break attempt. In the figure, ASL is depicted in green, absolute energy is depicted in red, and load is depicted in blue.
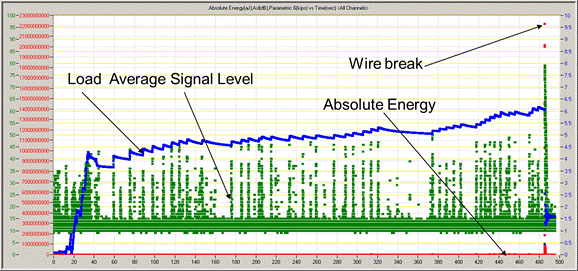
Figure 107. Graph. ASL (green), absolute energy (red), and load (blue) versus time during
the third wire break attempt
The green line represents the average signal level (a measurement of the AE signals over time that reach a channel) and is measured in dB units. The red line indicates the absolute energy, representing the area under the curve of the rectified waveform, and is measured in aJ, while the blue line indicates the load applied to the wire in kips. Figure 107 indicates that bursts of AE produced by friction were detected every time the load was increased.
However, the absolute energy of these AE bursts was insignificant compared to the absolute energy generated by the wire break. This means that a wire break could be clearly set apart from regular AE caused by movement or load changes in the cable.
After the wire was broken, the wire was pulled out about 5 inches (127 mm) from the edge of the cable before it broke, as can be seen in figure 108.
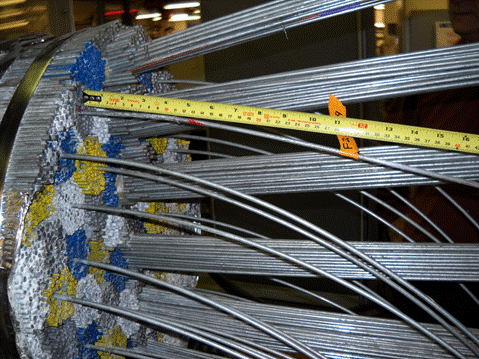
Figure 108. Photo. Broken wire pulled out from the edge of the cable before breaking
During the wire break, the R0.45I array sensors located many low energy events during the loading process, in addition to the actual high energy wire break, as shown in figure 109. In this figure, the cylindrical surface of the mockup cable is shown open, with the horizontal axis (in inches) representing the length of the mockup, and the vertical axis representing the perimetral distance. In addition, the locations, with related channel number corresponding to the sensors, are presented on their actual locations on the cable bands.
The low-energy events generated by friction and movement of the cable, shown in green, are located all along and around the cable, while the high-energy data, generated by the wire failure, are shown in blue, yellow, and red. A quick review of the waveforms corresponding to the low- and high-energy events show a clear difference when comparing the amplitude of the signals with the threshold values represented by the red horizontal lines. The wire break signals show a large amplitude and sharp rise time, while the noise signals are barely above the threshold. The difference in energy between these two types of signals is of two orders of magnitude or about 40 dB.
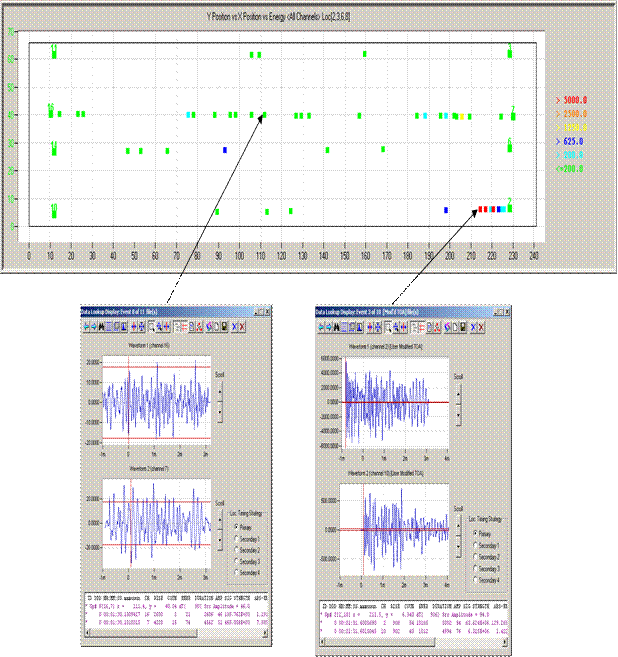
Figure 109. Illustration. Low- and high-energy events during the wire break from R0.45I
sensors
By comparison, the results obtaining with the R1.5I sensors shown in figure 110 present only one event with low energy and two events related to the wire break. This indicates that the R1.5I sensor is less susceptible to detect the noise signals, traditionally containing lower frequency. It is important to mention that the two set of sensors correctly located the position of the wire break.
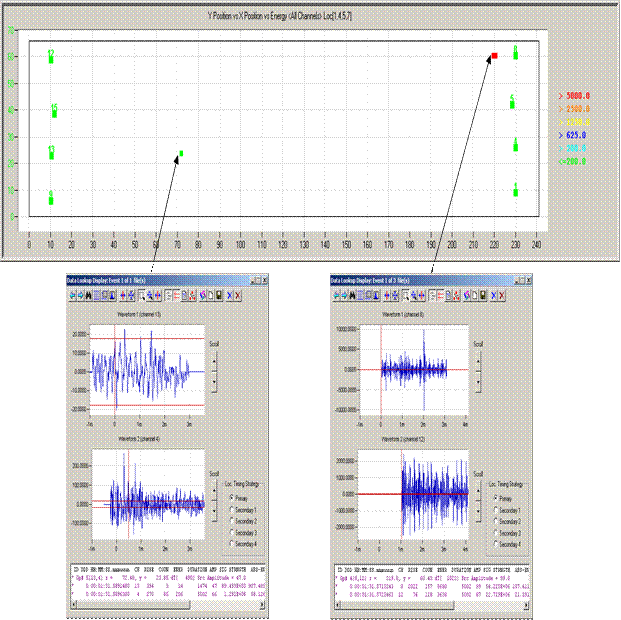
Figure 110. Illustration. Low- and high-energy events during the wire break from R1.5I
sensors
The array of R0.45I sensors detected and located the wire break longitudinal position with good accuracy-217.9 inches (5,534.66 mm) from the edge of the cable versus 223 inches (5,664.2 mm) of the actual wire break. The circumferential position calculated was 18 inches (457.2 mm) away from the actual position at 61 inches (1,549.4 mm) along the circumference of the cable. The R1.5I sensors detected and located the wire break longitudinal position with excellent accuracy-222.9 inches (5,661.66 mm) from the edge of the cable versus 223 inches (5,664.2 mm) of the actual wire break. The circumferential position calculated was 57.9 inches (1,470.66 mm) versus 61 inches (1,549.4 mm) for the actual position. The position of the wire break on the cylindrical surface of the cable is shown in figure 111 and figure 112.
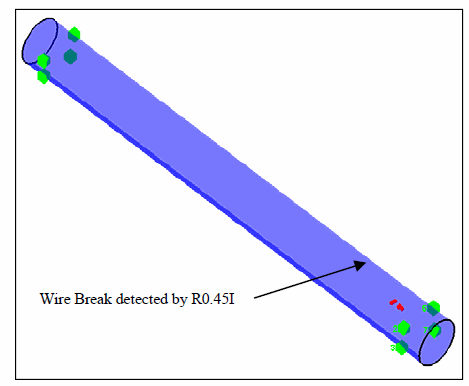
Figure 111. Illustration. Location of the wire break with the R0.45I sensor on the surface
of the cable mockup
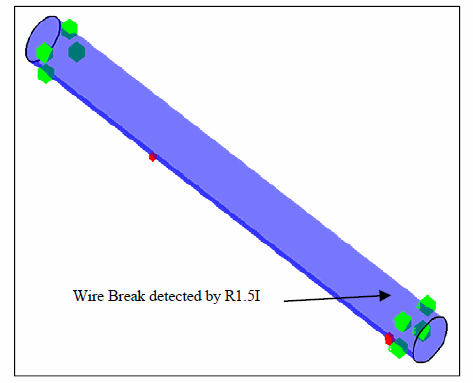
Figure 112. Illustration. Location of the wire break with the R1.5I sensor on the surface
of the cable mockup
Looking at the localization of the wire break in the cable cross section, both sets of AE sensors, R0.45I and 4 R1.5I, provided accurate estimation of the wire break position. The calculated position of the wire break was approximately 2.5 inches (63.5 mm) from the surface of the cable (figure 113 and figure 114), which was very close to the position of the broken prenotched wire. In the figures, the x- and y-axes represent the Cartesian coordinates that indicate the wire locations. The circle represents the cable cross section with the corresponding sensor locations. The recorded AEe vents are indicated by colored dots.
From these preliminary results (only one wire pulled to failure), it is possible to infer that the AE system used in this study, with both R0.45I and R1.5I sensors, showed potential for assessing the location of wire failure in interior wires. Looking at the different energy content, it is possible to segregate the characteristics of a wire break signal from background noise. Also, by observing the minimum instrumentation required, the results demonstrate that at least three AE sensors per cable band are needed for an accurate estimation of the wire break location (within 1 inch (25.4 mm)) while even only one AE sensor is sufficient along the cable length. However, these conclusions are based on a successful experiment, and more tests are needed.
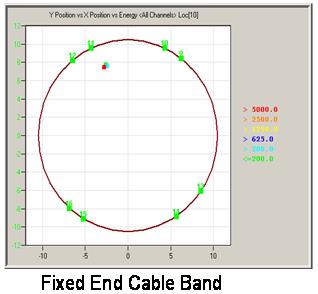
Figure 113. Graph. Planar localization of the wire break using the R0.45I sensor
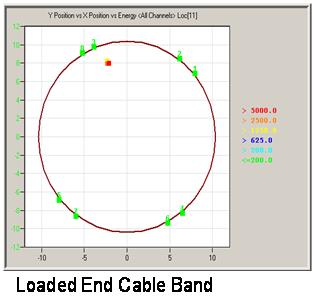
Figure 114. Graph. Planar localization of the wire break using the R1.5I sensor