U.S. Department of Transportation
Federal Highway Administration
1200 New Jersey Avenue, SE
Washington, DC 20590
202-366-4000
Federal Highway Administration Research and Technology
Coordinating, Developing, and Delivering Highway Transportation Innovations
| REPORT |
| This report is an archived publication and may contain dated technical, contact, and link information |
|
| Publication Number: FHWA-HRT-14-023 Date: May 2014 |
Publication Number: FHWA-HRT-14-023 Date: May 2014 |
The last phase of the project called for the installation of the developed integrated system of sensors and technologies on a real cable of a suspension bridge in the City of New York. In agreement with the New York City Department of Transportation (NYCDOT), cable D of the Manhattan Bridge was chosen. This bridge was going through an extensive cable evaluation operation, so it would have made the installation and the removal of the sensors at the end of the test period easy. Built in 1912, this suspension bridge is one of the main traffic arteries between Manhattan and Brooklyn. Spanning over a length of 6,851.92 ft (2,089 m) with a central span of 1,469.77 ft (448.1 m), this bridge carries a daily traffic flow of over 72,000 vehicles per day. There are 4 main cables, each made of 37 strands of 256 wires each, for a total of 9,472 wires bundled in a cable with a 21-inch (533.4-mm) diameter. The number of wires and the corresponding cable diameter of one of the Manhattan Bridge cables are close to the number of wires and cable diameter of the cable mockup tested in this study.
The field installation was divided into two phases. The first phase was conducted at an early stage of the problem to look at the problems associated with the logistics of installing a network of sensors that had to provide measurements in real time. Hence, problems related to the wireless and wired transmission of data from the cable panel remote locations to the DAQ installed in the cable anchorage, to data transfer through the internet, to power requirement, to safety, etc., were addressed. In this phase, the sensor system was represented by fiber-optic strain gauges among cable bands, electromechanical strain gauges on the eyebars, temperature and humidity sensors for the anchorage chamber, and a weather station. Having addressed all these logistics issues saved time and resources in the second (and final) phase of the field testing when the final sensor system, selected after the laboratory phase, was installed.
Phase I: Initial System Installation
A first set of sensors (fiber-optic strain gauges) was installed between panel point 1 and panel point 2 of cable D, as shown in figure 176 and figure 177, a location that is relatively close to anchorage D and where there were no obstructions for sensors mounting. Access to the main cable was coordinated with the appropriate bridge authorities.
With regard to the technologies used in this initial test, the monitoring system installed on the cable consisted of the following:
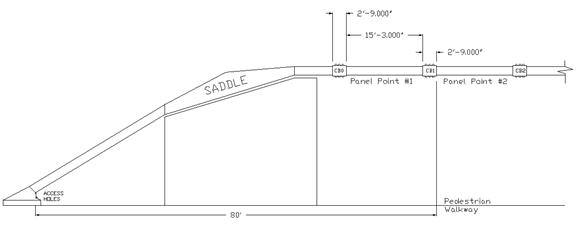
Figure 176. Illustration. Cable sketch and dimensions of field installation phase 1

Figure 177. Photo. Panel point 2 of Manhattan Bridge
Figure 178 shows the PAC Sensor Highway II system developed for this study. One key aspect in the final monitoring system was that all the sensors and technologies had to be integrated together into the sensor highway. A prototype of this system was developed and installed on the Manhattan Bridge, utilizing up to eight AE sensors/channels, an internal (and external) temperature sensor, two accelerometers, a weather station, and a wireless parametric adapter for monitoring suspension cable environmental parameters including temperature, humidity, and corrosion rate. The Sensor Highway II System was located inside the chamber of anchorage D (north cable on the Brooklyn side). The current block diagram for the integration of the various sensors and sensing systems that are being utilized in this project is shown in figure 179.
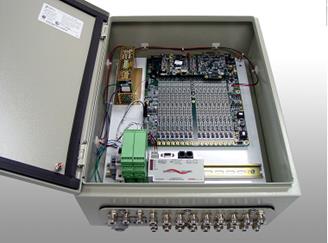
Figure 178. Photo. Sensor Highway II System
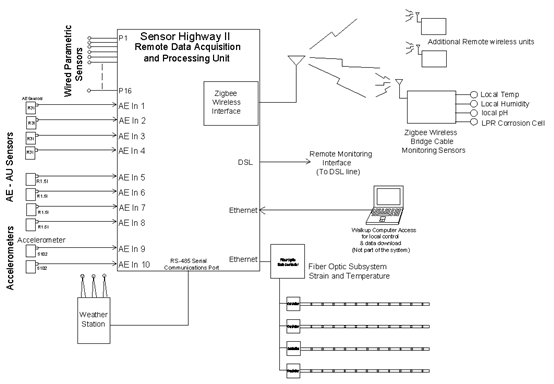
Figure 179. Illustration. Block diagram of the Sensor Highway II System
Four PAC R1.5IC auto sensor test (AST) and four PAC R3IC AST AE (environmentally coated) sensors were mounted directly on each cable band using epoxy. Cable band locations were selected rather than locations on the external wire coating because there was a better transmissibility of the AE signal from the wire through the cast iron of the band. The wrapping wire coating, which was not directly in contact with the wires and resting on a layer of lead/zinc paste, functioned as a filter for the signal transmission to the AE sensor, altering the amplitude and frequency content of the recorded signal. This information was used in the laboratory test on the cable mockup. The AST feature in the selected AE sensors allowed researchers to verify sensor coupling and performance at any time throughout the monitoring period.
Two model 5102 accelerometers were mounted to the bridge to monitor vibration and bridge movement for analysis correlation of any detected AE activity with respect to bridge movement.
A Vaisala WXT510 weather transmitter was selected to measure external temperature, relative humidity, rainfall, wind speed and direction, barometric pressure, etc. (see figure 180 and figure 181). This model was chosen because of it is entirely solid state; it is completely electronic without any moving parts. Mounted on the parapet above the arch over the pedestrian walkway approximately 50 ft (15.25 m) from panel point 2, this weather station used the RS-485 interface and was connected to the Sensor Highway II system (via cable) in anchorage D, which also provided the required 12-V power for operation.
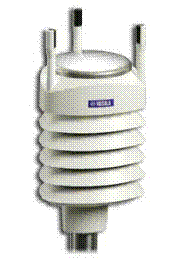
Figure 180. Photo. Vaisala WXT510 weather transmitter
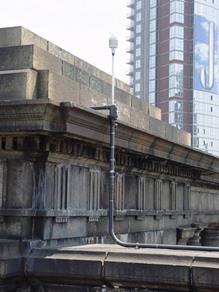
Figure 181. Photo. Weather station installed on the Manhattan Bridge
A temperature/humidity sensor was connected to the wireless parametric interface box. The size of the integrated sensor was 0.9-by-0.5-by-0.365 inch (22.86-by-12.7-by-9.27 mm) and required low power and minimal external conditioning circuitry. This sensor was used to monitor any changes of the environmental conditions inside anchorage D (e.g., shut down of dehumidification system). The wireless parametric sensor interface was installed to create a wireless link between the parametric readings of temperature and humidity in the anchorage and the Sensor Highway II System installed in the same location. The initial data collection was configured for collection on an hourly basis to maximize battery life. This system was tested by shutting down the anchorage dehumidification system. As shown in figure 182, the system immediately recorded a decrease in temperature and a consequent increase in humidity. As soon as the anchorage dehumidification system was reactivated, the temperature and the humidity inside the anchorage chamber returned to normal values.
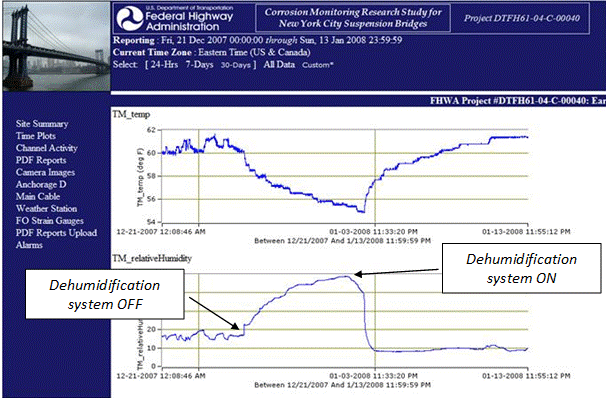
Figure 182. Screenshot. Graph of temperature and humidity inside the cable anchorage
remotely reported via a secure Web portal
The fiber-optic strain gauge system was installed on panel point 2 as well on the eyebars at the anchorage, as shown in figure 183 through figure 186. It consisted of three Surveillance d'Ouvrages par Fiber Optiques (SOFO) sensors placed along the suspension cable and two multiplexed strain and temperature (MuST) deformation sensors mounted on the eyebars in the anchorage. Mounting of these sensors on the cable and eyebars has been coordinated with NYCDOT.
The SOFO system is a fiber-optic displacement sensor with a resolution in the micrometer range. It is based on the principle of low-coherence interferometry. The infrared emission of a light-emitting diode is launched into a standard single mode fiber and directed, through a coupler, toward two optical fibers mounted on or embedded in the structure to be monitored. The measurement fiber is in contact with the structure itself and follows the elongations and contractions of the structure. The second fiber, called the reference fiber, is installed free next to the measurement fiber. Mirrors placed at the end of both fibers reflect the light back to the coupler that recombines the two beams and directs them towards the analyzer which, in turn, transforms a change in the path unbalance between two optical fibers into a distance variation and consequently into strains. Hence, it is possible to say that this type of sensor has both an active and passive part. The active part contains the reference and the measurement fibers and measures the deformations between its two ends, while the passive part is insensitive to deformations and serves as a reference. The MuST system is based on a fiber Bragg grating (FBG) design that transforms a static or dynamic distance variation into a change in reflected wavelength of a prestressed FBG. The main interest in using Bragg gratings is in their multiplexing potential. Many gratings can be written in the same fiber at different locations and tuned to reflect at different wavelengths. This allows the measurement of strain at different locations along a fiber using a single cable.
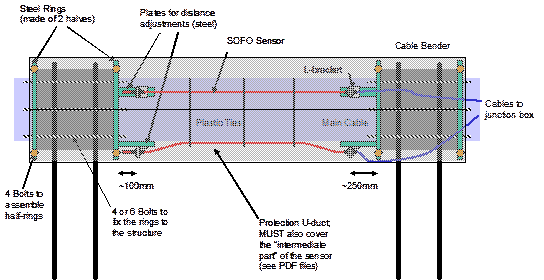
Figure 183. Illustration. Mounted SOFO sensors
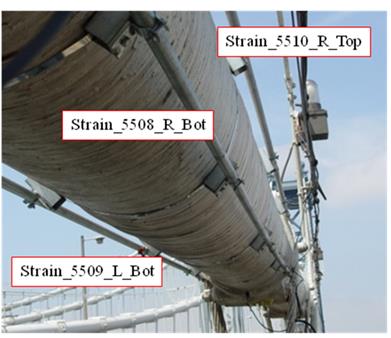
Figure 184. Photo. Actual locations of mounted SOFO and MuST fiber-optic sensors
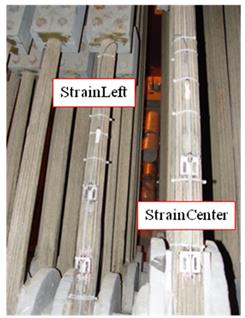
Figure 185. Photo. Strands at the anchorage with mounted fiber-optic strain sensors
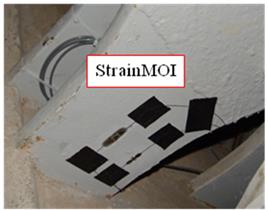
Figure 186. Photo. Strain gauges mounted on the eyebar
All DAQs were housed in a standard National Electrical Manufacturers Association (NEMA-4) enclosure (see figure 187). The "4" rating means that the enclosure is intended for indoor or outdoor use primarily for providing a degree of protection against windblown dust, rain splashing, and hose-directed water. Communication and data collection between the Sensor Highway II system and the fiber optic system was through a digital subscriber line (DSL) connection at the bridge with a cable/DSL router connected to the DSL modem to allow the connection and remote access of the two DAQs (see figure 187). The cable/DSL router had a built-in firewall capability that was configured for security to protect the systems from authorized access. A Web portal (see figure 188) for secure remote data collection was created.
During phase I, data regarding temperature, humidity, and strains in the cable as well as in the eyebars were recorded and periodically analyzed. Since the goal of this phase was to address all the logistic problems related to the installation of the data acquisition and transmission infrastructure, the reliability of the system was extensively tested. For example, various tests were conducted changing the sampling rate of the sensors or looking at different combinations of different parameters (i.e., temperature versus relative humidity or temperature versus strains). At the end, it was concluded that the reliability of the system was quite good. As a result, the overall sensor highway system was considered to be ready for the corrosion monitoring sensors that had to be installed on the interior of the main cable during phase II.
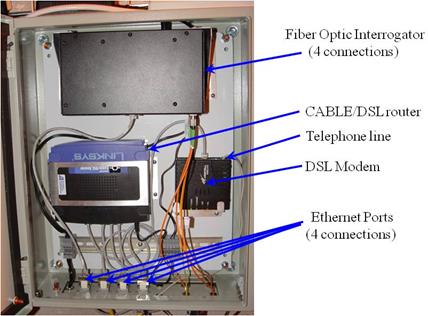
Figure 187. Photo. Typical NEMA-4 enclosure housing fiber-optic reading unit, DSL
router, and modem
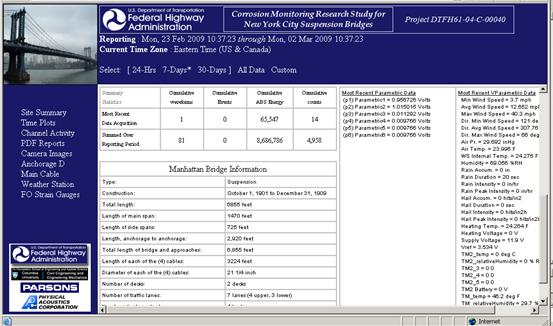
Figure 188. Screenshot. Web portal for secure remote data collection
Phase II: Installation of the Corrosion Monitoring System in the Main Cable
Upon successful completion of the laboratory phase for testing the sensors, the selected setup of sensors, measuring temperature, relative humidity, and corrosion rate was installed on cable D of the Manhattan Bridge. Two 19.68-ft (6-m) panels on the Brooklyn side span were chosen along the cable between panel points 13 and 15 (see figure 189). In each of the two panels, the main cable was wedged at four groove positions along the circumference, and sensors were installed inside the cable. The sensors were wired to a DAQ located at roadway level with a wireless modem which in turn transferred the data to a secured server to be made available to all stakeholders via a secured Web-based portal.
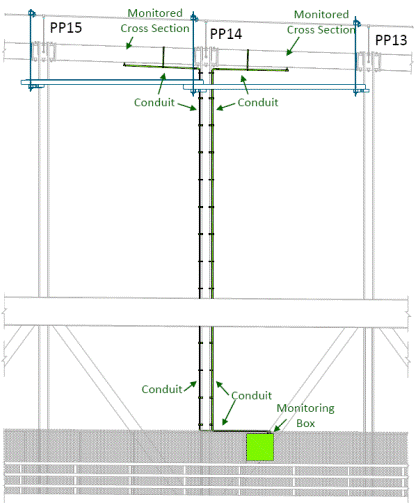
Figure 189. Illustration. Field installation location of sensor prototype on Manhattan Bridge north cable D
Prior to installation, access to each panel point was required. Access was facilitated through the use of a suspended platform that was installed by NYCDOT maintenance personnel. The platform was suspended from three cable bands on the north cable between panel points 13 to 15 (see figure 190 and figure 191), with the top of the platform approximately 36 inches (914.4 mm) below the bottom of the main cable.
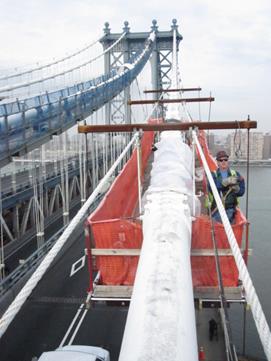
Figure 190. Photo. Suspended platform between panel points 13 and 15
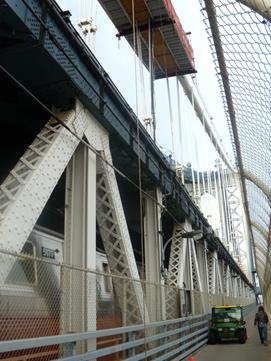
Figure 191. Photo. Walkway where the DAQ was installed
After the platform was installed, the cable was unwrapped and wedged at four groove positions along the circumference, namely at the 3, 6, 9, and 12 o'clock positions (see figure 192 ).
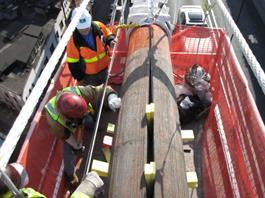
Figure 192. Photo. Cable preparation by unwrapping and wedging
Cable Inspection
The cable was inspected for its condition prior to installing the sensors, and the condition was documented so that a comparison could be made between the condition at the time of installation and at the end of the field testing upon sensor removal. This would have served as the basis for the assessment of the effects of the sensors on the condition of the cable wires over time. The internal wires were inspected by a cable expert and were found to be in good condition and covered with a grease-like coating. The surface wires exhibited corrosion levels 3 and 4 due to the wrapping wire condition, which was being replaced at the time of this system's installation as a part of a major rehabilitation project. No broken wires or any degradation of the zinc coating were found.
Sensor Installation
A total of 38 sensors (19 per panel) were installed within the 2 panels of the main cable on the Manhattan Bridge, as shown in figure 193. Each panel had eight temperature/humidity sensors, four LPR sensors, four BM sensors, and two CMAS.
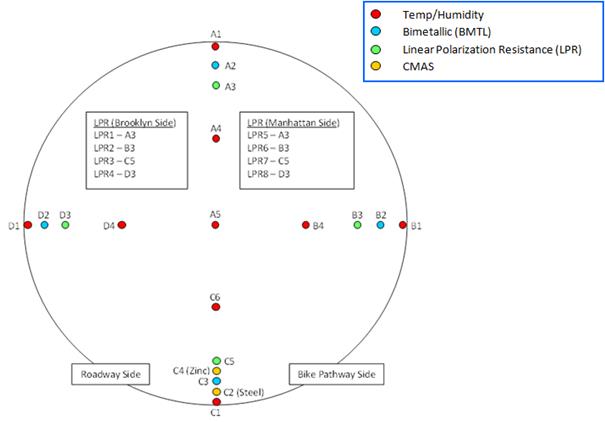
Figure 193. Illustration. Sensor distribution diagram within the cross section of the main
cable (grooves A–D)
The sensors were assembled together (see figure 194) by placing them on a plastic strap that was then placed inside the cable (see figure 195). Each of the four locations contained at least one sensor of each type in order to look at the potential changes through the entire cross section of the cable (e.g., time of wetness, onset of corrosion, etc.). The sensors and wires for each section were protected from crushing through the use of polymer jackets and strapping. The wires from each section exited from the top, bottom, and sides of the main cable (see figure 195 and figure 196).
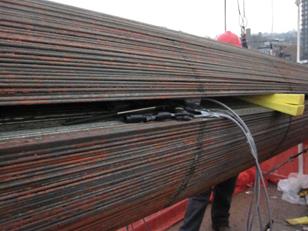
Figure 194. Photo. Sensor array used in each groove opening consisting of temperature/
humidity sensors and LPR, CMAS, and BM corrosion sensors
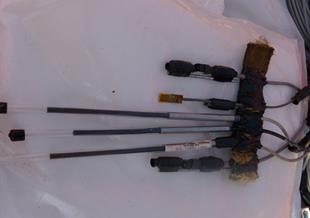
Figure 195. Photo. Set of sensors ready for installation
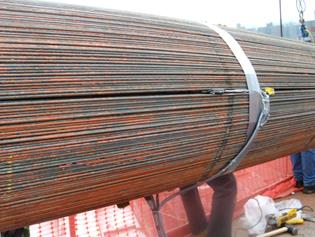
Figure 196. Photo. Sensor lead wires exiting from the cable after installation
Once the sensors were installed, the cable grooves were closed, and the cable was rewrapped with neoprene wrapping, leaving an exit port at the bottom of cable for the wires leading to the data acquisition box at the sidewalk level (see figure 197 and figure 198). All sensor cables exiting the main cable were bundled, placed inside a conduit for protection, and pulled through a semi-rigid conduit from the platform location, through the platform deck, down the suspender rope, and then to the DAQ on the sidewalk level. For the LPR sensors, because of the short wiring length, the data collector box was located inside an enclosure right below the cable and then connected to the data acquisition box at the sidewalk level.
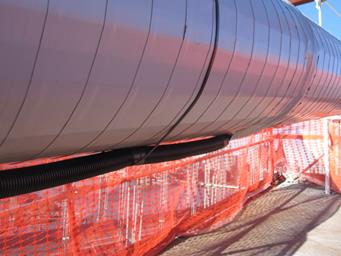
Figure 197. Photo. Cable temporary wrapping with neoprene and main conduit exiting at
the bottom of cable leading to the main DAQ box at roadway level
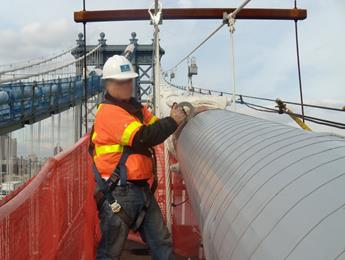
Figure 198. Photo. Final stage of the installation of the neoprene wrapping
Prior to pulling the sensor cables from the platform, a NEMA-4 enclosure was installed along the sidewalk directly below the platform and panel points being monitored. Figure 199 through figure 201 show the installation of the DAQ enclosure for collection of data from all installed sensors. The DAQ was offset so that the enclosure did not extend past the vertical plane of the top railing or impede bicycle/pedestrian traffic on the pathway.
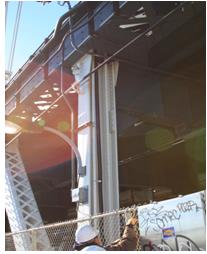
Figure 199. Photo. DAQ system/subsystem layout
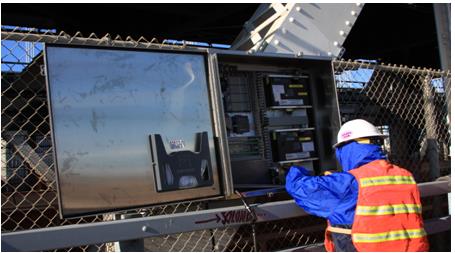
Figure 200. Photo. Installation of the central DAQ system
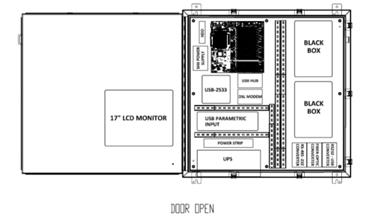
Figure 201. Illustration. Schematic representation of DAQ system
The DAQ housed all the components, subsystems, and hardware required for the collection of the data from the temperature, humidity, and corrosion sensors. The DAQ system included a main motherboard and central processing unit, subsystems for the BM and CMAS corrosion sensors (black boxes), RS485-232 converters, temperature/humidity parametric input board and converter (universal serial bus-2533), power supply, hard drive, monitor, uninterrupted power supply backup, and wireless cellular modem.
The installation of the sensors and systems was completed over a 2-week period. A total of 38 sensors (19 per panel) were distributed through the cross section of each panel. The collection of data lasted for almost 11 months, after which all the sensors and the DAQ were removed (October 18, 2011). All data were collected in real time and downloaded via cellular modem to central servers.
Data Collection and Analysis
The data collected by the 38 sensors provided a unique, real-time representation of the internal environment of the cable, which is an important key to understanding corrosion in suspension bridge cables and can help develop cost effective mitigation strategies.
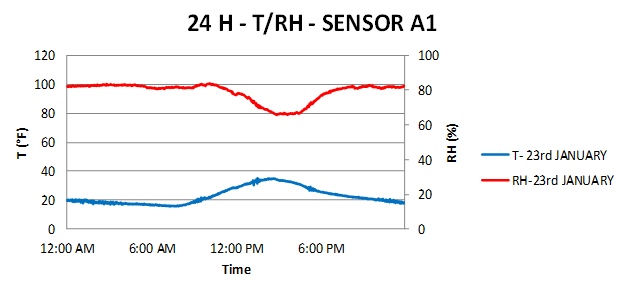
In examining the temperature and relative humidity data inside the cable over a 24-h period, it was confirmed that there was a direct and inverse correlation between these two quantities (e.g., as the temperature rises the humidity level decreases, confirming the results from the laboratory phase). Figure 202 shows the recorded temperature and relative humidity recorded by sensor A1 located on the top portion of the cable cross section on January 23, 2011. As the temperature increased from 20 to about 38 °F (-6.67 to 3.33 °C) (around 3 p.m.), the relative humidity decreased from 100 to 80 percent.
1 °C = (°F - 32)/1.8
Figure 202. Graph. Temperature and relative humidity over a 24-h period
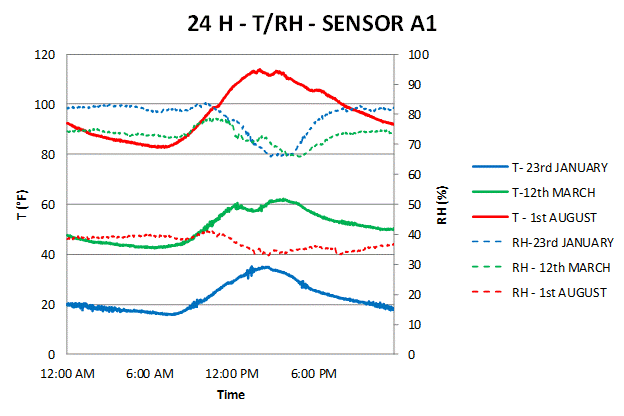
A similar inverse trend is shown in figure 203 where the daily variations of the temperature and relative humidity are plotted for 3 days at different times of the year (representing winter, spring, and summer). In August, as the temperature rose from 85 to 110 °F (29.44 to 43.33 °C) and reached a peak at 3 p.m. in the afternoon, the relative humidity decreased from 40 to 30 percent. In cooler months of the year (e.g., January and March), the temperature values were much lower (between 40 and 60 °F (4.44 and 15.56 °C) in March and 20 and 35 °F (-6.67 and 1.67 °C) in January), and the relative humidity values were much higher (between 65 and 75 percent in March and 65 and 90 percent in January). As shown in the laboratory phase of the experimental testing, the relative humidity values were affected by many different environmental parameters that were not necessarily synchronized with the sensor readings (e.g., rainfall during previous rain can affect the reading of a sensor a few days later).
1 °C = (°F - 32)/1.8
Figure 203. Graph. Temperature and relative humidity over a 24-h period showing
variations from winter to summer
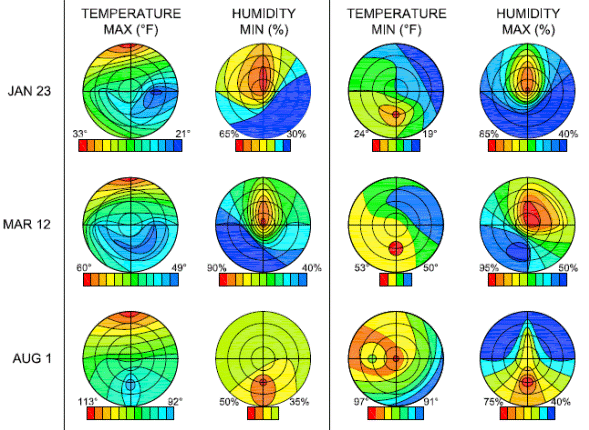
In order to analyze the temperature and humidity distribution across the cable cross section between day and night and also between winter and summer, the maximum and minimum values of the temperature and relative humidity recorded during different days were plotted. Figure 204 shows an actual mapping of the maximum and minimum temperature and humidity readings taken from the all the sensors in the cross section of cable. These maps clearly show that the distribution of temperature and humidity as not uniform across the cable cross section and that the bottom and shaded side portions of cable were likely to retain higher levels of humidity than the upper portion. Moreover, the daytime exhibited higher temperatures and lower humidity. In addition, when comparing the humidity levels between summer (August) and winter (January), the internal relative humidity level was higher in the winter than during the summer.
During the spring months when the temperature range was between 49 and 60 °F (9.44 and 15.56 °C) and the relative humidity was between 40 and 95 percent, the internal cable environment was the most conducive to corrosion, with high levels of humidity and with daily temperature cycles between day and night.
1 °C = (°F - 32)/1.8
Figure 204. Illustration. Temperature and relative humidity relationship/distribution
throughout the cable cross section during winter, spring, and summer
In the figure, red represents the highest range value, while blue indicates the lowest range value. Additionally, the left column reflects daytime distribution, and the right column reflects nighttime distribution. With regard to the corrosion rate sensors (LPR, CMAS, and BM), all of the sensors provided some useful and consistent measurement of corrosion activity. For example, all sensors showed that no corrosion activity was detectable when the relative humidity was below 45 percent. The relation between relative humidity and corrosion rate is shown in figure 205 for the LPR sensor A3 and figure 206 for the BM sensor C3.
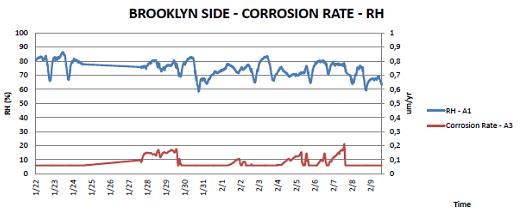
1 inch = 25,400 µm
Figure 205. Graph. Relative humidity versus corrosion rate measurement for LPR sensor
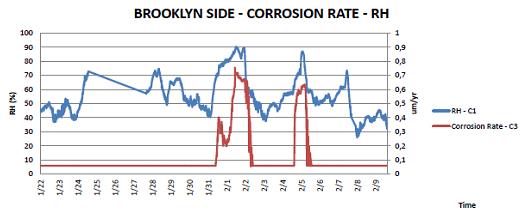
1 inch = 25,400 µm
Figure 206. Graph. Relative humidity versus corrosion rate measurement for BM sensor
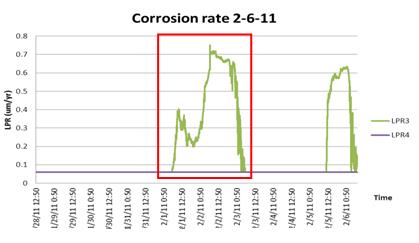
An interesting event occurred between January 31 and February 3, 2011. During these 3 days, all the corrosion rate sensors installed in the Manhattan panel (between panel points 14 and 15) recorded a potential onset of corrosion activity. During these 3 days, there was a substantial snowfall followed by heavy rain. The BM corrosion rate sensor recorded a spike in both zinc and steel corrosion rates. The zinc sensor recorded an increase in the corrosion rate of approximately 0.0002 inch/year (5 µm/year), while the corresponding steel corrosion rate reached a value of 2.16 x 10⁻⁵ inch/year (0.55 µm/year) (see figure 207 and figure 208). Similarly, the LPR sensors recorded an increase in the corrosion rate of approximately 2.76 x 10⁻⁵ inch/year (0.7 µm/year) (see figure 209). Overall, it took approximately 24 h before the corrosion rate returned to normal (i.e., no corrosion) for all sensors. As an example, temperature, relative humidity, and corrosion rate data recorded on the bridge during the months of March and April are provided in appendix B.
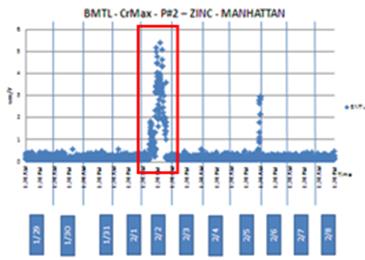
Figure 207. Graph. Increases in zinc corrosion recorded by BM sensor
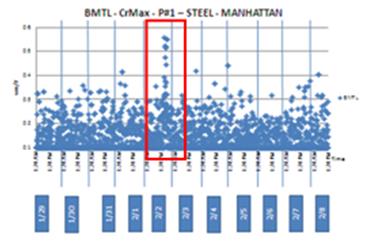
Figure 208. Graph. Increases in steel corrosion recorded by BM sensor
1 inch = 25,400 µm
Figure 209. Graph. Increase in corrosion rate recorded by LPR sensors
Following the measurement of what could be interpreted as an onset of corrosion activity, a visual inspection of the cable panels revealed that the neoprene wrapping used in these two panels was damaged due to construction activity (see figure 210). This sizeable opening might have been responsible for the penetration of water inside the cable.
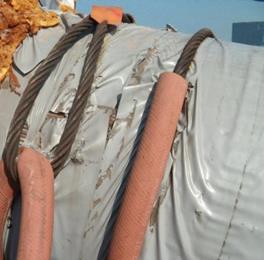
Figure 210. Photo. Damaged neoprene wrapping due to construction activity on the bridge
Decommissioning of the Cable Monitoring System
Upon completion of the 11-month monitoring, the cable wrapping was removed, and the cable was wedged open to retrieve the sensors, as shown in figure 211 and figure 212. The cable open groove was closely inspected for any damage due to contact with the sensors, but no damage was found (see figure 213). The cable was protected with temporary wrapping until the rehabilitation contractor began the permanent wrapping operation.
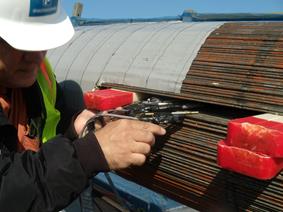
Figure 211. Photo. Decommissioning of the monitoring system by wedging the cable and
pulling the sensors out
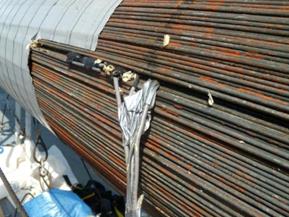
Figure 212. Photo. Wires from sensors prior to removal
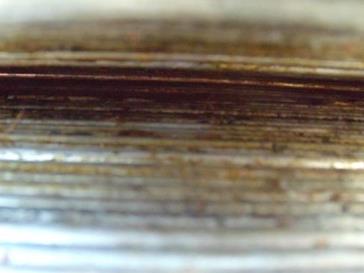
Figure 213. Photo. Close-up view of cable wires at the same location where the sensors
were installed showing no damage to the main cable wire