U.S. Department of Transportation
Federal Highway Administration
1200 New Jersey Avenue, SE
Washington, DC 20590
202-366-4000
Federal Highway Administration Research and Technology
Coordinating, Developing, and Delivering Highway Transportation Innovations
| REPORT |
| This report is an archived publication and may contain dated technical, contact, and link information |
|
| Publication Number: FHWA-HRT-14-023 Date: May 2014 |
Publication Number: FHWA-HRT-14-023 Date: May 2014 |
One of the main tasks of the original study was to evaluate the selected monitoring systems, sensors, and technologies on a cable mockup specimen that recreated as closely as possible the in-service conditions. To accomplish this objective, a 20-inch (508-mm)-diameter, 20-ft (6.1-m)-long cable specimen was fabricated in the laboratory at Columbia University. It was made up of 73 127-wire hexagonal strands for a total of more than 9,000 0.196-inch (4.98-mm)-diameter steel wires. The reason for building hexagonal shape strands was to optimize/minimize the void ratio inside the cable and to improve the final compaction of the cable. Of the 73 hexagonal strands, 7 were 35 ft (10.68 m) long and were subjected to tension, while the remaining 66 strands, which were 20 ft (6.1 m) long, were unloaded. This cable specimen was placed in a loading frame properly designed for this particular action, and some of the strands were subjected to a load so to induce stresses up to 100 ksi (689.48 MPa) (so to include the effects induced by stress corrosion cracking). The total length of the experimental setup was over 35 ft (10.68 m). An environmental chamber was built around it, and the cable was subjected to harsh environmental conditions.
The construction of such a cable was a challenging task because this is the longest cable of such diameter ever built in the world subjected to some external loading. Additionally, original bridge wires were used in the construction of the cable so to simulate as closely as possible the real conditions and to improve the fidelity of the experiment. Its design and construction presented many difficulties that required a lot of trial and error attempts. Figure 71 shows the side and plan views of the cable mockup and the cable cross section.
The steel wires have a diameter of 0.196 inch (4.98 mm) and are coated with class A zinc coating. The ultimate strength is approximately 246.56 ksi (1,700 MPa), while the yield strength is around 203.05 ksi (1,400 MPa). The chemical composition is made of the following components, with iron as the remaining percentage:
The actual production of bridge wires starts with reheating the steel billets to about 2,012 °F (1,100 °C) and rolling them in one continuous operation into a rod of about 0.39 inch (1 cm) in diameter. The coiled rods are then transferred to the wire mill. There, the rods are heat treated at a temperature of 1,652 °F (900 °C) and quenched to about 1,004 °F (540 °C) in a molten lead bath. After being air cooled so as to obtain the desired ductility and strength, the coiled rod is immersed in a series of tanks containing acid, water, and a coating solution. This coating solution eliminates any remaining traces of acid and acts as a lubricant in the subsequent cold drawing operations. The rods are then placed in annealing ovens to dry the coating and soften the steel in preparation for the drawing operation.
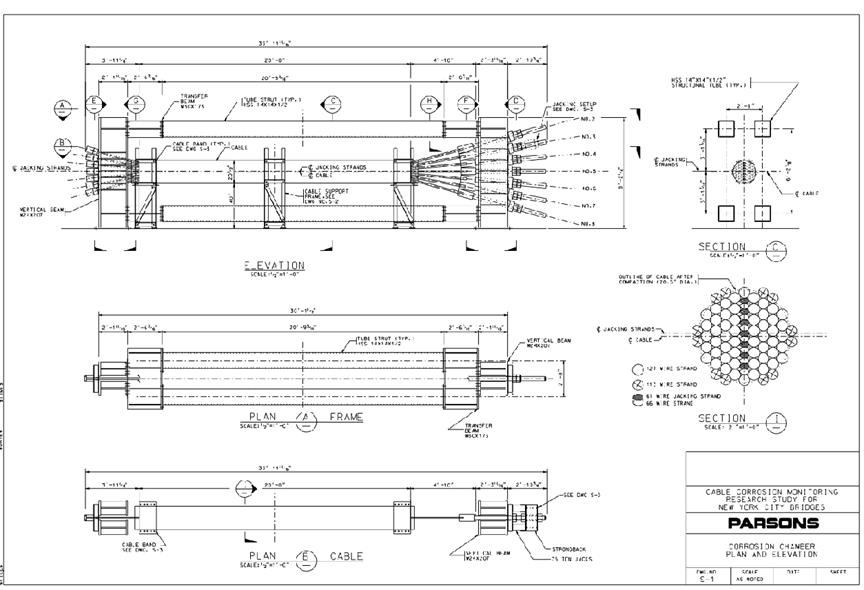
Figure 71. Illustration. Drawing of the cable mockup and corrosion chamber—plan and
elevation
The typical manufacturing process of a bridge wire involves the wires being sent through a set of dices made of tungsten carbide steel in order to reach the final diameter of the desired cross section. This process is driven by a set of power-activated drums, each one 36 inches (91.44 cm) in diameter. Cold working alters the wire microstructure. The grains are squashed, and their dislocation density is raised dramatically, producing tangles and residual stresses. Because of the small diameter of the pulling drum, the wires are subjected to large plastic strains, which induce a plastic distribution of stresses inside the wires. The effect of cold drawing increases the strength of the metal but also reduces its ductility. After being removed from the pulling drum, the wire coil experiences an increase in diameter (up to 50 to 60 inches (1,270 to 1,524 mm)) due to the fact that no pulling action is applied to the wire. This change in curvature induces an additional distribution of internal stresses which are then added to the original plastic stress distribution (currently unknown). The final wire coil is then chemically and thermally processed before being dipped in a hot zinc bath for galvanizing. Heating the cold-worked metal (annealing) reverses the effects produced by the cold drawing process. With the supplied thermal energy, dislocations will move to accommodate the stored residual stresses, forming a polygonized subgrain structure that concentrates the lattice disruption in just a small part of the grain volume. Recrystallization of the steel will begin with nucleation and growth of new grains, improving the ductility but reducing the wire strength. The galvanized wire is then wrapped on a reel of 60 inches (152.4 cm) in diameter and taken to the construction site. Figure 84 shows the entire amount of bridge wires used for the construction of the cable mockup.
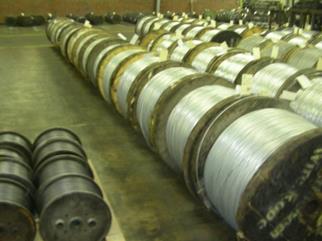
Figure 72. Photo. Wire coils to be used for the construction of the cable mockup (first row
of coils)
One of the major challenges has been the study of a procedure to build by hand straight strands from coiled steel wires. This has never been attempted before and requires a lot of trial and error. A complex procedure was finally developed that allowed researchers to build a straight strand out of coiled wires, as shown in figure 73. This required passing the wire in a series of combs and distributing the ends in a proper order of directions so that the curvature effects were minimized.
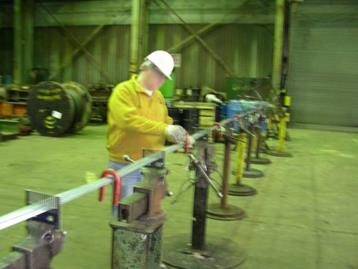
Figure 73. Photo. Strand under construction
This methodology was used for the construction of the 7 35-ft (10.68-m) strands that were subjected to loading. The other 66 strands, all 20 ft (6.1 m) in length, were built using the same methodology and the same steel wires from the initial coils but straightened (see figure 74). The straightening of the wires was necessary; otherwise, it would have not been possible to build such short strands. In fact, these strands were not socketed, and this would have made it impossible to build them from the original wires. The arrangement and details of the various strands are presented in figure 75.
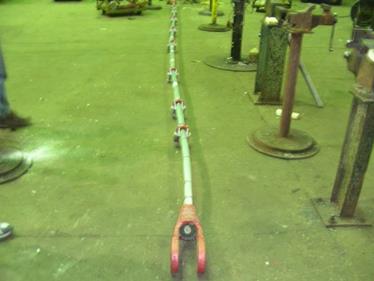
Figure 74. Photo. Final straight strand from coiled wire
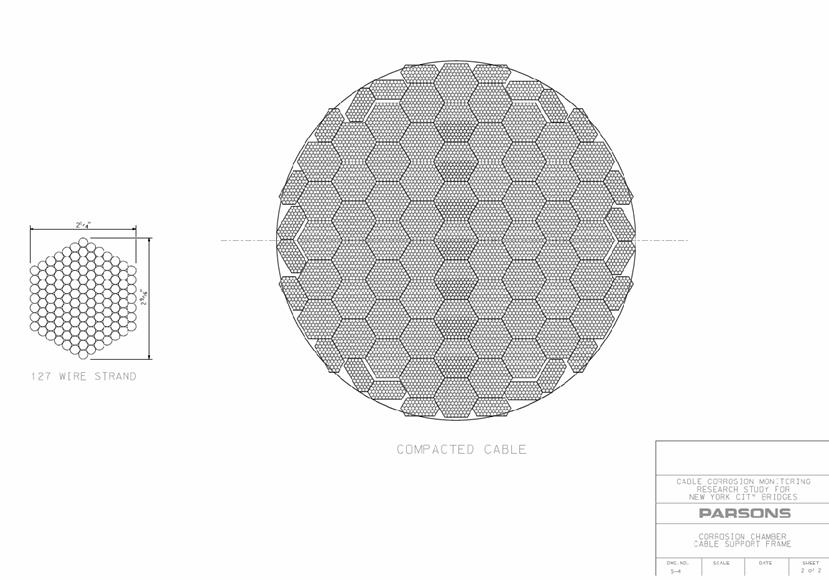
Figure 75. Illustration. Cable cross section and strand details
Once all the strands were completed, they were assembled following the arrangement presented in figure 75. Stacking of the strands started from the bottom of the cable moving upward, first placing the long strands and then the surrounding straight strands. Because of their tendency to curl as a result of the initial state of stress in the wires, the long strands needed to be pretensioned. First, a long strand was placed within the form and pretensioned, and then the surrounding straight strands were positioned so to restrain the long one. This procedure is shown in figure 76 through figure 78.
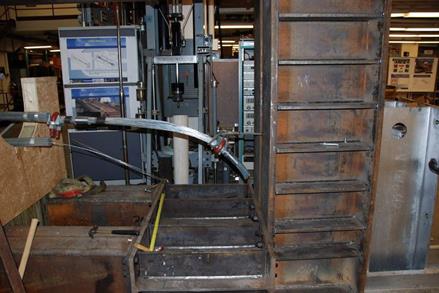
Figure 76. Photo. Long strand made of original coiled wires
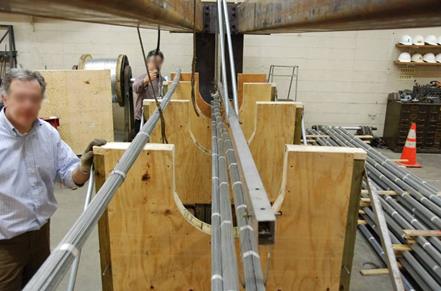
Figure 77. Photo. Lower strand assemblage
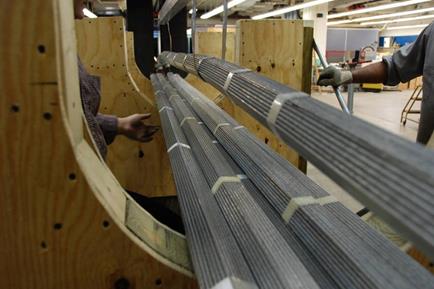
Figure 78. Photo. Central strand assemblage
Figure 79 shows an intermediate phase of the construction of the cable mockup.
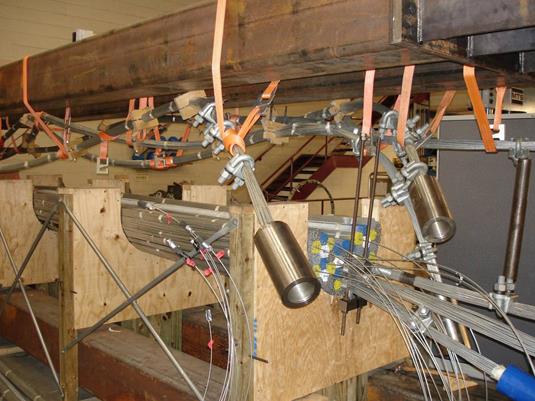
Figure 79. Photo. Intermediate cable construction phase
It is interesting to see the long strands with the end sockets hanging from the top beams of the loading frame. These strands were socketed at both ends and placed in tension through tensioning rods.
In figure 79, long wires are visible coming out of the shorter strands. Twenty-five long wires were prenotched at three locations along their length and inserted into various strands. Three of these wires were pulled to failure, and the results were used to test the AE system in detecting wire breaks occurring in the interior of a cable. The knowledge of the breaking locations allowed researchers to record and study different wire breaking signatures based on the breaking location along the cable length and along its diameter and on the sensor location relative to the breaking.
In addition, two strands were precorroded before being placed inside the cable. The two strands were placed for a month in a properly designed container and covered with acidic solution. The purpose of these two corroded strands was to generate interior conditions that were not uniform from the beginning of the experiment so that when direct sensing methods were tested for assessing the initial cable condition, a verification of their accuracy could have been available even before beginning the testing program.
In total, 72 sensors were installed in the cross section of the cable. Figure 80 provides a schematic representation of the locations where sensors that successfully performed during the tests were placed. Sensors were placed along three diameters, inclined at 60° with respect to each other. Such distributions allows for measurements that are distributed along the radial direction in order to have a three-dimensional distribution of the various parameters (e.g., temperature, humidity, etc.). The 16 temperature/relative humidity sensors were evenly spaced along the three diameters in order to have measurements for the temperature and humidity variations inside the entire cross section. Figure 81 shows a phase of the sensor placement inside the cable mockup. Special attention had to be made in protecting the sensors from being squished during the cable compaction. As shown in figure 81, sensors were protected using stainless steel pipes that were 3 inches (76.2 mm) long and covered with heat shrinking moisture-resistant coating. The heat shrink coating was used to prevent stainless steel pipes to act as cathode (since the chemical composition of the stainless steel pipe was unknown) and thus induce accelerating corrosion on the wires. The sensors were hard wired, and the electrical wires were run out of the center of the cable at two vertical locations.
Once all the strands had been placed in the right position, the cable was compacted using a 20.75-inch (527.05-mm)-diameter compactor (see figure 82). It is estimated that the compaction force produced inside the cable a pressure of approximately 2,000 psi (13,780 kPa). After the cable was compacted, the temporary wood forms were removed, and the cable was pulled to approximately 1,100 kip (4,893.04 kN) of tension. This cable tensioning was obtained by pulling each strand in increments of 25 kip (111.21 kN) each up to the maximum load of 145 kip (644.99 kN) for the central and lower three strands and 175 kip (778.44 kN) for the upper three strands. The tensioning of each strand was done using two 100-kip (444.82-kN) hydraulic jacks, as shown in (see figure 83).
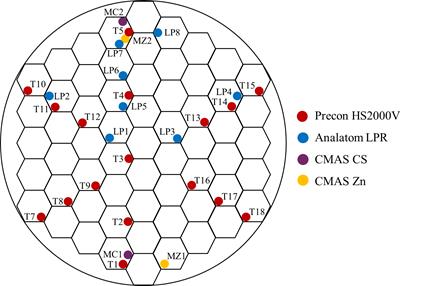
Figure 80. Illustration. Schematic locations of sensors in cable mockup cross section
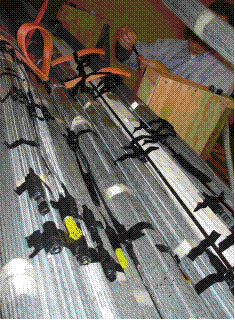
Figure 81. Photo. Placement of sensors inside the cable mockup
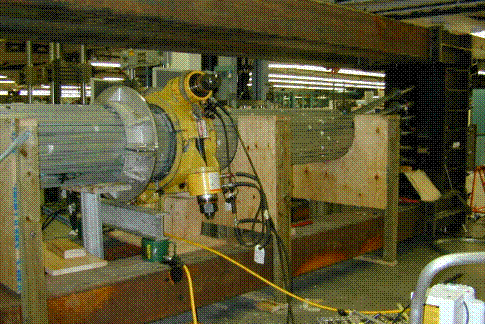
Figure 82. Photo. Cable compaction
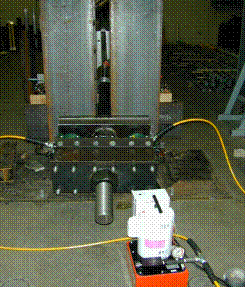
Figure 83. Photo. Jacking the first strand
The cable mockup in its final configuration prior to wrapping and to the construction of the environmental chamber is shown in figure 84.
The exterior protective wrapping of the cable mockup was performed by wrapping the cable with aluminum tape. It is important to observe that in these tests, the function of the wrapping was different from in a real bridge. In this test, since the sensor network had to be tested, the function of the wrapping coating was to keep as much humidity as possible inside the specimen so that the humidity sensors could be successfully tested. In real cables, instead, the function of the external wrapping is exactly the opposite (to prevent water to enter the cable). A neoprene strap was placed under the aluminum wrapping in correspondence of the exit location of the electric wires from the interior of the cable. This strap was needed to protect the electric wires from the intense heat of the heating lamps.
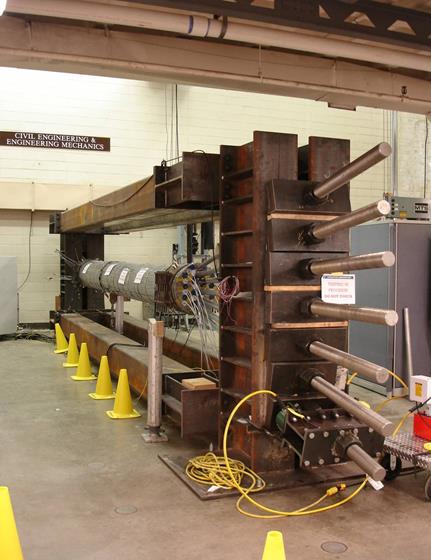
Figure 84. Photo. Cable mockup representative of a full-scale section of a suspension
bridge cable
An environmental chamber was built around the mockup cable specimen. The chamber was designed to expose the cable to controlled environmental conditions (i.e., simulated rain, heating, and cooling) to accelerate corrosion of the cable specimen, thereby assessing the functionality of the sensor network. Moisture was introduced into the system via water pumps and elevated punctured polyvinyl chloride (PVC) piping to simulate rainfall. Midway through the test program, openings were made in the cable wrapping coating to facilitate the influx of moisture to the inside of the cable mockup. Temperature increases were controlled with heat lamps located at the top of the chamber with a cut-off temperature of 125 °F (51.67 °C), while an air conditioning unit promoted temperature stabilization and rapid chamber/cable cooling. A ventilation system allowed for increased control of the relative humidity levels within the chamber environment. The final cable mockup with the environmental chamber ready for testing is shown in figure 85.