U.S. Department of Transportation
Federal Highway Administration
1200 New Jersey Avenue, SE
Washington, DC 20590
202-366-4000
Federal Highway Administration Research and Technology
Coordinating, Developing, and Delivering Highway Transportation Innovations
| REPORT |
| This report is an archived publication and may contain dated technical, contact, and link information |
|
| Publication Number: FHWA-HRT-14-023 Date: May 2014 |
Publication Number: FHWA-HRT-14-023 Date: May 2014 |
A complete literature review of the available corrosion monitoring techniques and sensors was conducted. The goal was to find out about the state of the art of the currently available sensor technologies, especially corrosion monitoring techniques, and to see whether these sensors/technologies could be applied to monitor main cables in suspension bridges. The literature review remained open for the entire duration of the project to consider any new developments that may have had potential for detecting and monitoring corrosion damage inside a suspension bridge cable.
Technologies were classified into two categories: (1) indirect sensing technologies and (2) direct sensing technologies. Indirect sensing technologies include all sensors and technologies that measure quantities that can be either directly (e.g., corrosion rate) or indirectly (e.g., temperature) related to corrosion of the wires. Direct sensing technologies include technologies that can directly measure the effect of corrosion (e.g., magnetic flux measurements can be directly correlated to the cross section of the specimen).
After an extensive literature review, the following technologies were considered worthy of further investigation:
The main lesson learned from the literature review phase was that no single means of corrosion detection (sensors or technologies) is either ideal or suitable for assessing all possible forms of corrosion-induced damage. The key point is the peculiarity of the structural element (in this case, the cable) under consideration. There are many sensors available on the market that can measure temperature, pH, relative humidity, etc., but only a few of those can be used in a bundle of over 10,000 steel wires subjected to strong compaction forces with difficult accessibility to the core. The proposed corrosion monitoring system will be an integrated system of sensors and technologies that will provide complementary (and sometimes redundant) information for the assessment of the cable's internal conditions.
In order to select the most appropriate sensors, a series of evaluation criteria was identified. The main criteria include the following:
Based on those criteria, the following sensors were selected for installation in the cable mockup specimen:
Some of these sensors were extensively tested in a series of accelerated corrosion tests prior to their installation in the cable mockup specimen. Others had already been tested and calibrated by the manufacturers.
Evaluation
Linear polarization is an electrochemical technique where a potential scan is applied to a freely corroding sensor element, and the resulting current response is measured. This small perturbation is applied step-wise, starting below the free corrosion potential (the open circuit potential) and terminating above the free corrosion potential. The LPR sensor used in this study has two electrodes: a working electrode and a counter/reference electrode (see figure 3 ). The potential between the two electrodes is measured directly, eliminating the need for a third reference electrode typical of three electrode procedures. In the sensor in figure 3 , the 0.006-inch (150-µm)-wide fingers of the working electrode are aligned with the 0.017-inch (450-µm)-wide fingers of the counter/reference electrode in an interlocking configuration, leaving an interdigitation gap between the two electrodes. The interdigitation distance, indicating the distance between the electrode fingers, determines the sensitivity of the sensors. A narrower gap allows an easier charge exchange and leads to more sensitive readings. In this study, three kinds of sensors with different interdigitation distances were tested. They will be referred to as 0.006-, 0.012-, and 0.048-inch (150-, 300-, and 1,200-µm) sensors, indicating the interdigitation gap between the electrodes. A smaller interdigitation gap results in a larger number of electrodes. The electrodes are 0.78 inch (20 mm) long and 0.37 inch (9.5 mm) wide and are made from standard shim stock of American Iron and Steel Institute (AISI) 1080 steel, which has a chemical composition similar to that of the bridge wires (see table 2 ). In this manner, the effect of sensor sensitivity stemming from material property fluctuation could be minimized. The electrodes are mounted on a Kapton® film, a non-conducting polymer not susceptible to corrosion.
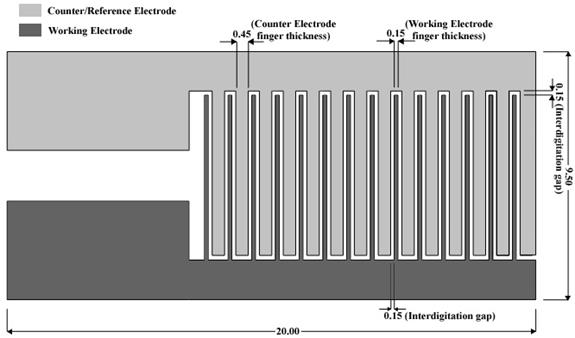
Figure 3. Illustration. Layout of the LPR sensor
Table 2 . Chemical compositions of AISI 1080 steel and standard bridge wire.
Chemical Composition |
AISI 1080 Steel |
Standard Bridge Wire |
|---|---|---|
Carbon |
0.75-0.88 percent |
0.75-0.85 percent |
Manganese |
0.60-0.90 percent |
0.55-0.75 percent |
Phosphorus |
0.04 percent max |
0.04 percent max |
Sulfur |
0.05 percent max |
0.04 percent max |
An LPR sensor can be considered an array of counter and working electrodes (a network of 14 sensors). A data acquisition unit performs a voltage sweep about the open circuit potential of the LPR sensor through a circuit that uses two operational amplifiers. The input voltage to the circuit is provided by the analog-to-digital (A/D) converter of the micro-controller, which can provide a voltage range of 0 to 1.5 V. The output voltage is proportional to the current through the LPR sensor. From the operational amplifier circuit, this voltage is measured by the micro-controller's A/D converter, which can sense voltages in the same voltage range. The slope of the input voltage versus output voltage curve is proportional to the polarization resistance (Rp) and is calculated from a least-squares data fit on the data collected from the voltage sweep. Rp data from the sensors are then recorded and converted into corrosion rate values.
Cyclic Corrosion Testing
Cyclic corrosion tests were developed in the 1960s and 1970s to test industrial maintenance coatings.(4,5) Cyclic corrosion tests expose specimens to a series of different environments in a repetitive cycle. This cyclic approach enables simulating environments that naturally oscillate due to atmospheric conditions. Cyclic corrosion testing has been shown to be a more realistic way of evaluating corrosion performance compared to traditional steady state exposures.(6) Relative corrosion rates, corrosion structure, and morphology observed in cyclic corrosion tests are excellent predictors of corrosion performance in real service environments. This has been particularly shown for zinc and steel corrosion.(7,8)
Cyclic cabinet testing simulates the changing outdoor environment such as corrosive ions, temperature, and humidity.(9) Most previous studies performed on the corrosion testing of suspension cable bridges had employed a version of cyclic testing. Eiselstein and Caligiuri used an immersion dry cycle to estimate the rate of corrosion-induced damage.(10) Their corrosive solution was prepared to match the chemical composition of acid rain that was collected from the Williamsburg Bridge in the City of New York. Betti and Vermaas et al. used solutions of higher acidity and salinity, applied as fog sprays, in order to further increase the corrosion rate. (See references 9 and 11-14.) Suzumura et al. employed wet-dry cycles by wetting gauzes wrapped around bridge wires through periodic water sprays. (See references 15-18.) Instead of preparing saline solutions, a method of depositing salt particles on the surface of test specimens prior to cyclic testing was selected.
In this study, an array of solutions ranging from mild to high corrosiveness were used as fog sprays. Cyclic tests were also run at different temperatures to investigate the impact of temperature on the corrosion rate.
Preliminary Testing:
The 290.4-gal (1,100-L) capacity Q-fog cyclic corrosion tester shown in figure 4 was used to run the cyclic tests. The corrosion tester is capable of running different cycles (fog, dry-off, and humidity) repetitively to reproduce outdoor cyclic conditions.
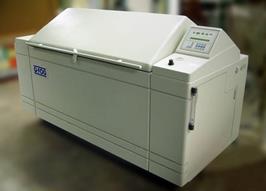
Figure 4. Photo. Q-fog cyclic corrosion tester
The sensors were first tested for their durability and ability to function under cyclic variation of relative humidity. A two-step cycle consisting of a high and a low humidity step was repeated continuously. At the start of the high humidity step, relative humidity within the chamber rose to 100 percent and remained constant for the rest of the phase. In the low humidity phase, the moist air inside the chamber was purged, and the relative humidity dropped to approximately 30 percent.
Figure 5 shows 2 of the 49-wire bundles used in this test. LPR sensors were placed in various locations on the surface and inside the bundles. The sensors showed high sensitivity to humid environments and were successful in capturing the start of corrosion reactions. Figure 6 illustrates an LPR sensor showing the onset of corrosion.
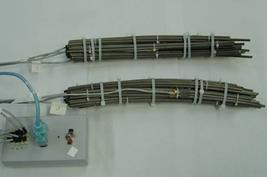
Figure 5. Photo. Wire bundles to be placed in corrosion chamber
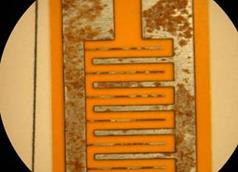
Figure 6. Photo. Onset of corrosion in an LPR sensor
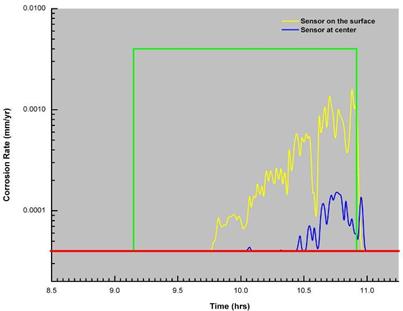
Figure 7 shows corrosion rate readings from two LPR sensors, one located on the surface (yellow line) and the other located at the center of a bundle (blue line) during a single high humidity step. The green ramp function indicates the start and the end of this humidity step. With the start of the humidity phase, relative humidity inside the chamber increased gradually and reached 100 percent. From the figure, it can be observed that the sensor mounted on the surface of the bundle detected corrosive activity earlier and at a higher rate than the sensor inside the bundle. This was expected since the wire bundle acts as a barrier against moisture.
1 inch = 25.4 mm
Figure 7. Graph. Close-up of a humidity step.
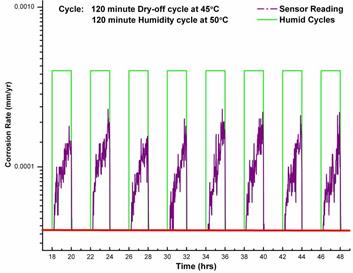
The next step of the testing was aimed at examining the consistency of the sensors when subjected to the same humidity cycle for an extended duration of time. Figure 8 shows corrosion rate readings from an LPR sensor subject to repetitive cycles. Each cycle lasted 4 h and consisted of 120 min of humid environment at 122 °F (50 °C) and 120 min of dry cycle at 842 °F (450 °C). Since the goal of this testing program was to calibrate the sensor readings to the wire corrosion rate, it was important to keep the sensor away from saturation, which is why the corrosion rate readings were low. In addition, this was the actual corrosion rate of the sensor and not that of the bridge wire. To determine this correlation, it is important to prevent saturation in the sensor. Corrosion rate readings obtained from sets of sensors with the same interdigitation distance and in the same environmental conditions were found to be consistent over time and in agreement with each other.
1 inch = 25.4 mm
1 °C = (°F - 32)/1.8
Figure 8. Graph. Corrosion rate versus time in cyclic humidity testing of a sensor
Several tests consisting of humidity, dry-off, and fog cycles were run to test the survival of sensors in harsh environments. During the fog cycles, aggressive solutions of low pH and high chloride content were sprayed on the sensors in fine mist form. Figure 9 shows an LPR sensor after a week of testing with a solution of pH = 2.5 and 3.5 percent sodium chloride in weight. Most of the sensors ceased to function after a week of cyclic testing under these severe conditions. The LPR sensors performed better in milder tests of humid dry cycles in the 77 to 140 °F (25 to 60 °C) range and fog sprays of pH = 3.5 and higher. Almost all of the sensors were functional after a month of cyclic testing with only a few sensor failures.
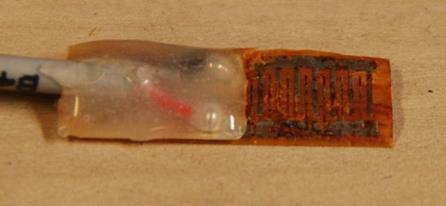
Figure 9. Photo. Corroded LPR sensor after 1 week test
Experimental Program:
After evaluating the performance and establishing the soundness of LPR sensors, cyclic tests were run to collect calibration data for the LPR sensors. A series of tests were conducted in which LPR sensors and bridge wires with the zinc coating removed were placed in the cyclic corrosion chamber at the same time and subjected to the same environment. Corrosion rate readings from the sensors were recorded and integrated over time, while the mass loss from before and after the testing was measured for the wires. By correlating the sensors' reading with the wires' mass loss, it was possible to obtain the proportionality constant that allows to adjust the sensors' reading to the wires.
An array of LPR sensors (up to 6 sensors for experiment) were mounted on a Plexiglas® board and placed in the vicinity of the bridge wire samples (10 for each experiment). The sensors were connected to a data acquisition unit supplied by Analatom Inc., which communicated with a computer via a serial port. This unit was capable of recording Rp readings from up to eight channels at specified intervals. During each test, Rp data from the LPR sensors were recorded at 1-min intervals for the duration of the test. These readings were used for calibrating the sensors against the measured mass loss for bridge wires undergoing the same tests.
The corrosion cycle used in this study is similar to the cyclic acidified salt fog test A2 outlined in ASTM G85-02.(19) The 3-h three-step cycle consisted of the following:
In the salt fog step, a fog solution was sprayed on the specimens through a nozzle in fine mist form. Distribution of the fog spray was homogeneous within the corrosion chamber. As the high humidity step began, relative humidity in the chamber increased to 100 percent and remained constant throughout the phase. During the following low humidity phase, the moist air inside the chamber was purged out, and relative humidity dropped to a constant ambient laboratory level of approximately 30 percent.
For each experiment, 48 cycles were performed. A total of 18 experiments were carried out to study the effects of temperature, pH, and chloride concentration on the corrosion rate of bridge wires. In six of these experiments (1, 2, and 4-7), wires were placed together with sensors to obtain recordings needed for sensor calibration. Chloride content and pH of fog solutions were varied, along with the temperature at which each test was run. Table 3 lists the test conditions for each experiment. The pH of the fog solutions were adjusted with acetic acid to attain pH values of 3.0, 4.0, and 6.0. Chloride content was regulated by sodium chloride to achieve 100 and 500 ppm chlorine ion solutions. For 100 ppm, 0.02 oz (0.62 g) of sodium chloride per gallon of water were used, while 0.11 oz (3.115 g) were used for the 500 ppm condition.
Table 3 . Experimental program.
Experiment Number |
Temperature |
pH |
Chlorides (ppm) |
|---|---|---|---|
1 |
30 |
6 |
100 |
2 |
35 |
6 |
100 |
3 |
45 |
6 |
100 |
4 |
30 |
4 |
100 |
5 |
35 |
4 |
100 |
6 |
45 |
4 |
100 |
7 |
30 |
3 |
100 |
8 |
35 |
3 |
100 |
9 |
45 |
3 |
100 |
10 |
30 |
6 |
500 |
11 |
35 |
6 |
500 |
12 |
45 |
6 |
500 |
13 |
30 |
4 |
500 |
14 |
35 |
4 |
500 |
15 |
45 |
4 |
500 |
16 |
30 |
3 |
500 |
17 |
35 |
3 |
500 |
18 |
45 |
3 |
500 |
1 °C = (°F - 32)/1.8
Wires used in the tests were typical high-strength bridge wires of 0.196-inch (4.95-mm) nominal diameter including the protective zinc coating and 0.192-inch (4.88-mm) diameter without the coating. The samples were prepared by cutting long, straight bridge wires into 10-inch (254-mm) segments. For each experiment, 10 samples were prepared. Since the purpose of testing was to investigate the corrosion of steel, the zinc coating layer was removed by immersing the wires in hydrochloric acid until all the zinc was dissolved. The wires were then rinsed thoroughly and hot air dried in a desiccator. The clean, dry specimens were weighed to the sixth significant figure.
The 10 samples were placed in the corrosion chamber as shown in figure 10. Wires were held in place using two racks made out of acrylic. The only points of contact between the wires and the acrylic racks were at the wire ends where the wires were supported. These contact points were confined to thin strips of less than 1/8 inch (3.18 mm). Wires were hanging freely in between the support racks. This setup ensured that the corrosion reactions were only between the wires and the atmosphere within the chamber. At the end of each test, samples were hot air dried in a desiccator for 24 h. To measure the corrosion loss for each specimen, corrosion products were removed from the surface of each wire. First, extraneous deposits and bulky corrosion products were removed by brushing. Special care was given to the cleaning so that the uncorroded metal was not removed along with the corrosion products. A chemical cleaning procedure given in ASTM G1-03 was followed to remove the remaining corrosion products.(20) The following solution was prepared at room temperature:
Wires were immersed in this solution until all remaining corrosion products were removed. The solution was vigorously stirred by a magnetic stirrer during this phase. Wires were removed from the solution every 5 min, wiped with a cloth, and inspected for remaining corrosion products. If rust was still present on a wire, the wire was returned to the cleaning solution; otherwise it was dried and weighed. The difference between this final sample weight after cleaning and the initial weight gives the total corrosion loss in terms of mass. This loss was then converted to uniform thickness loss using the known geometric properties of the bridge wires.
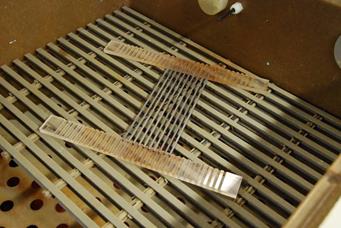
Figure 10. Photo. Specimens placed in the Q-fog cyclic corrosion tester
Table 4 presents the average weight loss and an equivalent value of the corrosion depth for all wires used in the 18 experiments.
Table 4 . Average weight loss and equivalent corrosion depth for wire specimens.
Experiment Number |
Weight Loss (g) |
Corrosion Depth (µm) |
|---|---|---|
1 |
0.2696 |
14.87 |
2 |
0.3020 |
16.67 |
3 |
0.3249 |
17.93 |
4 |
0.3204 |
17.68 |
5 |
0.3543 |
19.56 |
6 |
0.3838 |
21.19 |
7 |
0.3539 |
19.56 |
8 |
0.3760 |
20.76 |
9 |
0.4409 |
24.35 |
10 |
0.2829 |
15.61 |
11 |
0.3147 |
17.37 |
12 |
0.4025 |
22.23 |
13 |
0.3398 |
18.76 |
14 |
0.3840 |
21.20 |
15 |
0.4382 |
24.20 |
16 |
0.3746 |
20.68 |
17 |
0.4292 |
23.70 |
18 |
0.5068 |
28.00 |
1 oz = 28.35 g
1 inch = 25,400 µm
Calibration of LPR Sensors:
Table 5 presents a list of the experiments where the sensors were tested for calibration and the type of sensors used. In experiment 3, there were power problems with the data acquisition system (DAQ), so the measurements obtained by the three sensors in the test were not considered in the analysis. On the contrary, experiment 3 appears in the list of the experiments for the determination of the corrosion rate of the wires (see table 4) since the wires were not affected by the malfunctioning of the DAQ.
Table 5 . Type and number of LPR sensors used in experiments.
Sensor Type |
Number of Sensors per Experiment Number |
|||||
|---|---|---|---|---|---|---|
1 |
2 |
4 |
5 |
6 |
7 |
|
150 µm |
1 |
1 |
- |
2 |
2 |
2 |
300 µm |
- |
- |
- |
2 |
2 |
2 |
1,200 µm |
- |
- |
1 |
2 |
1 |
2 |
- Indicates that there were no sensors of that type.
1 inch = 25,400 µm
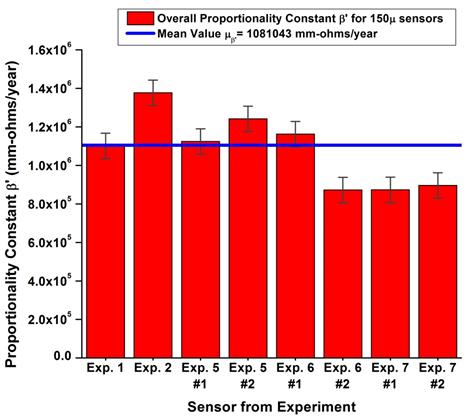
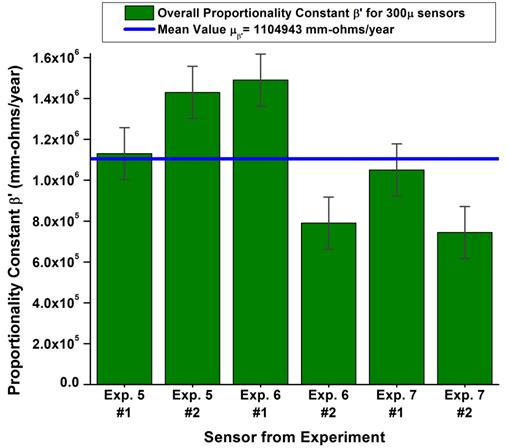
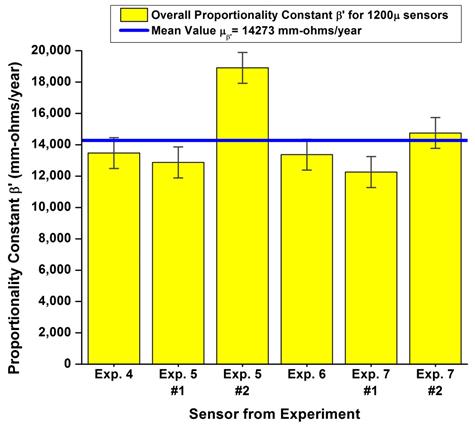
In order to obtain the bridge wire corrosion rate from the measurements of the LPR sensors, a relationship between corrosion rate of the wire and the Rp readings from the sensors was needed. The corrosion rate was calculated from measured Rp and from mass loss measurements on the corroding metal using the concept of equivalent weight and Faraday's Law (see appendix A for details on how to obtain the proportionality constant to convert the corrosion rate measurements from the sensor reading to the corrosion rate of the bridge wires). Figure 11 through figure 13 show the calculated overall proportionality constants from the experiments for 0.006-, 0.012-, and 0.048-inch (150-, 300-, and 1,200-µm) sensors, respectively. The mean values of the constants are also displayed. The constants for the 0.006- and 0.012-inch (150- and 300-µm) sensors are virtually identical. However, the constant calculated for the 0.048-inch (1,200-µm) sensor is two orders of magnitude smaller. This cannot be explained by the decreased sensitivity due to the larger interdigitation gaps of the 0.048-inch (1,200-µm) sensor. Stemming from this, higher Rp values would be expected for the 0.048-inch (1,200-µm) sensor compared to the 0.006- and 0.012-inch (150- and 300-µm) sensors. Consequently, the 0.048-inch (1,200-µm) sensor should have had higher constants than the rest of the sensors. Apart from this peculiarity with the order of magnitude of the constants calculated for the 0.048-inch (1,200-µm) sensor, the variance in constants calculated for the three sensor types are all reasonably low, suggesting a consistency of the results. This suggests that the proportionality constants obtained for LPR sensors were accurate, and so these LPR sensors could be considered as a valuable means for measuring corrosion rate of bridge wires.
1 inch = 25.4 mm
1 inch = 25,400 µm
Figure 11. Graph. Proportionality constant for 0.006-inch (150-µm) sensors
1 inch = 25.4 mm
1 inch = 25,400 µm
Figure 12. Graph. Proportionality constant for 0.012-inch (300-µm) sensors
1 inch = 25.4 mm
1 inch = 25,400 µm
Figure 13. Graph. Proportionality constant for 0.048-inch (1,200-µm) sensors
The multiple array sensor produced by Corr Instruments, Inc., was chosen as a corrosion rate monitoring sensor because of its geometry (a cylinder of similar diameter as a bridge wire fits perfectly inside the wire bundle) (see figure 14). These sensors were built specifically for this project and utilized electrodes of the same materials (steel and zinc) that are used in the bridge wires.
Figure 14 and figure 15 show the principle of a coupled multi-electrode corrosion sensor (CMAS). When a metal is covered by a corrosive electrolyte such as seawater or a thin film of brine formed by the deliquescence of salt deposits on the metal, corrosion may take place.(21) The corrosion may be localized or nonuniform even in most cases of general corrosion. Some areas of the metal corrode more, while other areas corrode less. The areas that corrode more are considered as the anodic areas, and the areas that corrode less are referred as the less anodic or the cathodic areas. Electrons released at the anodic areas flow to the cathodic areas (see top section of figure 15). Such electron flows represent the unevenness of the corrosion taking place on the metal surface. If the metal is divided into many small pieces, with some of them mainly covered by the anodic areas and other areas mainly covered by the less corroded or not corroded areas, and these small pieces are electrically connected together through an instrument externally, the electrons produced at the anodic areas would flow through the instrument.
Thus, the electron flows can be measured by the instrument and converted to nonuniform corrosion rate using Faraday's Law. This is the principle on which the multiple array sensor is based on, with the anodic pieces being called the anodic electrodes and the cathodic pieces the cathodic electrodes.
Dia = diameter.
1 inch = 25.4 mm
Figure 14. Illustration. Schematic description of CMAS probe
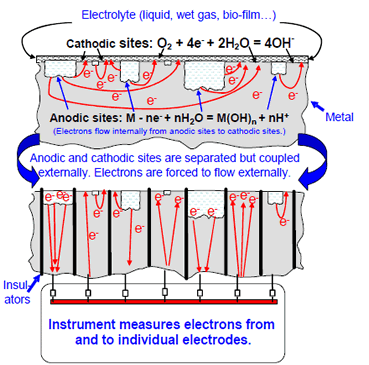
H = hydrogen; O = oxygen; M = metal, E = electron, and n = integer.
Figure 15. Illustration. Electrons flow from anodic areas to cathodic areas inside a metal
(top) and through a CMAS probe (bottom)
For this study, two types of CMAS were provided. One type was developed using a probe approximately 0.19 inch (5 mm) in diameter with eight high-strength steel filaments isolated with rubber (figure 16). The other type of CMAS sensors had the steel filaments replaced by zinc filaments in order to obtain measurements of the corrosion rates both of the steel core of the wire (once the wire coating has been depleted) and of the zinc coating itself.
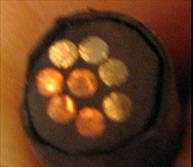
Figure 16. Photo. Close-up of a CMAS
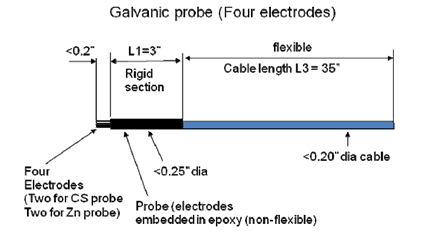
Figure 17 shows the schematic diagram of a galvanic probe for corrosion monitoring.(22) A sensing electrode made of a material whose corrosion rate is of interest is connected to a cathodic electrode via an ammeter, usually a zero-resistance ammeter. The cathodic electrode is made of a metal that has a higher corrosion potential than the sensing electrode. For instance, if the sensing electrode is made of CS and has a corrosion potential (open circuit potential) around -0.6 versus silver/silver chloride in seawater, the cathodic electrode is usually made of copper or stainless steel which has a corrosion potential near zero in seawater. The current from the ammeter is an indication of how much the sensing electrode is corroding under the polarized condition.
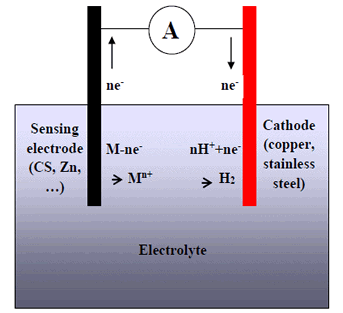
Figure 17. Illustration. Schematic diagram of a galvanic probe
Because the sensing electrode is at a potential that is higher than the normal natural corrosion potential, such current is not the corrosion current under natural conditions and is usually higher than the true corrosion current. However, if many such identical galvanic probes are used and installed at different places, these may provide good indications for the relative corrosivity of the environment at the difference places. If the corrosion rate at certain locations is measured using a quantitative probe (such as a CMAS probe), the corrosion rate at the different locations may be estimated using the results from the galvanic probes.
Temperature-Relative Humidity Precon HS2000V Sensors
The Precon HS2000V humidity sensors combine capacitive polymer sensing technology with a novel measurement method, eliminating the need for temperature correction and calibration by the user. The sensor, calibrated by the manufacturer, includes a thermistor and circuitry to correct for temperature and calculate the true relative humidity. The sensor provides both humidity and temperature outputs and is accurate to ±2 percent. The sensor covers a standard temperature range of -22 to 185 °F (-30 to 85 °C) and can operate within a humidity range from 0 to 100 percent.
The dimensions of the sensor are 0.89 inch (22.61 mm) long, 0.47 inch (11.94 mm) wide, and 0.365 inch (9.27 mm) tall (see figure 18). Since the goal was to install these sensors inside the cable, special protection was needed to protect the sensor from crashing because of the surrounding wire pressure. The performance of this sensor was tested through a series of laboratory tests.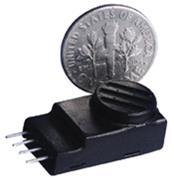
Figure 18. Photo. Precon HS2000V temperature/relative humidity sensor
AE
AE testing is a powerful method for examining the behavior of materials deforming under stress. AE may be defined as a transient elastic wave generated by the rapid release of energy within a material, as shown in figure 19. Materials produce AE when the local stresses around a discontinuity reach levels close to yielding. The high level of stresses can result in growing cracks and breaking fibers as well as many other modes of active damage in the stressed material.
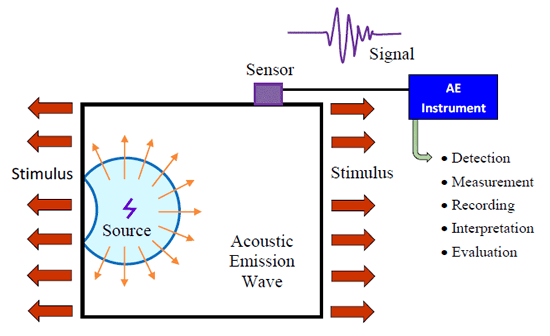
Figure 19. Illustration. AE technology principle
Small-scale damage is detectable long before failure, so AE can be used as a non-destructive technique to find defects during structural proof tests and high load periods in civil structures.
A typical AE system consists of the following:
By using several sensors distributed on the material under test or along a suspension bridge cable, the sources of AE, such as wire breaks, can be identified, detected, and located even in the mist of background noise caused by bridge movement and traffic.
MS
The phenomenon known as the MS effect consists of a small change in the physical dimensions of ferromagnetic materials by the presence of a magnetic field and, conversely, a physical deformation or strain producing a change of magnetization in the material.
Figure 20 shows the arrangement and instrumentation used for active inspection of structures using MS technology. The MS system consists of two parts: a means for applying a time varying magnetic field or detecting a magnetization change in the material (this is most conveniently achieved by using an inductive coil that encircles a component under inspection) and a means for providing direct current (DC) bias magnetic fields to the component (this is achieved by using a permanent magnet). The DC bias magnetic fields are used to enhance the efficiency of the energy transduction between electric and mechanical energies and to make the frequency of the elastic wave follow that of the electrical signals and vice versa. When a pulse of electrical current is applied to the coil in the transmitting MS, a time-varying magnetic field is applied to the component under inspection. This field in turn generates a pulse of elastic waves in the component which propagate in both directions along the length of the component. When the propagating elastic pulse reaches the coil in the receiving MS, it causes a change in the magnetic induction of the material via the inverse-MS effect. This change induces an electric voltage in the receiving coil that is subsequently amplified, conditioned, and processed.
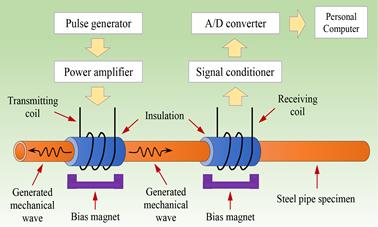
Figure 20. Illustration. MS instrument
Combination of AE and MS Technologies
As part of the development of a corrosion condition detection system for suspension cable bridges, a study on the potential combination of the AE and MS technologies to detect wire breaks and consequent reduction of the cable's cross section was performed. The principal idea behind AE-MS is that a baseline measurement of the state of the cable can first be established and then, by interrogating the system periodically, any variation of the wave propagation characteristics of the system can be related to a certain type of damage. In this type of measurement, the MS generates an acoustic wave that propagates along the cable, and its propagation characteristics are established by analyzing the response of the AE sensors to the propagating acoustic wave. If damage appears in the cable, the propagation characteristics of the cable change in the vicinity of the damaged area and thus the characteristics of the acoustic signal propagating along the cable. In this way, an array of AE passive sensors serves as continuous online monitoring detectors of wire brakes or other type of damage, and help evaluating the damage in combination with MS.
In this project, an attempt was made to merge these two technologies, and an extensive experimental phase was planned to test such a technique in applications related to suspension bridge cables. The following series of experiments were performed using a combination of AE and MS technologies and are described in the following subsections:
1. Detection of Simulated Corrosion-Induced Damage in a Single Wire:
A series of experiments were performed to determine the sensitivity of the MS generation and AE detection (MS-AE) combined technology to the progressive loss of wire cross section due to corrosion on a single wire. For this experiment, a single steel wire that was 179 inches (4,546.6 mm) long was instrumented with three receiving sensors: R1.5I with a resonant frequency of 15 kHz, R3I with a resonant frequency of 30 kHz (both AE sensors), and an MS sensor. Another MS sensor was used to generate propagating signals in the wire. The receiving and pulsing sensors were installed at the opposite ends of the wire. The AE sensors were connected to a Physical Acoustics Corporation (PAC) eight-channel AE system, while the MS sensor, consisting of a coil and a bias magnet, was connected to an MS NDT system. The experiments consisted in sending tone burst pulses of 32 kHz using the pulsing MS.
A baseline reading was taken with the wire in good conditions without any simulated corrosion-induced damage. Then, an area of simulated corrosion-induced damage was introduced in the wire by mechanically removing part of the cross section for a short segment of the wire. This area was located in the middle point between the sensors approximately 8 inches (203.2 mm) from the wire edge. Once the corrosion damage was simulated, then measurements were taken again. The area of simulated defect was progressively increased to occupy a larger percentage of the cross section in three stages, as indicated in table 6.
Table 6 . Damage induced in a single wire.
Stage |
Approximate Wire Diameter Reduction |
|---|---|
Baseline |
0.196 inches |
1 |
0.028 inches |
2 |
0.043 inches |
3 |
0.052 inches |
1 inch = 25.4 mm
As an example of how the signals propagating in the wire change as the simulated corrosion area increased, figure 21 through figure 24 show the waveforms recorded with the R3I sensor at different stages of damage on the wire. These waveforms represent a total of six times the signal traveling back and forth along the wire. Each one of the echoes represents a reflection of the signals from the back end of the wire. In figure 21, the time elapsed between each of the echoes can be used to estimate the propagation velocity of the wave along the wire, which in this case was calculated as 50,000 inches/s (1.27 mm/µs).
The waveform in figure 22 shows that as soon as the cross section of the wire was reduced by the introduction of damage, additional echoes appeared between the signals corresponding to the full wire length. These new echoes correspond to reflections produced by the damaged area.
As seen in figure 23, as the cross section area of the wire is further reduced in stage 2, the amplitude of the echoes corresponding to the damaged area decreased significantly. Finally, in stage 3, the whole signal was severely affected by a notorious loss in amplitude and by a widening of the echoes corresponding to the edge of the wire and to the corrosion area (see figure 24).
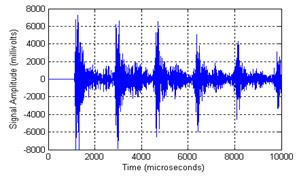
Figure 21. Graph. Acoustic signals recorded on a single wire by the R3I sensor—baseline
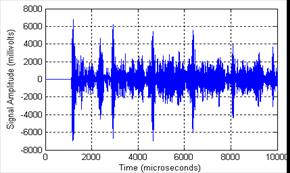
Figure 22. Graph. Acoustic signals recorded on a single wire by the R3I sensor—stage 1
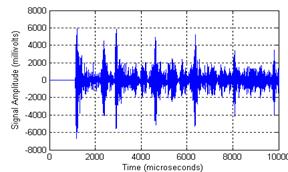
Figure 23. Graph. Acoustic signals recorded on a single wire by the R3I sensor—stage 2
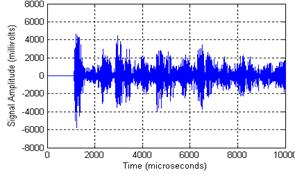
Figure 24. Graph. Acoustic signals recorded on a single wire by the R3I sensor—stage 3
A plot of the change in maximum amplitude detected in the wire as a function of the reduction in cross section area as indicated in table 6 for the R3I and MS sensors is shown in figure 25 . The results for sensor R1.5I were very inconsistent and are thus not included in this report.
The curves in figure 25 show that there is a clear reduction on the maximum amplitude of the signals traveling along the wire as the damaged area increases for both the R3I and the MS sensors. The amplitude drop for the R3I is approximately 11 percent and approximately 31 percent for the MS sensor. The drop is monotonic for the R3I with incremental drops as the damage increases, while the MS sensor dropped quickly for stage 1, increased slightly for stage 2, and dropped again for the last stage. Most likely this is a result of constructive and destructive interference in the wire, since the wavelength is approximately six times larger than the wire diameter.
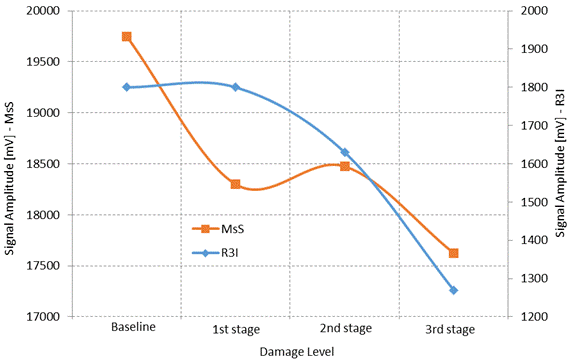
Figure 25. Graph. Maximum amplitude of the acoustic signals propagating along a single
wire as function of the reduction in cross sectional area for the R3I AE and MS sensors
In summary, the R3I sensor and the MS are more sensitive to changes in the cross section area of a single wire than the R1.5I sensor.
2. Detection of Simulated Corrosion-Induced Damage on a Single Wire Inside a Five-Wire Strand:
After demonstrating that the MS-AE technique sensitivity is enough to detect damage in a single wire, the next step was to evaluate the possibility of detecting the same type of damage in a single wire as part of a strand. For this test, five wires 170 inches (4,318 mm) long and 0.196 inch (4.98 mm) in diameter were assembled together in a strand. The R1.5I, R3I, and MS sensors were installed at the far end of the strand as receivers, while a MS device acting as a pulser was installed at the near end of the strand first on one of the outside wires and then in the center wire.
Signals with a frequency of 32 kHz were coupled into the strand, and a baseline measurement was performed. Next, an area of damage was introduced in one of the wires by mechanically removing part of the cross section. It was progressively enlarged in three stages until the wire was broken. The reduction in the wire cross section was similar as in the previous experiment (see table 6). As an example of the change in the acoustic signals propagating in the five wire strand, figure 26 through figure 31 show the waveforms detected by the three different sensors before and after the wire was broken.
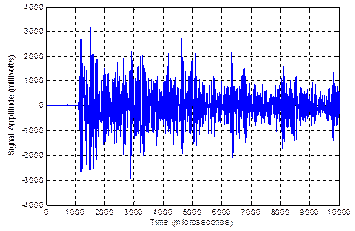
Figure 26. Graph. Acoustic signals recorded on the strand of five wires by the R1.5I sensor—baseline
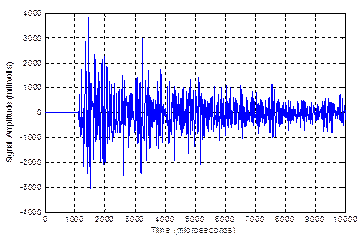
Figure 27. Graph. Acoustic signals recorded on the strand of five wires by the R1.5I sensor—after wire break
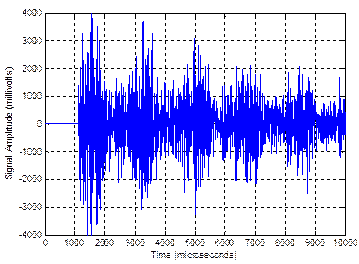
Figure 28. Graph. Acoustic signals recorded on the strand of five wires by the R3I sensor—baseline
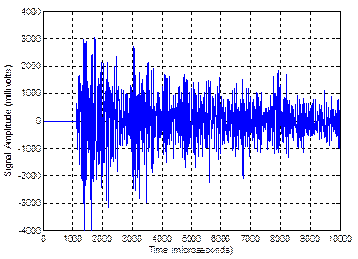
Figure 29. Graph. Acoustic signals recorded on the strand of five wires by the R3I sensor—
after wire break
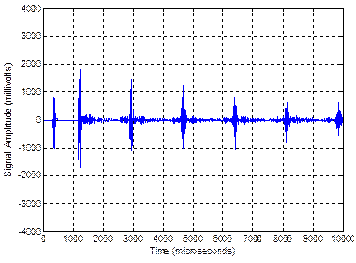
Figure 30. Graph. Acoustic signals recorded on the strand of five wires by the MS sensor—baseline
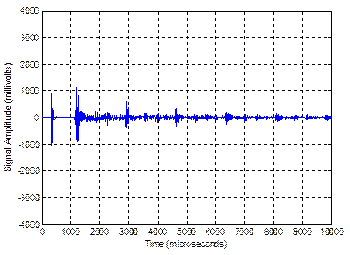
Figure 31. Graph. Acoustic signals recorded on the strand of five wires by the MS sensor—
after wire break
Using the same type of analysis discussed in the previous section, the signal's maximum amplitude was measured for each of the sensors at every stage during the damage simulation. The results of this analysis are presented in figure 32 and figure 33.
The R1.5I sensor detected a steady drop in signal amplitude, down to 50 percent of the baseline value at the transition third stage of damage, and then increased after the wire was broken. This increase could be related to constructive interference caused by signals reflected from the damaged area and the edge of the broken wire. Taking into account this increase, the total drop in amplitude between the baseline and the broken wire was approximately 34 percent. The R3I sensor showed a small increase in amplitude at the first stage of damage and then decreased steadily to 43 percent of the baseline value.
Finally, the data from figure 32 and figure 33 show that the total drop in amplitude between the baseline and the broken wire is almost 50 percent for the MS mounted in the outside wire and almost 90 percent for the inside wire.
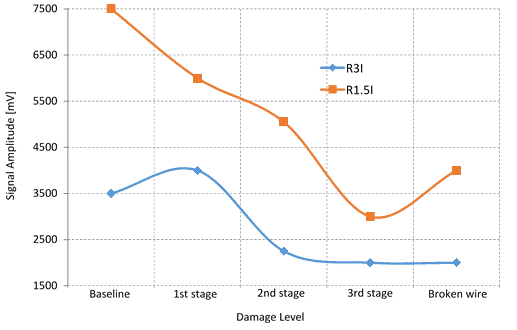
Figure 32. Graph. Maximum amplitude of the acoustic signals propagating along the
five-wire strand as function of the reduction in cross section area in a single wire for R1.5I
and R3I sensors
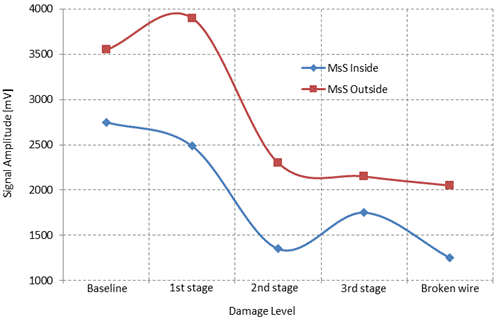
Figure 33. Graph. Maximum amplitude of the acoustic signals propagating along the
five-wire strand as function of the reduction in cross section area in a single wire for MS
located in one of the outside wires and in the center wire
In summary, both AE sensors and MS in the outside and center wire show a net decrease in amplitude as the damage progresses in the five-wire strand.
3. Detection of Wire Breaks in a Strand Mockup:
In this series of tests, a strand consisting of 127 wires 0.196 inch (4.98 mm) in diameter and arranged in a hexagonal pattern was monitored as 5 wires in the strand were cut. The length of the strand was 19 ft (5.78 m). For this test, the R1.5I and R3I sensors were used as receivers, and the MS sensor was used as a pulser. The strand was monitored before any of the wires were cut to create a baseline as well as every time after a wire was cut. The R1.5I sensors were located 5 and 17 ft (1.53 and 5.16 m) from the MS, while the R3I sensors were located at 5, 10, and 17 ft (1.53, 3.05, and 5.16 m) from the MS system. The wire cuts were located 13 ft (3.97 m) from the MS position. Figure 34 shows the location of the sensors and the wire cuts.
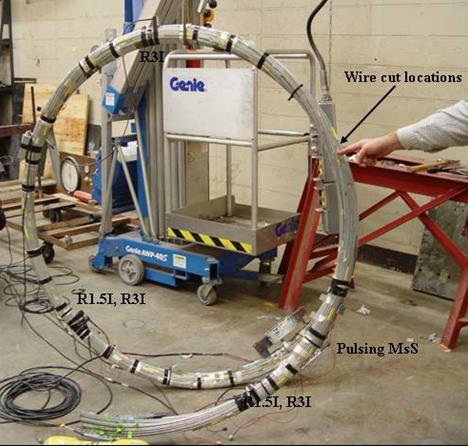
Figure 34. Photo. Location of the wire cuts and sensors on the strand
As an example of changes in the waveforms observed in this test, figure 35 shows the signals recorded with the R1.5I sensor at the 17-ft (5.16-m) location beyond the point of the wire cuts. There was no drop in amplitude from the baseline value (see figure 35a) as well as for the first three wire cuts (figure 35b, c, and d). There was a clear drop for the last two wire cuts (see figure 35e and f). Results for the R3I sensors in the same position showed similar results.
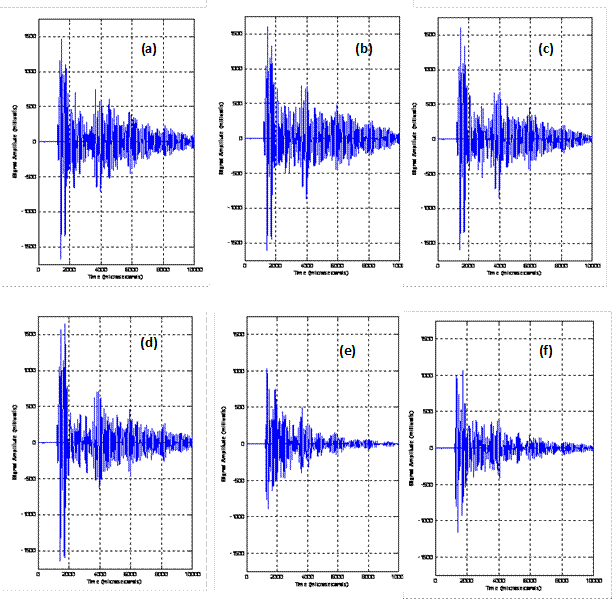
Figure 35. Graph. Acoustic signals recorded on the strand with the R1.5I sensor— (a) no damage, (b) 1 wire cut, (c) 2 wires cut, (d) 3 wires cut, (e) 4 wires cut, and (f) 5 wires cut
Figure 36 and figure 37 show the maximum amplitude detected by the sensors located before and beyond the wire cut locations (see figure 34). It is clear that the sensors located closer to the MS were affected in a different way by the wire cuts, as shown in figure 36. Either the amplitude values fluctuated around the baseline as for the R1.5I sensor or increased as for the R3I sensor. For the sensors beyond the wire cut location, the signal dropped suddenly after the fourth wire was cut. The drop in amplitude is approximately 30 percent of the baseline value for both the R1.5I and the R3I sensors. In terms of the cross section area of the strand, this means that the MS-AE technique is sensitive to losses in the cross section area larger than 3 percent.
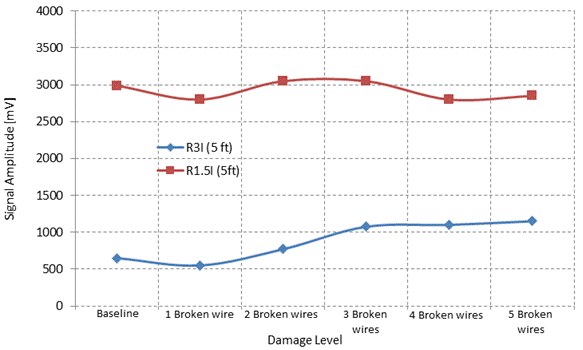
Figure 36. Graph. Maximum amplitude of the signals detected by the MS-AE technique— sensors located before the wire cut location
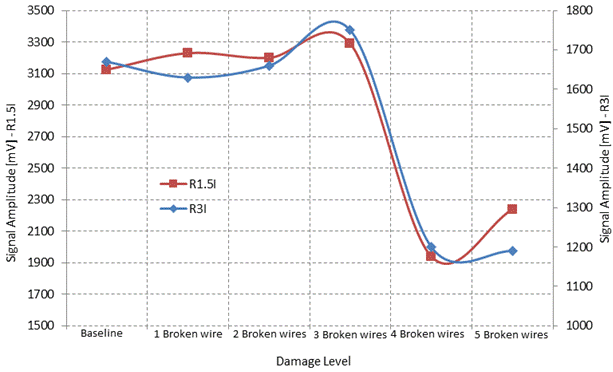
Figure 37. Graph. Maximum amplitude of the signals detected by the MS-AE technique—sensors located after the wire cut location
4. Detection, Localization, and Evaluation of Simulated Corrosion-Induced Damage in a Wire Strand Under Tension:
The idea behind this test was that the AE system, operating in a passive mode during the increasing tension periods, would detect and locate wire breaks in real time, while the MS system, operating in active mode during the holding tension periods, would be able to evaluate the damage in the strand created by the wire breaks. During the holding tension periods, the AE sensors would be synchronized with the MS sensor to function as detectors of the acoustic signal propagating along the strand. If there is any damage caused by wire breaks, the characteristics of the propagating signal produced by the MS would change. By comparing the signals after damage has occurred with baseline data, the extent of the damage could be assessed. In this way, the MS and AE sensors would function as an active-passive system for detection and location of wire break damage in the strand.
Strand Construction and Instrumentation:
The steel wire strand used in these experiments had a length of 148 inches (3,759.2 mm) and was made of 61 wires with a diameter of 0.196 inch (4.98 mm) arranged in a hexagonal pattern and mounted on two steel sockets. The strand was instrumented with eight R3I PAC AE sensors distributed on the sockets and at two locations along the strand. The position of the sensors is shown in figure 38.
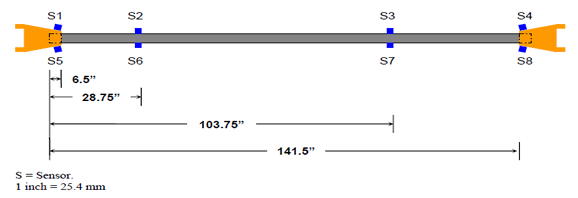
Figure 38. Illustration. Position of the AE sensors along the strand
Out of the 61 wires in the strand, 54 were notched, with the notches distributed along the cable at 5 different positions. The positions of the notches, labeled A to E, are shown in figure 39. A schematic of the strand cross section showing the 54 notched wires and the position and depth of each notch is shown in figure 40.

Figure 39. Illustration. Notch locations along the wire strand
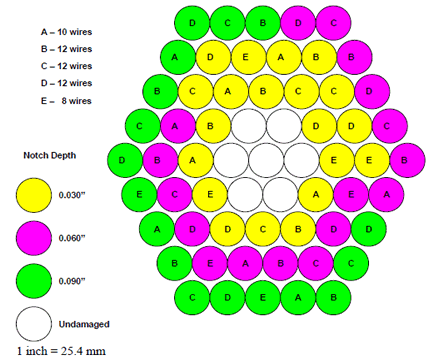
Figure 40. Illustration. Cross section of the wire strand showing position and depth of the notches along the strand length.
The instrumented strand was mounted on the tensile machine. The top end of the strand corresponds to the end where sensor 1 was mounted, according to figure 36 and figure 37. Once the strand was mounted in the tensile machine, the MS sensor was installed 116 inches (2,946.4 mm) from the top end of the strand. The AE sensors were connected to a PAC AE eight-channel Samos system, and the MS was connected to a computer controlled system. Figure 41 shows the strand mounted in the tensile machine as well as the position of the AE and MS sensors.
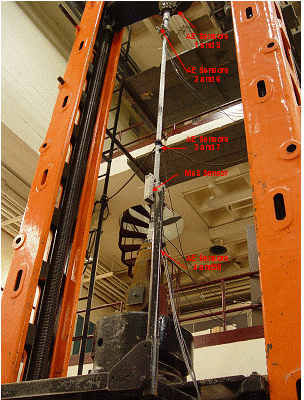
Figure 41. Photo. Wire strand mounted on the tensile machine and instrumented with AE
and MS sensors
Before applying any load, a series of pencil lead breaks (PLBs) were performed on the strand in order to verify the coupling of the AE sensors to the strand. Three PLBs were performed on the strand 4 inches (101.6 m) from each of the sensors. The average amplitude for each sensor is shown in table 7.
These results show that the transmission of the acoustic waves from the bundle to the sensors is better for the sensors mounted on the upper socket and on the clamp than for those mounted directly on the strand and on the lower socket. These results suggest that the best location for mounting sensors in a real cable may be the cable band and not necessarily directly on the cable.
Table 7 . Average signal amplitudes from PLB at sensor locations.
Sensor |
Amplitude |
Position Along the Cable (inches) |
|---|---|---|
1 |
80 |
6.5 (upper socket) |
2 |
75 |
28.75 (on clamp) |
3 |
66 |
103.75 (on strand) |
4 |
66 |
141.5 (lower socket) |
5 |
78 |
6.5 (upper socket) |
6 |
77 |
28.75 (on clamp) |
7 |
64 |
103.75 (on strand) |
8 |
69 |
141.5 (lower socket) |
1 inch = 25.4 mm
Detection of Wire Breaks During the Tensile Test of the Strand Using AE Sensors
Once the wire strand was mounted on the tensile machine and instrumented with the MS and AE sensors, it was subjected to an increasing tensile load until catastrophic failure occurred at an ultimate load of approximately 150,000 lb (68,100 kg). During the loading period, the AE sensors recorded all the acoustic activity that was above the threshold of 40 dB (1 mV in terms of voltage amplitude). This activity included friction between the sockets and the tensile machine, cracking on the epoxy used to join the strand to the sockets, adjustments of the strand under tension, friction between the wires in the strand, wires pulling out of the sockets, and failure of the wires.
Figure 42 shows the AE activity detected during the active load periods of the test in terms of the absolute energy released in the form of acoustic waves as a function of time. Superimposed with this AE data (red dots), the green trace represents the actual load being applied to the strand and read directly from the load cell. The load was monitored by the AE system at a rate of 10 times/s (10Hz) regardless of the amount of AE activity being detected by the AE sensors.
As it is observed in figure 43 in which the cumulative AE absolute energy is displayed as function of the load, there is very little AE activity below 30,000 lb (13,620 kg), and it increases steadily up to 136,000 lb (61,744 kg). At this point, the AE activity began to increase exponentially, an indication of impending catastrophic failure, which occurs at 150,000 lb (68,100 kg).
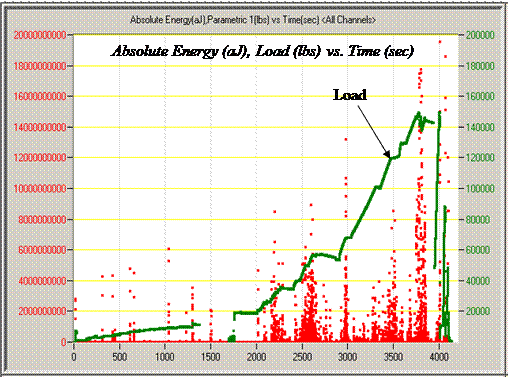
Figure 42. Graph. AE activity as a function of time during the tensile test of the wire strand
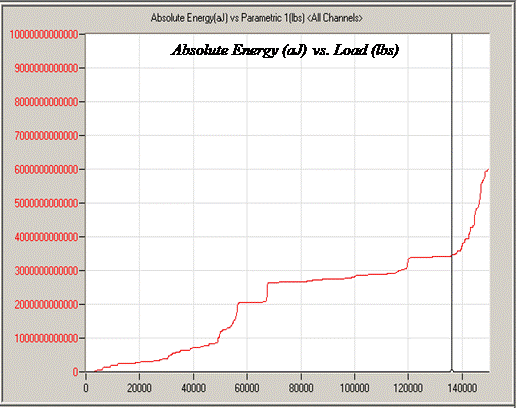
Figure 43. Graph. Cumulative AE absolute energy as a function of load
It was assumed that most of the activity below 30,000 lb (13,620 kg) was due to sources other than legitimate AE produced by wire breaks in the strand. After filtering the data to eliminate signals with very low energy and duration, different sensor groups were used to locate potential wire brakes in different notch positions. Table 8 shows the sensor groups with the corresponding area of coverage.
Table 8 . Sensor groups and corresponding coverage area.
Group Number |
Sensor Number |
Coverage Area |
|---|---|---|
1 |
S1 and S4 |
Notches A-E |
2 |
S5 and S6 |
Notch A |
3 |
S2 and S3 |
Notches B and C |
4 |
S6 and S7 |
Notches B and C |
5 |
S3 and S4 |
Notches D and E |
6 |
S5 and S8 |
Notches A-E |
7 |
S1 and S2 |
Notch A |
8 |
S7 and S8 |
Notches D and E |
Figure 44 and figure 45 show histogram plots of the AE events located by these sensor groups. For reference, the positions of the sensors are indicated on top of the plots. The y-axis shows the number of AE events, and the x-axis shows the location along the length of the strand. Figure 44 shows the event located by sensor groups 1, 3, 5, and 7, and figure 45 shows the events located by sensor groups 2, 4, 6, and 8. The events observed at the locations of the notches B, C, and D, which were 38, 74, and 110 inches (965.2, 1,879.6, and 2794 mm), respectively. These events all happened at loads higher than 30,000 lb (13,620 kg) and within ±2 inches (50.4 mm) of the nominal position of the notch site, as indicated in table 9.

Figure 44. Graph. Events located around notches B, C, and D located by sensor groups 1,
3, 5, and 7

Figure 45. Graph. Events located around notches B and D located by sensor groups 2,
4, 6, and 8
Table 9 . Events located by the AE system at notches B, C, and D.
Event |
Load |
Nominal |
Detected |
Difference in Position (Percent) |
Absolute Energy (aJ) |
|
|---|---|---|---|---|---|---|
1 |
39,259 |
40 (Notch B) |
39.0 |
-2.5 |
2.29E+09 |
|
2 |
39,702 |
40 (Notch B) |
38.6 |
-3.5 |
7.85E+05 |
|
3 |
45,259 |
40 (Notch B) |
38.5 |
-3.7 |
3.02E+05 |
|
4 |
56,475 |
40 (Notch B) |
39.2 |
-2.0 |
8.01E+05 |
|
5 |
56,584 |
40 (Notch B) |
41.2 |
3.0 |
5.02E+05 |
|
6 |
63,552 |
40 (Notch B) |
41.6 |
4.0 |
5.75E+05 |
|
7 |
109,934 |
40 (Notch B) |
40.5 |
1.2 |
7.00E+08 |
|
8 |
145,613 |
40 (Notch B) |
40.0 |
0.0 |
3.14E+05 |
|
1 |
46,312 |
74 (Notch C) |
74.0 |
0.0 |
8.29E+03 |
|
2 |
100,970 |
74 (Notch C) |
74.0 |
0.0 |
3.41E+05 |
|
3 |
118,879 |
74 (Notch C) |
73.2 |
1.0 |
6.34E+03 |
|
4 |
119,730 |
74 (Notch C) |
74.0 |
0.0 |
2.01E+03 |
|
5 |
143,013 |
74 (Notch C) |
74.0 |
0.0 |
9.96E+03 |
|
6 |
143,086 |
74 (Notch C) |
74.0 |
0.0 |
4.67E+03 |
|
7 |
143,141 |
74 (Notch C) |
74.0 |
0.0 |
6.58E+03 |
|
8 |
146,666 |
74 (Notch C) |
74.0 |
0.0 |
7.10E+04 |
|
9 |
148,616 |
74 (Notch C) |
74.0 |
0.0 |
3.41E+03 |
|
1 |
56,621 |
110 (Notch D) |
112.2 |
2.0 |
9.30E+05 |
|
2 |
139,232 |
110 (Notch D) |
111.2 |
1.1 |
3.13E+07 |
|
3 |
143,260 |
110 (Notch D) |
109.1 |
0.08 |
1.71E+06 |
|
4 |
144,322 |
110 (Notch D) |
110.3 |
0.03 |
2.96E+08 |
|
5 |
144,716 |
110 (Notch D) |
112.5 |
2.3 |
3.33E+09 |
|
6 |
147,737 |
110 (Notch D) |
110.1 |
0.01 |
3.85E+05 |
|
7 |
147,884 |
110 (Notch D) |
111.7 |
1.5 |
6.44E+05 |
|
8 |
149,037 |
110 (Notch D) |
110.4 |
0.04 |
6.00E+04 |
|
1 lb = 0.454 kg
1 inch = 25.4 mm
According to figure 44, figure 45, and table 9, there were a total of 25 events: 8 at notch B, 9 at notch C, and 8 at notch D. Figure 45 shows that 12 wires were notched at each one of these sites. If it is assumed that each one of the events corresponds to a notch wired breaking, then four, three, and four notched wires must have remained unbroken at the notch sites, respectively. A postmortem analysis of the failed strand corroborated that four unbroken notched wires remained at notches B and D and three remained at notch C. All these 11 notched unbroken wires have shallow notches 0.03 inch (0.76 mm) deep marked in yellow in figure 40. The events located by the AE sensors in notches B, C, and D were confirmed as wire breaks.
The AE system detected hundreds of events around notches A and E at 10 and 138 inches (254 and 3,505.2 mm) respectively, from the reference end of the strand, as shown in figure 46 and figure 47. In the figures, the y-axis shows the number of AE events, while the x-axis shows the location along the length of the strand.
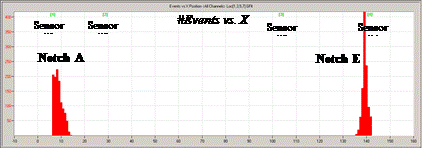
Figure 46. Graph. Events located around notches A and E located by sensor groups 1,
3, 5, and 7 (unfiltered data)
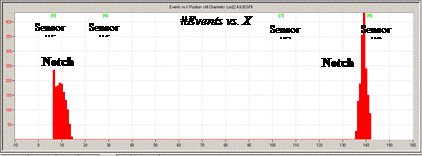
Figure 47. Graph. Events located around notches A and E located by sensor groups 2,
4, 6, and 8 (unfiltered data)
According to figure 39 and figure 40, there were only 10 wires at notch A and 8 at notch E, so the massive amount of activity observed could not be the result of potential wire breaks alone. This event accumulation was most likely produced not only by wire breaks, but also by potential pullout of wires from the epoxy filler and by cracking of the epoxy inside the sockets. An example of this type of failure in the lower socket is shown in figure 48.
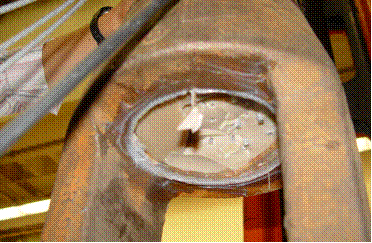
Figure 48. Photo. Failure of the epoxy filler inside the sockets
In order to better discriminate the potential wire breaks from the epoxy failure and wire pullouts, a series of filters were applied to the data in figure 46 and figure 47. It was expected that the wire breaks would happen at relatively high loads, and since the sensors were in close proximity to the potential wire break site, it was also expected that a signal from an actual wire break would have in fact saturated the AE channel, as shown in figure 49.
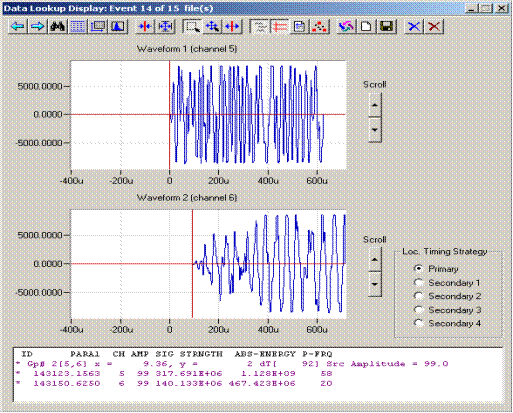
Figure 49. Illustration. AE signals from a potential wire break at notch A
A simple analysis of this type in conjunction with the requirement that the event was detected at a load 30,000 lb (13,620 kg) or higher led to the elimination of a massive number of events, leaving only 7 events for the notch A and 19 for notch E. Figure 50 and figure 51 show the location plot for these 26 events. In the figures, the y-axis shows the number of AE events, and the x-axis shows the location along the length of the strand.

Figure 50. Graph. Events located around notches A and E by sensor groups 1, 3, 5, and 7 (filtered data)

Figure 51. Graph. Events located around notches A and E located by sensor groups 2, 4,
6, and 8 (filtered data)
The postmortem analysis of the strand indicated that four notched wires were broken at notch A, and two wires pulled out of the epoxy filler in the socket. No wire breaks were found at notch E. However, 19 wires pulled out from the epoxy filler in the socket. Analyzing the absolute energy characteristics of the seven events from notch A, it was found that there were four events with energies larger than 5 x 10⁹ aJ. These events were most likely produced by the wire breaks. The next two in terms of energy could be produced by the wire pullout and the one with the lowest energy could have been produced by epoxy cracking. If the same absolute energy threshold that was used for the notch A is applied to the events from notch E, only 1 event out of the 19 detected could correspond to a wire break. However, as mentioned before, no wire breaks occurred at this location. So it can be concluded that all the events in notch E were created by wires pulling out of the epoxy filler.
Table 10 summarizes the absolute energy characteristics of the events located at notches A and E, their calculated position, the load at which they occurred, and the likely source (wire break (WB), pullout (PO), or epoxy cracking (EC)).
Table 10 . Events located by the AE system at Notch sites A and E.
Event |
Load |
Position (inches) |
Likely Source |
Absolute Energy (aJ) |
|
|---|---|---|---|---|---|
Nominal |
Detected |
||||
Notch A |
|||||
1 |
25,272 |
10 |
10.0 |
PO |
7.45E+08 |
2 |
35,069 |
10 |
10.3 |
PO |
1.21E+09 |
3 |
35,087 |
10 |
9.0 |
WB |
6.74E+09 |
4 |
35,087 |
10 |
10.7 |
WB |
6.74E+09 |
5 |
49,187 |
10 |
8.6 |
WB |
5.56E+09 |
6 |
84,893 |
10 |
10.6 |
EC |
2.37E+08 |
7 |
144,716 |
10 |
8.3 |
WB |
6.02E+09 |
Notch E |
|||||
1 |
41,148 |
138 |
138.6 |
PO |
3.14E+05 |
2 |
42,375 |
138 |
139.8 |
PO |
4.16E+06 |
3 |
43,510 |
138 |
137.9 |
PO |
2.88E+07 |
4 |
44,902 |
138 |
139.9 |
PO |
3.73E+08 |
5 |
67,388 |
138 |
139.3 |
PO |
3.29E+07 |
6 |
67,452 |
138 |
137.0 |
PO |
1.91E+07 |
7 |
67,901 |
138 |
139.2 |
PO |
8.16E+09 |
8 |
75,152 |
138 |
138.8 |
PO |
9.23E+06 |
9 |
86,349 |
138 |
139.3 |
PO |
1.71E+08 |
10 |
87,896 |
138 |
139.6 |
PO |
7.37E+06 |
11 |
96,283 |
138 |
139.5 |
PO |
4.53E+07 |
12 |
113,431 |
138 |
139.4 |
PO |
3.03E+06 |
13 |
113,431 |
138 |
139.2 |
PO |
4.20E+07 |
14 |
116,526 |
138 |
139.4 |
PO |
1.33E+08 |
15 |
129,096 |
138 |
139.5 |
PO |
1.19E+09 |
16 |
137,437 |
138 |
139.9 |
PO |
2.85E+09 |
17 |
137,437 |
138 |
139.5 |
PO |
3.70E+09 |
18 |
145,750 |
138 |
139.4 |
PO |
2.40E+09 |
19 |
145,750 |
138 |
139.0 |
PO |
1.03E+07 |
1 lb = 0.454 kg
1 inch = 25.4 mm
Detection and Localization of Corrosion-Induced Damage by MS-AE Combined Techniques:
As mentioned in the introductory section, the potential combination of AE and MS techniques was also investigated during the tensile test of the strand. The principle is that the MS actively generates an acoustic signal that travels along the wire, strand, or cable and is detected by the AE sensors. If there are changes in the cable caused by damage, the signals generated by the MS system and received by the AE sensors will change depending on the damage level and location. This combined technique requires a baseline measurement from which the comparison for subsequent measurements will be established. It is important to mention that this baseline measurement will not offer any information about pre-existing damage; it will only provide a platform for evaluation of new damage.
Baseline Measurements on the Strand:
In order to establish a common reference point for measurements with no load applied to the strand, the MS was pulsed using a tone burst signal with central frequency of 64 kHz at a rate of 10 Hz. This acoustic wave propagated along the strand and was detected by the AE sensors located at different positions. Figure 52 shows the baseline recorded waveforms detected by sensors 1 to 7, whose locations are provided figure 38. Only seven sensors were used in this operation because channel 8 was used to synchronize the AE system with the MS system, as can be seen in the waveform corresponding to channel 8 in figure 52.
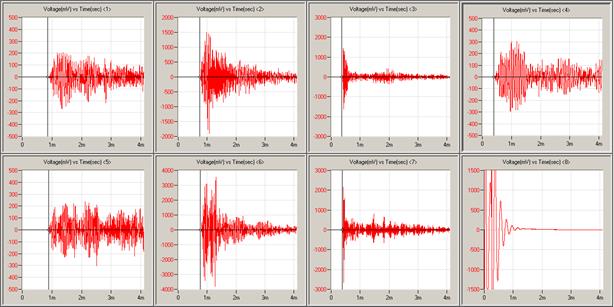
Figure 52. Graph. Baseline acoustic signals detected by the AE sensors along the strand
The increasing delay in the arrival of the signals corresponds to the increasing distance between the MS and the position of the AE sensor along the strand. This delay was used to calculate the average propagation velocity of the elastic wave along the wires, which resulted in an average value of 193,800 inches/s (4.92 mm/µs). The waveforms can also provide valuable information about the loss of different frequency components as the signal travels along the strand. For this purpose, the power spectra of the signals from figure 52 were extracted and analyzed. The results indicate that the peak frequency of the signals shifts to lower frequencies as the acoustic wave propagates along the strand away from the MS (see table 11).
Sensors 3 and 7, located directly on the cable and closer to the MS magnet, showed the highest peak frequencies of 59.5 and 50.1 kHz, respectively. Sensors 2 and 6 showed a decrease in peak frequency down to 49.8 and 48.8 kHz, respectively, while sensors 1 and 5 showed a severe decrease to 15.6 and 18.5 kHz, respectively. It is important to note than the decrease in peak frequency value of the last two sensors, as the decrease in sensor 4 (decreased to 15.6 kHz), was amplified by the fact that sensors 1, 5, and 4 are mounted on the steel sockets, which introduces an extra interface that the signal has to go through in order to reach the sensors, therefore increasing the attenuation of the high frequency components of the signal. This fact has to be taken into account when selecting the frequency of the AE sensors and their locations for installation on a real suspension bridge cable.
Table 11 . Amplitude and peak frequency of acoustic signals produced by the MS device and detected with AE sensors.
Sensor |
Amplitude |
Peak Frequency |
|---|---|---|
1 |
0.205 |
15.6 |
2 |
1.493 |
49.8 |
3 |
1.475 |
59.5 |
4 |
0.303 |
15.6 |
5 |
0.240 |
18.5 |
6 |
3.575 |
48.8 |
7 |
2.128 |
50.0 |
Measurements During Strand Loading:
MS-AE measurements were performed at several points during the tensile test. During the measurements, the load was held constant at different levels, and the MS was pulsed for a period of approximately 20 s, during which the AE sensors recorded the acoustic signals propagating along the cable. As an example of the changes in the signal characteristics, figure 52 shows the signals detected by sensors 2, 3, 6, and 7 during the load holds at 34,000 and 142,000 lb (15,436 and 64,468 kg), respectively. These sensors covered the area between the MS and notches B, C, and D. According to the previous results, most of the damage that led to failure of the strand happened at these three positions.
The data in table 10 indicate that no wire break had occurred at 34,000 lb (15,436 kg) in notches B, C, or D. Thus, the signals in figure 53 can be considered representative of the strand with full cross section. The signals detected by the same sensors during the hold at 142,000 lb (64,468 kg) are shown in figure 54. According to the previous results, at the tensile load of 142,000 lb (64,468 kg), 13 wire breaks had occurred at this point in the test, which is reflected in the clear reduction in amplitude of the signals in all the sensors. This reduction in amplitude is approximately 50 percent across the four sensors. Ideally, these changes in signal characteristics could be related to a known damage level, in this case a known reduction in the strand's cross section. An extensive analysis was performed in the different features of the signals detected at different levels of damage produced in the strand during the tensile test.
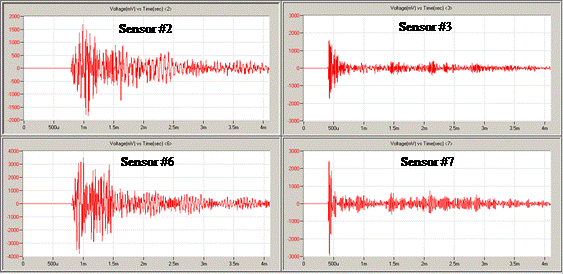
Figure 53. Graph. Acoustic signals detected by the AE sensors 2, 3, 6, and 7 during the
hold at 34,000 lb (15,436 kg) (no damage)
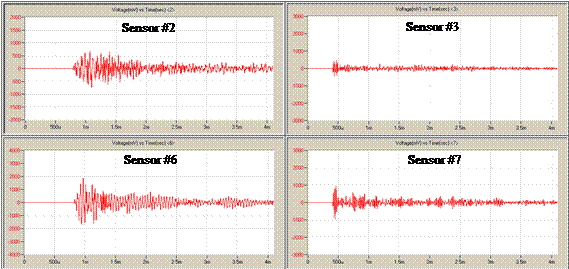
Figure 54. Graph. Acoustic signals detected by the AE sensors 2, 3, 6, and 7 during the
hold at 142,000 lb (64,468 kg) (severe damage)
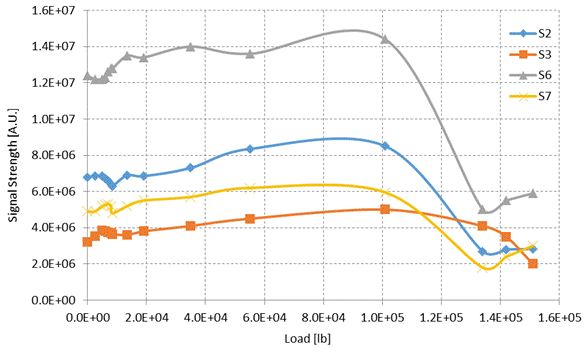
This analysis revealed that the signal feature that correlated better with the progression of damage in the strand is the signal strength. Figure 55 shows a plot of signal strength versus load on the strand for sensors 2, 3, 6, and 7. It is clear from these plots that there is an increase in the signal strength with load on the strand up to approximately 100,000 lb (45,400 kg). This increase is caused by changes in the strand as the wires get tensioned and by the fact that the attenuation of the signal in the strand decreases due to a better consolidation of the wires. However, according to figure 42 and figure 43, at 100,000 lb (45,400 kg), there is significant damage in the strand. It is at this point where the signal strength starts to drop substantially, with increasing load and more damage being produced in the strand.
1 lb = 0.454 kg
Figure 55. Graph. Signal strength as function of load for sensors 2, 3, 6, and 7
In order to decouple the effect of load and correlate the change in signal strength directly to damage, the changes measured by sensors 2, 3, 6, and 7 were plotted against the actual loss in strand cross section according to the sequence of wire breaks shown in table 10. The results are shown in figure 56.
Sensors 3 and 7 covered the area between the MS sensor and notch D. The results indicate that the signal strength decreases sharply after the damage accumulation reached 10 percent. The plots for sensors 2 and 6 showed a decrease in the signal strength after the damage accumulation reached 13 percent. This slight decrease in sensitivity may be the result of sensors 2 and 6 being mounted in a clamp, which causes the loss of high frequency components, as previously discussed in this section.
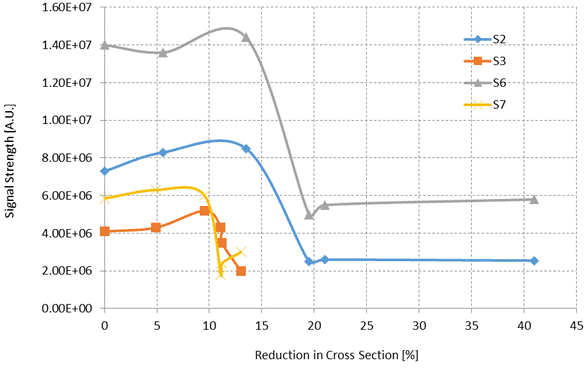
Figure 56. Graph. Signal strength versus cross section reduction for sensors 2, 3, 6, and 7
At the end of this test, it was shown that the AE-MS system detected and located 25 wire breaks in notches B, C, and D in the main body of the strand. The detection and location of these wire breaks was confirmed by a postmortem analysis of the strand. It is clear that the failure of the strand under tension was due not only to wire breaks but also failure of the epoxy resin in the socket. To that effect, AE sensors located a multitude of events at the two socket locations generated precisely by the pullout of wires from the epoxy resin. From the analysis, it was clear that those events carried acoustic energy lower than those events generated by wire breaks. This difference in energy levels allowed researchers to establish a good criterion to distinguish potential wire breaks from other types of failure mechanisms. To this effect, a threshold value of 5.0*109 AJ was established to separate the two different types of events at the socket locations.
As a conclusion of this experiment of a strand under tensile load, it was determined that the results obtained by the combined MS-AE techniques showed that the signal strength feature correlated well with the damage progression and that cross section losses in the strand cross section larger than 10 percent could be detected.
5. Detection, Localization, and Evaluation of Simulated Corrosion-Induced Damage in a Bundle of Seven Strands:
In this series of tests, 7 127-wire strands were assembled (labeled A through G) as shown in figure 57, figure 58, and table 12. In these tests, AE sensors (R61 with a resonant frequency of 60 KHz, R1.5I, and R3I) were used together. To simulate corrosion-induced damage, seven wires on one face of one of the strands were cut (strand is labeled "CT" in figure 58) at approximately half of the strand's length (between positions D and E). The MS receiver was placed 12 inches (304.8 mm) to the left of position A. The coil was placed either around this single strand or around the seven-strand bundle and was positioned with the pulser at the far end of the cable along with the magnet. Similarly to previous tests, when just a single strand was considered, the MS sensor, either alone or together with the AE system, was able to accurately locate the cut wires at the top of the bundle. Using an 8- or 16-kHz pulse, only sensor A (low frequency 15-kHz sensor) was able to detect the pulse. For the 32-kHz pulse, all sensors were able to detect the pulse, but the overall responses for the 30- and 60-kHz sensors were weak as compared to the previous testing.

Figure 57. Illustration. MS and AE sensors

Figure 58. Illustration. MS and AE strand configurations
Table 12 . AE sensor positions for MS-AE tests.
Position (Horizontal) |
Position |
AE Sensor |
Distance (Inches) |
|---|---|---|---|
A |
T |
R1.5I |
24 |
B |
T |
R6I |
26 |
C |
R |
R3I |
38.25 |
D |
T |
R3I |
119.25 |
E |
T |
R6I |
121 |
F |
T |
R6I |
189.25 |
G |
L |
R3I |
192.75 |
1 inch = 25.4 mm
To test the effectiveness of the system on cables with a larger number of wires, the strand with the seven cut wires was placed in the center with an additional six strands surrounding it. Three tests were conducted by changing the position of the electric coil. For test 5-1, the coil was wrapped around the entire bundle of wires. In test 5-2, the coil was moved to the center strand, while in test 5-3, coils were placed on the center strand as well as around the entire bundle of wires. The coil configurations are shown in figure 59 through figure 62. The AE sensors instead were placed along the same line and positions as shown in figure 57 and figure 58.

Figure 59. Illustration. Multibundle configurations for MS and AE testing—test 5-1

Figure 60. Illustration. Multibundle configurations for MS and AE testing—test 5-2

Figure 61. Illustration. Multibundle configurations for MS and AE testing—test 5-3
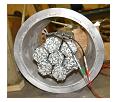
Figure 62. Photo. Seven-strand wire bundle with outside MS magnet
In the first test, the strand with cut wires was moved to the center of the bundle, and then the seven strands were strapped together at three locations, as shown by the yellow straps in figure 63, to enhance their contact and the transmissibility of the traveling elastic waves. The MS coil was then placed around the entire bundle of strands to generate a magnetic field within the bundle. The AE sensors were placed on the outer surfaces of the strands (see figure 64). For this test, as well as for tests 5-2 and 5-3, the excitation of the pulse was performed at 8, 16, 32, and 64 kHz.
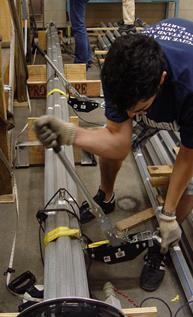
Figure 63. Photo. Compaction of strand bundle.
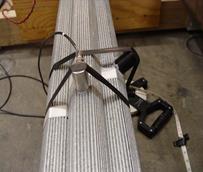
Figure 64. Photo. Mounted AE sensors
With the coil wrapped around the entire bundle, the MS pulse could not detect the cut wires located in the center strand at all four excitation levels. However, the AE sensors located along the outer strand (see figure 64) were able to detect the MS pulse. To understand why the MS pulse could not detect the broken wires, sensor A (the 15-kHz R1.5I sensor) was moved and mounted to the center strand where the cut wires were. This is the low frequency sensor, and it is more sensitive to the lower frequency guided waves generated by the MS system. After moving this sensor to the center strand, it was determined that the MS pulse was not reaching the center strand. It was found that while the MS pulse could reach the opposite end of the strand setup, it could only be detected along the portion of the strand that was in contact with the MS coil.
Two possible reasons for such lack of signal in the central strands were identified: lack of penetration of the magnetic field and lack of contact force between the strands. To better understand the effect of the compaction force on the signal transmission through the strands in test 5-2, the strands were tightened further to increase contact force between all the wires, and the coil was then moved to the center strand.
For test 5-2, the MS coil was moved to the center strand, while the AE sensors were left mounted on the outer circumference of the entire setup. In this configuration, the MS sensor was now able to detect the cut wires within the strand, while the AE sensors, still placed on the outer strands, were not able to detect the MS signal from the center strand despite the increase in compaction force. Again, the R1.5 low-frequency sensor was moved to various positions along the length and circumference of the cable. As previously observed in test 5-1, the AE sensor could only detect the MS pulse when it was mounted to the center strand that was in contact with the coil.
In the third and final test of this series, two MS coils were used: coil 1 was wrapped around the center strand, while coil 2 was wrapped around the entire seven-strand setup. Again, it was observed that for the AE sensors, the pulse was only detected if the sensor was mounted to the same surface that the coil was in contact with. Starting from the surface of the strand that was in contact with the coil, the MS pulse was detected on the outer layer but, already at the second layer below the surface, there was almost a 60 percent loss in the signal. At the third layer, the MS signal was lost. Based on the results from this test as well as previous tests, it was determined that the pulse from the coil was not strong enough to penetrate more than two layers into a strand and that the magnetic field was not strong enough to provide a complete saturation of the seven-strand setup. Additionally, it could be concluded that the increase in attenuation and loss of the signal was due to transmission of the wave energy into the adjacent wire bundles, which resulted in energy loss from the main pulse. Hence, by identifying potential limitations of this combined MS-AE technique, it is possible that a larger coil and a stronger magnetic field could overcome some of these effects which were limited by the existing hardware.
From this series of tests, the results showed that the combination of AE and MS technologies can provide complimentary information in the detection of existing wire breaks and corrosion-induced cross section loss, with the added benefit that AE can also help detect future wire breaks as they occur. However, the use of MS for locating existing wire breaks is limited to smaller bundles. In these series of tests, the maximum bundle size in which existing wire breaks could be detected was 127 wires, which is nothing compared to the thousands of wires that make a main cable of as suspension bridge. This makes the technique ideal for testing of suspender ropes (already being done) as well as in the anchorage where the main cable is divided into smaller bundles at the anchor/shoe. However, an increase in the bundle size (or in a multibundle configuration) greatly attenuates the pulse energy as it gets transmitted into the adjacent strands due to physical contact.
Main Magnetic Flux Method (MMFM)
Another interesting technology that can be considered as a direct sensing technology is represented by a modified version of the MMFM system. This type of technology is currently available to assess suspenders and has never been applied to a main cable of a suspension bridge before this project.
The fundamental principle of this technology is that when a steel wire, rope, or cable is longitudinally saturated by a strong magnetic field, the magnetic flux in the wire, rope, or cable is proportional to the wire's, rope's, or cable's cross sectional area, as shown in figure 65. When a magnetic field moves along the length of the cable, then the measured variation of the magnetic flux at a given location may be correlated to the change in cross sectional area at that location.
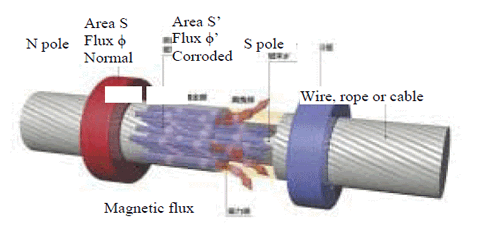
Figure 65. Illustration. Flow of magnetic flux in a wire rope
The MMFM system consists of a magnetizing unit, sensor units, and a computer (see figure 66). The magnetizing units consist of an electromagnet, a variable DC power supply, and a switch of polarity. The sensor units are comprised of the search coil, flux meter, Hall-sensors, and Gauss-meter. A computer controls the magnetizing current and records and analyses the measurement data. Figure 67 and figure 68 show the electromagnet, mounted on the cable mockup, and the MMFM system developed for this specific test.
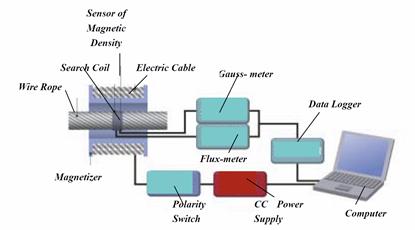
Figure 66. Illustration. MMFM measurement system
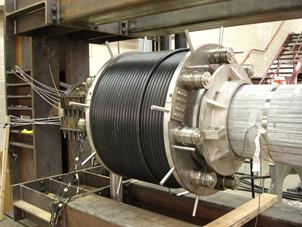
Figure 67. Photo. MMFM bobbin mounted on a cable mockup
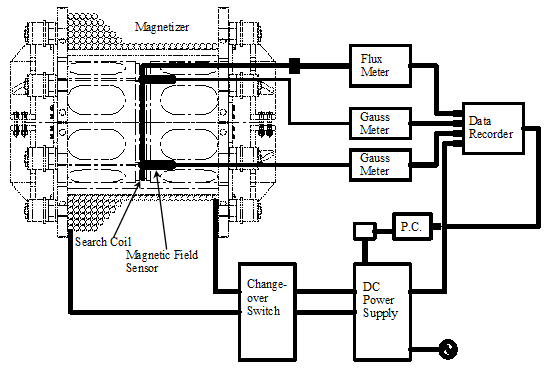
Figure 68. Illustration. Schematic of the MMFM measurement system used in this study
Tests were conducted at two different stages: before the accelerated environmental test started and after the accelerated environmental test was completed. The idea was to see the capability of the MMFM technology in dealing with cables of such large dimensions and its accuracy in detecting changes in cross sectional area. Since this was a validation test for such new technology, tests were conducted at two stationary positions along the length of the cable without moving the magnet from these two positions. These two positions were located 4.15 ft (1.265 m) from the south side of the cable mockup and 3.49 ft (1.065 m) from the north side of the cable mockup.
Tests Conducted Before Accelerated Environmental Test
In this test, since the cable was made of new wires, damage was simulated by adding wires on the surface of the cable and then removing a few of them at a time to test MMFM sensitivity. For each test condition, the test was repeated three times, and averages were obtained.
During each test, the cable mockup was saturated with a magnetic field of 55 kA/m, and measurements of the maximum magnetic flux were recorded. In figure 69, the results from a single test (location B, 45 additional wires added to the cable) are presented.
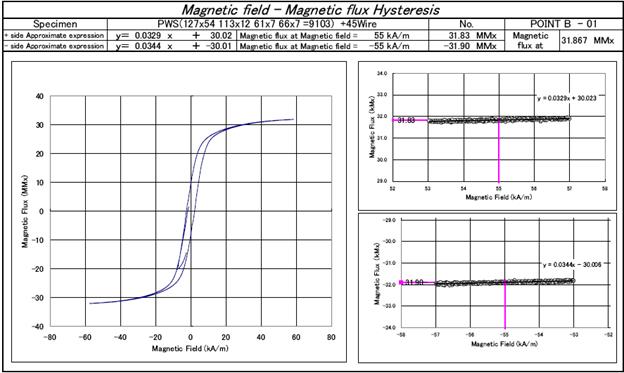
Figure 69. Illustration. Magnetic flux versus magnetic field plot for an MMFM test
The baseline (no wires added) showed a magnetic flux value of 31.842 and 31.688 MMx for locations A and B, respectively. This small difference (0.5 percent) between the magnetic fluxes at the two locations is within the measurement error range of the method (1 percent).
When wires were added to the surface of the cable, then the magnetic flux corresponding to a magnetic field of 55k A/m increased, reaching values up to 31.970 MMx at location A and 31.868 MMx at location B. Plotting the changes in magnetic flux with the increased number of wires, it is possible to see a linear relation between these two quantities (see figure 70).
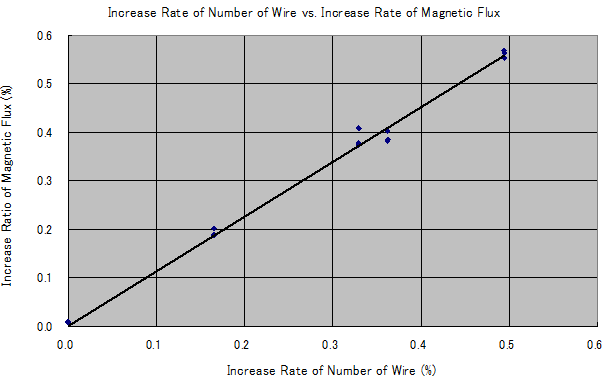
Figure 70. Graph. Increase in magnetic flux versus increase in the number of wires
This graph presents a very interesting result. In real-life applications, this graph should be read from right to left, considering that the number of "good" wires decreases. In any case, the results show that there is a linear relation between the number of wires that deteriorate and the reduction of magnetic flux. This could be quite useful in real bridge applications for an accurate estimate of the number of broken wires.
Tests Conducted After Accelerated Environmental Test
A second set of MMFM tests was conducted on the cable specimen after completion of the aggressive environmental test. The same locations, A and B, were considered, but no additional wires were added this time. The purpose was to determine whether a year-long experiment had induced reduction of the cable's cross section. The measurements of the magnetic flux at the two locations showed values slightly lower than the ones previously recorded. At location A, the average magnetic flux measured was about 31.682 MMx, slightly lower than 31.842 MMx previously measured. At location B, the new reading of the average magnetic flux was 31.652 MMx versus the original 31.688 MMx.
By looking at these measurements, it is clear that not much can be said about the reduction of the cable's cross section. The differences between the magnetic fluxes before the first and second test (0.5 and 0.11 percent) fall within the margins of errors of the measurements. As shown in the section related to the cable autopsy, in the two locations tested in the MMFM tests, the effects of the aggressive environmental tests resulted in extensive zinc corrosion with large amount of salt deposits. No substantial ferrous corrosion was measured at these two locations. More evident changes of the magnetic flux probably would have been recorded if the bobbin would have been moved along the entire length of the cable, where more extensive corrosion was induced; however, the technology is not ready for such a kind of applications. Nonetheless, the readings provided by the MMFM were consistent (not an increase of magnetic flux), and this is promising for future applications of such technology. It is recommended to test such a technology on more deteriorated cables.