U.S. Department of Transportation
Federal Highway Administration
1200 New Jersey Avenue, SE
Washington, DC 20590
202-366-4000
Federal Highway Administration Research and Technology
Coordinating, Developing, and Delivering Highway Transportation Innovations
| REPORT |
| This report is an archived publication and may contain dated technical, contact, and link information |
|
| Publication Number: FHWA-HRT-14-023 Date: May 2014 |
Publication Number: FHWA-HRT-14-023 Date: May 2014 |
The purpose of this project was to develop a robust NDT sensing system for corrosion monitoring. Following the placement of the sensors into the mockup cable specimen, the status of the sensors and the damage they sustained were only assumed based on the data recordings ascertained. The effects of the cable compaction and the environmental variables are of extreme importance in determining the durability and real-world functionality of the sensing system. Precon HS2000V temperature and relative humidity sensors, Analatom LPR sensors, and Corr Instrument CMAS sensors provided the most discernable and understandable data. While some of these sensors have malfunctioned, others have proven to detect strong signals. The conditions of various sensors were then evaluated and displayed to further determine any reasons for their functioning/malfunctioning.
On the surface, mostly all of the sensors appeared to not have been crushed by the cable compactions. Figure 156 shows the conditions of the exterior of the Precon sensor 1, BM sensor 1, and CMAS CS 1. They were placed in the lowest point of the cable cross section. The surrounding wires were not damaged by galvanic corrosion resulting from the potential difference between the wires and the stainless steel protective piping. The general state of the sensors and the surrounding wires shown in figure 156 is applicable to almost all the sensors throughout the cable.
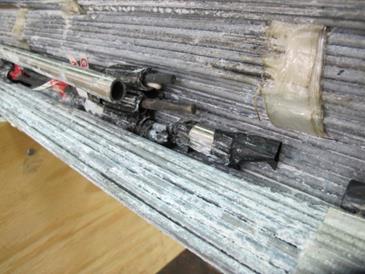
Figure 156. Photo. Sensors T1, BM1, and CMAS CS1
PRECON HS2000V TEMPERATURE AND RELATIVE HUMIDITY SENSORS
With the exception of a few, nearly all of the Precon sensors performed satisfactorily during testing. For example, sensor 3, located at the center of the cable, recorded consistent temperature and relative humidity values. The consistency of these recordings provided a sense of reliability in the functionality of this sensor, shown in figure 157 and figure 158. Figure 157 shows that the stainless steel piping with heat shrinking coating appears to have worked in protecting the sensor from crushing. Figure 158 indicates that no visual damage could be seen on the electrode itself.
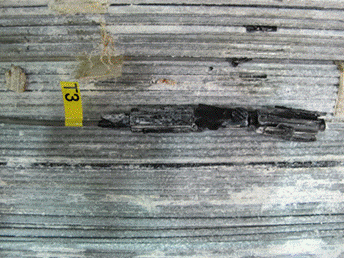
Figure 157. Photo. Precon HS2000V sensor 3 during cable disassembly
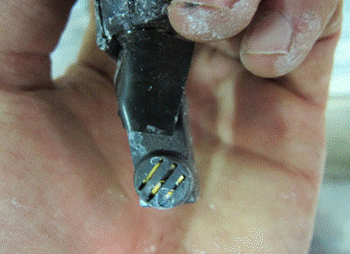
Figure 158. Photo. Close-up view of Precon HS2000V sensor 3 electrode
Similarly, sensor 13 provided reliable data that recorded large amounts of temperature and relative humidity fluctuations during testing. Figure 159 and figure 160 reflect the image of Precon sensor 3 with no visual damage being recognizable. Almost all the Precon temperature and relative humidity sensors look similar to sensors 3 and 13.
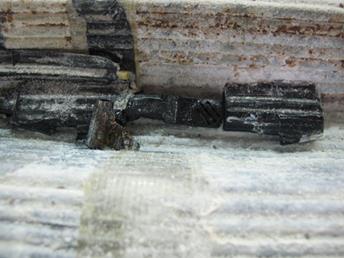
Figure 159. Photo. Precon HS2000V sensor 13 during cable dissection
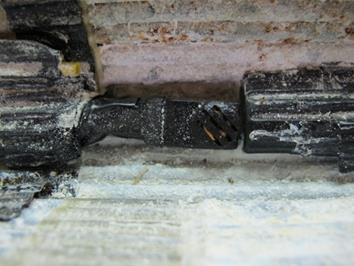
Figure 160. Photo. Close-up view of Precon HS2000V sensor 13 electrode
On the contrary, since the beginning of testing, sensor 7, located close to the surface on one of the diagonal diameters, malfunctioned, and no significant data were ever ascertained. The opening of the cable revealed the status of the sensor (see figure 161 and figure 162). During the cable autopsy, sensor 7 was discovered hanging from a piece of masking tape, as shown in figure 161, with the internal wires exposed (see figure 162). Short circuiting of the electrode and exposure problems may have led to the sensor malfunction.
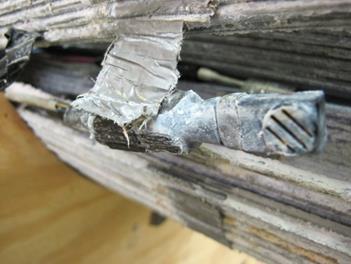
Figure 161. Photo. Precon HS2000V sensor 7 close-up of electrode during cable dissection
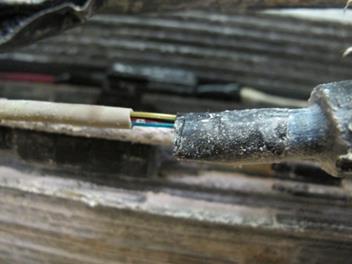
Figure 162. Photo. Precon HS2000V sensor 7 wires exposed
Unfortunately, not all sensors that malfunctioned showed problems that were as easily identifiable as those of sensor 7. For example, sensor 10, which was located close to the outer surface along one of the diagonal diameters, consistently recorded extremely elevated relative humidity levels. The analysis of sensor 10 (see figure 163) showed that the sensor suffered no damage, suggesting that sensor saturation during testing may have been the cause of the high levels recorded.
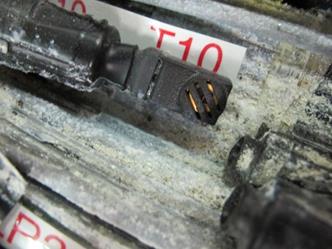
Figure 163. Photo. Precon HS2000V sensor 10 during cable dissection
As shown in the data analysis section, eight LPR sensors were placed in the cable cross section. From data analyses, it was found that only LPR sensors 3 and 4 provided consistent data that extended beyond noise level threshold, while the remaining six did not record any significant activity, posing the question of whether or not all the sensors were functioning correctly. Upon disassembly of the specimen, LPR sensor 4 was found to be in good condition. The protective casing had remained intact, leaving the sensor unscathed (see figure 164), and the sensor probe itself had not corroded nor did it appear to have been damaged in any other way (see figure 165). LPR sensor 3 was found to be in similar condition as LPR sensor 4. These two sensors were placed along the upper part of the inclined diameter in the right half of the cable cross section.
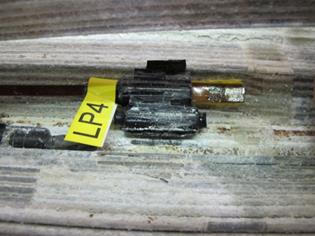
Figure 164. Photo. LPR sensor 4 during cable disassembly
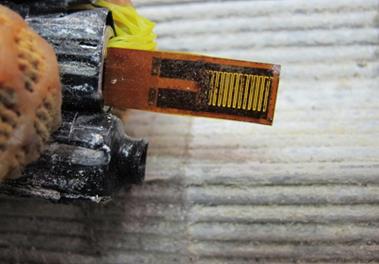
Figure 165. Photo. Close-up view of LPR sensor 4
Some of the remaining LPR sensors suffered extensive corrosion damage that, most probably, compromised their functioning. For example, LPR sensor 6 recorded fluctuations beyond noise at times; however, the data were too erratic and inconsistent to be deemed usable. LPR sensor 6 was located in its original place on the vertical diameter halfway from the center and the surface of the cable. This sensor was placed together with other corrosion rate sensors (see figure 166), and it appeared to have been severely corroded (see figure 167). The corrosion of the sensor electrodes of LPR sensor 6 provides an explanation for the erratic data recordings.
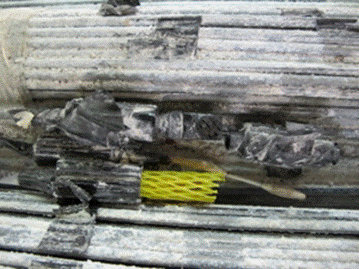
Figure 166. Photo. LPR sensor 6 during cable disassembly
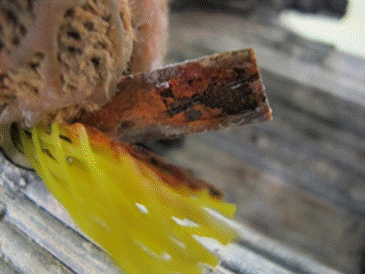
Figure 167. Photo. Close-up view of LPR sensor 6
As shown figure 166 and figure 167, LPR sensor 6 appeared to be in an area of heavy salt deposit, indicating that the area must have been subjected to aggressive corrosive action and justifying the presence of extensive corrosion products on the sensor.
Upon further inspection, however, all of the sensors were either corroded or the electrodes were disfigured. LPR sensor 5 was found to be corroded (see figure 168), while LPR sensor 7 was found to be both crushed and corroded (see figure 169).
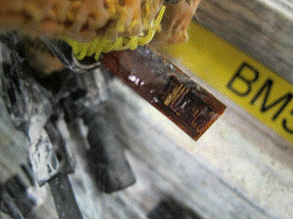
Figure 168. Photo. Corroded LPR sensor 5
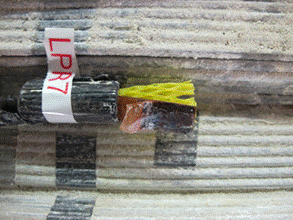
Figure 169. Photo. Corroded and disfigured LPR sensor 7
At first glance, it appeared that the sensors closer to the surface (e.g., LPR 7) were more likely to fail due to crushing; however, LPR sensor 8, which was located in a position analogous to LPR 7, did not get crushed from compaction forces (see figure 170). Rather, it seemed to have malfunctioned due to corrosion (see figure 171).
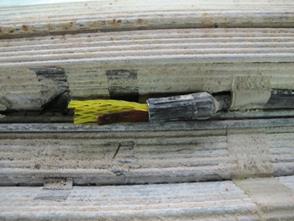
Figure 170. Photo. LPR sensor 8 during cable dissection
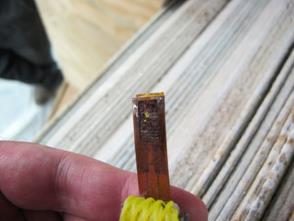
Figure 171. Photo. LPR sensor 8 close-up of corroded sensor electrodes
Similar corrosion and disfiguration of LPR sensors 1 and 2 were found. The difference in noise data based on crushing as opposed to electrode corrosion is currently unknown.
In conclusion, LPR sensors can provide accurate readings of the corrosion rate inside the cable even though the ones used in this series of tests showed substantial corrosion that could impair their functioning. However, in real applications, it is rare to find conditions so aggressive and sustained for such a long time as the one the cable specimen was subjected to. As a result, it is reasonable to expect a service life longer than the test duration. However, better protection from crushing should be provided.
Looking at the data collected during the experimental analyses, the measurement of the corrosion rate obtained from the CMAS CS sensor appeared to be promising, while the recorded data for zinc corrosion rates (CMAS Zn 2) did not. During the cable autopsy, it was found that the CMAS CS sensor 2 (located at the top of the cable cross section) (see figure 172) was not affected by the cable compaction and appeared to have resisted severe corrosion deterioration. Conversely, CMAS Zn sensor 2, located next to CMAS CS sensor 2, was crushed during cable compaction (see figure 173), which explained the lack of measurement data from it.
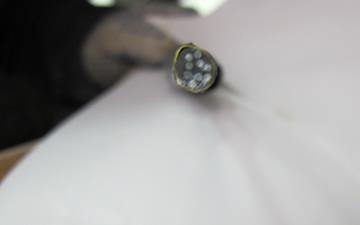
Figure 172. Photo. CMAS CS 2 intact
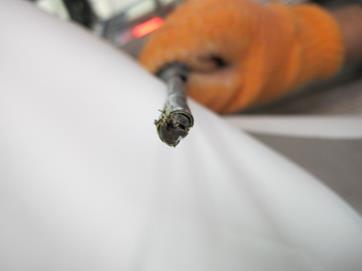
Figure 173. Photo. Crushed CMAS Zn 2 sensor
The recordings of these sensors were analyzed and have been previously presented. The noise signal recorded by the CMAS Zn sensor 2 was a result of the sensor malfunctioning due to crushing during cable compaction.
In conclusion, the CMAS sensors obtained reliable measurements of the corrosion rate for the steel, while no data were obtained from the CMAS Zn 2 sensor because it was crushed during compaction. Of the four CMAS sensors used in this study, two of them were badly crashed during compaction. However, it was decided to keep these sensors among those which would be tested in the field during the last phase of this project, with the recommendation of providing a stronger protection.
Most of the BM sensors did not record much corrosion activity beyond the noise level. During the cable autopsy, BM electrodes were found to have various amounts of corrosion, from heavy (sensor 7 in figure 174) to minimal (sensor 3 in figure 175).
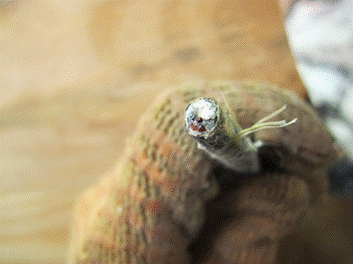
Figure 174. Photo. Heavy corrosion on BM sensor 7
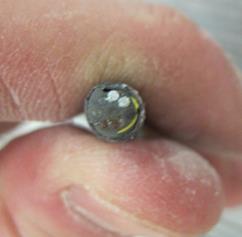
Figure 175. Photo. Minimal corrosion on BM sensor 3
Although these sensors did not record any reasonable level of corrosion in the accelerated corrosion tests, they were included in the final list of sensors to be tested in the field. Because of their almost identical resemblance to the CMAS sensors, it was considered appropriate to test the BM sensors in real-life conditions, paired with the CMAS sensors, using better care in protecting the sensing probe and the electronic encasement.
In conclusion, the indirect sensing system proposed for installation on a main cable of a suspension bridge in the City of New York comprised of the following sensors: