U.S. Department of Transportation
Federal Highway Administration
1200 New Jersey Avenue, SE
Washington, DC 20590
202-366-4000
Federal Highway Administration Research and Technology
Coordinating, Developing, and Delivering Highway Transportation Innovations
| REPORT |
| This report is an archived publication and may contain dated technical, contact, and link information |
|
| Publication Number: FHWA-HRT-14-023 Date: May 2014 |
Publication Number: FHWA-HRT-14-023 Date: May 2014 |
Once the wrapping was removed, a general inspection of the cable was performed. It appeared that the cable was heavily covered by a white powder, which was a mix of salt residue and zinc oxide. In a couple of spots along the length of the cable, small pockets of water were found on the side portion of the cable cross section. Heavy corrosion appeared at the location where the sensors' wires exited the cable. Apparently, the neoprene strap that served as a protection for the electric wires functioned as a moisture trap and kept the wires in a wet environment for a long time. In addition, areas of high ferrous corrosion occurring underneath the stainless steel straps were easily identifiable in the south part of the cable, as shown figure 123, whereas the north side of the cable seemed to have experienced little to no ferrous corrosion (see figure 121).
CORROSION UNDER NEOPRENE PROTECTIVE STRAP
Upon removal of the neoprene strap, it was found that large amounts of what appeared to be uniform corrosion occurred under the neoprene wrapping. Furthermore, the strap was still moist when removed from the cable surface. The area where the neoprene strap was is shown in figure 126. Figure 130 and figure 131 show progressively closer views of the corroded area. It is interesting to note that the highest density of corrosion appears to have occurred on the top side of the cable directly in line with the water and heat sources.
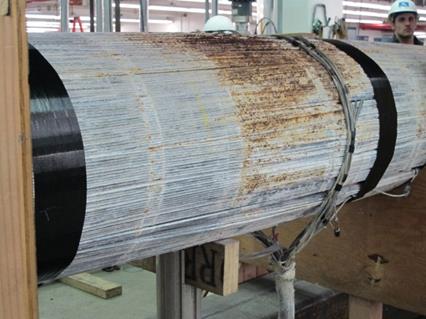
Figure 130. Photo. Corroded area under neoprene wrapping
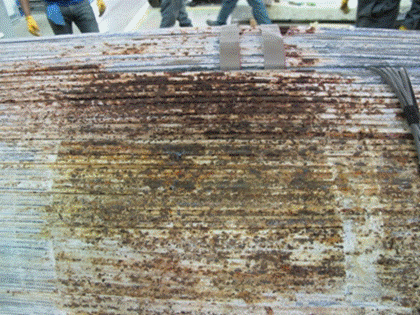
Figure 131. Photo. Close-up view of corroded area under neoprene wrapping
A close-up investigation of the top of the cable revealed stage 4 uniform corrosion for the wires on the outer layers in which close to 90 percent of the high-strength steel wires had undergone ferrous corrosion (see figure 132 and figure 133). This area was the one most exposed to higher temperatures (directly below the central heating lamp) and rain. The presence of the neoprene strap helped maintain high levels of humidity that, with high temperature levels, created ideal conditions for the progress of corrosion.
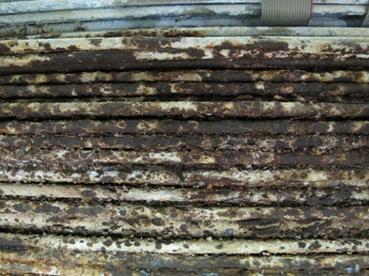
Figure 132. Photo. Wires with stage 4 corrosion on the top of the cable surface
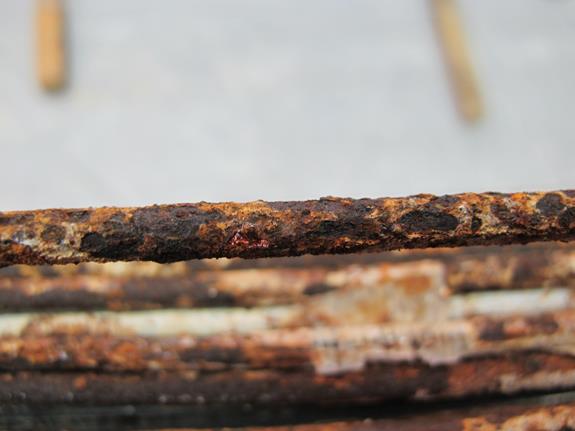
Figure 133. Photo. Close-up view of corroded wire
Galvanic as well as crevice and pitting corrosion in areas of moisture build-up occurred in this cable. The build-up of salt and/or zinc oxide as well as ferrous oxide below the stainless straps was easily identifiable, as shown in figure 122 and figure 123. These straps were made of unknown chemical composition, so they may have facilitated the onset of corrosion at their location. In addition, the small gaps between the strap and the outer wires ended up trapping rain water and moisture for a long time, initiating crevice and pitting corrosion. The corrosion of the wires under the stainless steel straps tended to increase toward the south side of the cable. As previously mentioned, the cable was constructed on a slight angle for drainage purposes, thus the increase of ferrous oxide was directly a result of the increased moisture content at the south side of the cable. Mild salt build-up, zinc oxide, and ferrous oxide may be seen under the stainless steel straps, as shown in figure 134.
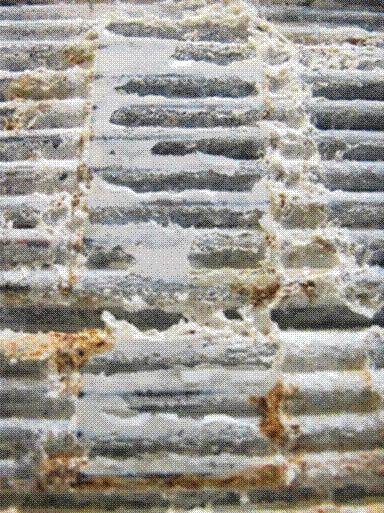
Figure 134. Photo. Salt build-up and zinc/ferrous corrosion product
At points closer to the south side of the cable, more critical forms of corrosion formed. The presence of high moisture, the potential difference between the stainless steel of the strap and the zinc-coated high-strength steel wires, and the presence of crevices created by the voids between the straps and the wires initiated heavy pitting corrosion (see figure 135 and figure 136). From this result, it is noteworthy that the use of stainless steel straps, which are commonly used in practice, should be carefully considered in environments with aggressive conditions.
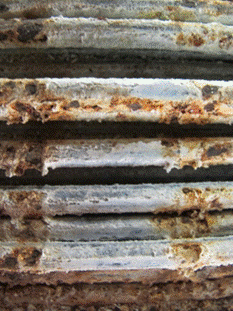
Figure 135. Photo. Pitting corrosion under stainless steel strap
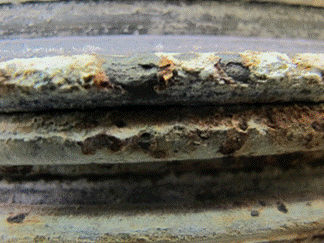
Figure 136. Photo. Close-up view of pit
The cable bands on either end of the cable mockup specimen presented another place for moisture entrapment. Similar to the stainless steel straps, the corrosion of the high-strength steel wires was greater at the south side of the cable. Looking eastward at the north side of the cable, it is possible to identify what may be assumed to be stage 2 corrosion (near complete zinc oxidation) and definite signs of stage 3 corrosion (ferrous corrosion is identifiable at approximately 20 to 30 percent coverage) (see figure 137 and figure 138).
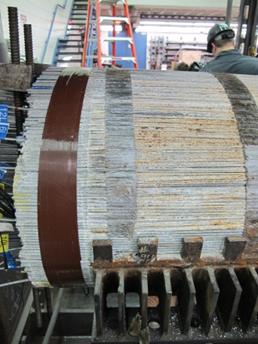
Figure 137. Photo. North end of cable with band removed
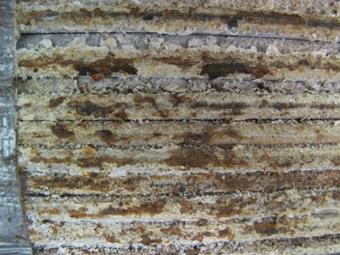
Figure 138. Photo. Wires at north end of cable with stage 3 corrosion
The corrosion under the cable band at the south end of the cable was more severe than that at the north end, as both the percentage of area covered by stage 3 corrosion (see figure 139), and the degree/depth of corrosion was greater at the south end (see figure 140).
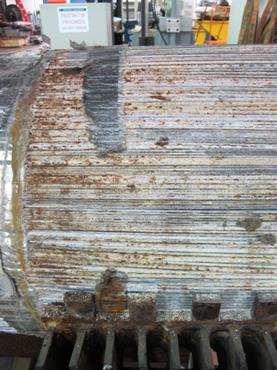
Figure 139. Photo. South end of cable with band removed
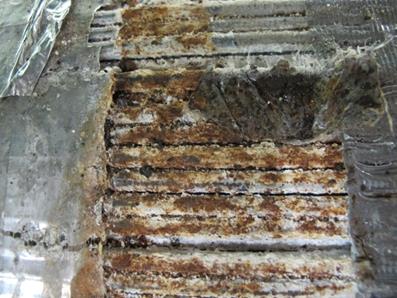
Figure 140. Photo. Wires at south end of cable with large percentage of stage 3 corrosion
The corrosion at the south end cable band was most heavily concentrated to the left portion of the outer surface. This was the result of an irregular (uncontrollable) path of water penetration. The ferrous oxide was found where the cable band began, suggesting an interaction between the galvanized wires, the steel cable band, and the surrounding environment.
The cable bands themselves also experienced significant amounts of corrosion. A high concentration of ferrous corrosion product was found on the cable band at the location where the cable band began on the south side of the cable. On the surface, the greatest amount of corrosion was seen on the teeth where the top and bottom cable bands met, which is an area directly in contact with air (see figure 141).
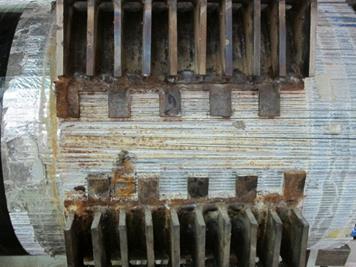
Figure 141. Photo. South end of cable highlighting teeth of cable band
On the underside of the cable band, a substantial amount of salt and/or zinc oxide and ferrous oxide was found (see figure 142). The concentration of ferrous corrosion was observed on the left side of the cable band.
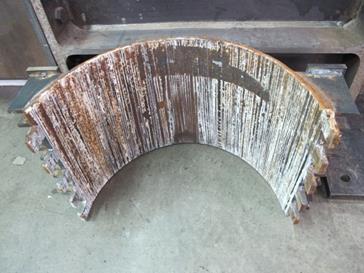
Figure 142. Photo. Interior of top of south side of cable band
Midway through the test program at points approximately 3.94 ft (1.2 m) from either end of the cable mockup, four holes were placed in the cable wrapping (see figure 143). Two 11.89-by-11.89-inch (30.5-by-30.5-cm) openings were made in the underside of the wrapping and at a location on the topside of the cable, and two 0.99-by-0.99-inch (2.54-by-2.54-cm) openings were made 3.94 ft (1.2 m) from the jacking end to facilitate the influx of moisture to the inside of the cable mockup and accelerate corrosion of the wires (see figure 144).
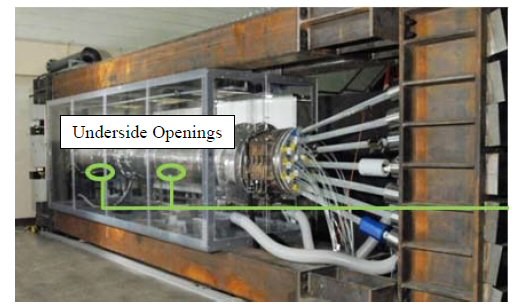
Figure 143. Photo. Mockup cable specimen within environmental chamber and location of
both holes
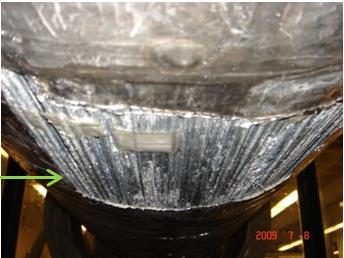
Figure 144. Photo. Image of one of the 11.89-by-11.89-inch (30.5-by-30.5-cm) holes
placed in the aluminum cable cover
During cable disassembly, the area highlighted in figure 144 was analyzed and documented. A solid white coating developed and enveloped the exposed wires (see figure 145 and figure 146). It is evident that ferrous corrosion was not present; the wires were covered by a thick layer of a white substance mainly composed of salt but also with the presence of zinc oxide (see figure 146). The presence of such a high concentration of salt in the test solution was justified by the fact that test conditions were supposed to create harsh conditions for the sensor system.
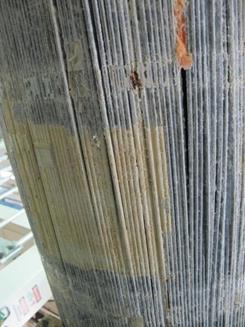
Figure 145. Photo. Product that formed where the 11.89-by-11.89-inch (30.5-by-30.5-cm)
hole was placed in the aluminum cable cover
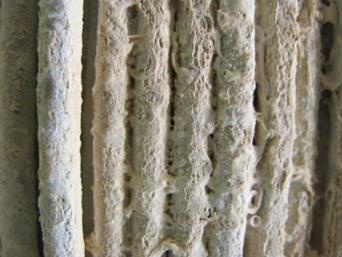
Figure 146. Photo. Close-up view of the product formed on the high-strength steel wires
With respect to the inner strands, the general observations were as follows:
The interior of the cable showed areas where heavy salt deposition occurred. These areas showed no particular pattern, following more the potential path of the water that penetrated inside the wrapping. Such areas were more frequent in the south end of the cable because of the specimen inclination. In addition to these areas of salt deposition, it appeared that extensive zinc coating corrosion occurred. Almost the totality of the inside wires were coated with a white dust, and once this dust was removed, the wires had a non-shiny zinc surface. Figure 147 shows the inner core of the specimen.
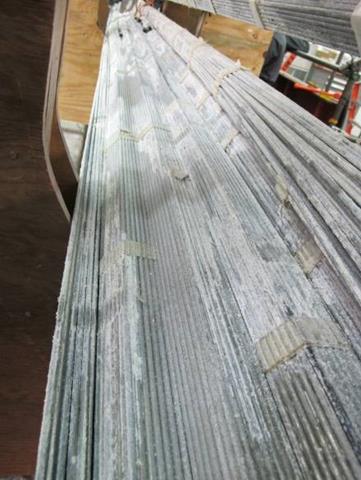
Figure 147. Photo. Inner core of the specimen during disassembly
Areas that were highly subjected to corrosion activity were those located adjacent to the nylon straps embedded within the cable (see figure 148). These straps were placed only at one location along the length of the cable to protect the electrical wires from the sensors during compaction operations. The gaps next to the straps were not sealed before the wrapping, with the intention that water could easily penetrate the interior of the cable to activate the sensors. In real-life applications, it is strongly recommended to seal these openings to avoid water penetration inside the cable.
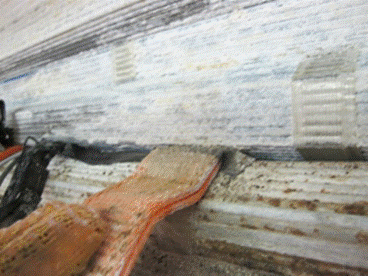
Figure 148. Photo. Orange nylon strap embedded within cable
Basically, these straps acted similarly to the neoprene wrapping. That is to say, the nylon straps held any moisture present within the cable for extended periods of time, keeping the solution necessary for the electrochemical corrosion reaction. The corrosion product formed in the distinct shape of the overlapping strap (see figure 149).
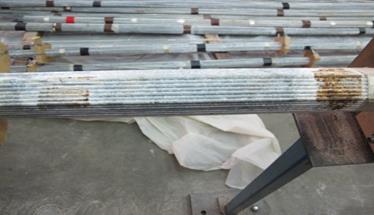
Figure 149. Photo. Corrosion formation at nylon strip location
As was seen with the corrosion associated with the neoprene wrapping, the corrosion around the nylon straps was fairly uniform. Heavy stage 4 corrosion was seen on the bottom of a strand in contact with a nylon strap (see figure 150).
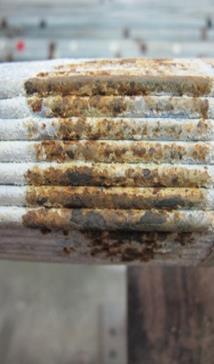
Figure 150. Photo. Close-up view of the wires with stage 4 corrosion
New strands within the cable mockup specimen that were adjacent to the two pre-corroded strands also experienced heavy amounts of corrosion on the contact surface between the strands. As was commonplace with the other corrosion documented, corrosion of strands adjacent to pre-corroded strands was heaviest in the central and southern sections of the cable due to the slight inclination of the cable specimen toward the jacking end. Following the nomenclature introduced in figure 116, strands 8R and 9R were pre-corroded with the intent of generating some hidden corrosion damage for the direct sensing technologies. Looking at the surface of strand 16R in contact with strand 9R, it was evident the presence of ferrous corrosion in stage 3, approaching stage 4, was seen in the area adjacent to strand 9R even on the north side of strand 16R (see figure 151). In fact, several sections displayed stage 4 corrosion and black oxides (see figure 152).
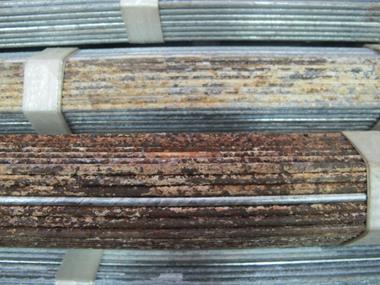
Figure 151. Photo. North end of cable—pre-corroded strand 9R (bottom) and adjacent side
of strand 16R
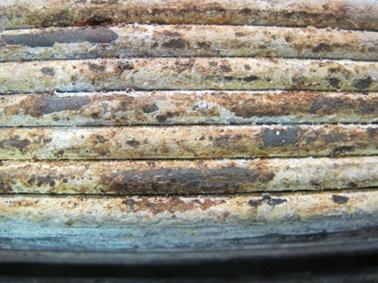
Figure 152. Photo. North end of cable close-up of 16R showing stage 3 corrosion
The effect of the contact between the corroded strand and the initially uncorroded strand was evident. Even greater amounts of ferrous corrosion were seen on the southern end of strand 16R (see figure 153). At the southern end, nearly the entire adjacent face had undergone stage 4 corrosion (see figure 154 and figure 155). Once again, it appears that the slight angle at which the cable sat caused a greater amount of moisture build-up in the southern end of the cable; however, unlike the corrosion under the stainless steel straps, the extent of the corrosion caused by the pre-corroded strands did not differ drastically from one end to the next. The corroded surface of the pre-corroded strand provided more surface area for water particles to adhere to, thereby increasing the time of wetness of the material, the time of wetness on the adjacent strand face, and the length of the corrosive electrochemical reaction.
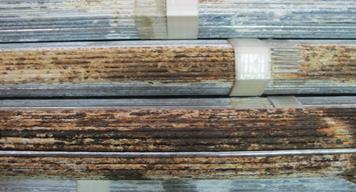
Figure 153. Photo. South end of cable pre-corroded strand 9R (bottom)
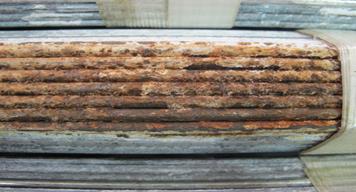
Figure 154. Photo. South end of cable adjacent side of strand 16R
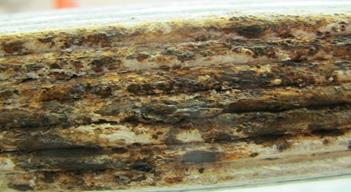
Figure 155. Photo. South end of cable close-up of 16R showing stage 4 corrosion