U.S. Department of Transportation
Federal Highway Administration
1200 New Jersey Avenue, SE
Washington, DC 20590
202-366-4000


Skip to content
Facebook iconYouTube iconTwitter iconFlickr iconLinkedInInstagram

Federal Highway Administration Research and Technology
Coordinating, Developing, and Delivering Highway Transportation Innovations

 
REPORT
This report is an archived publication and may contain dated technical, contact, and link information
Back to Publication List        
Publication Number:  FHWA-HRT-14-023    Date:  May 2014
Publication Number: FHWA-HRT-14-023
Date: May 2014


Federal Highway Administration Design Manual: Deep Mixing for Embankment and Foundation Support

APPENDIX B: SAMPLE DATA

This appendix provides temperature, relative humidity, and corrosion rate measurements recorded by the proposed monitoring system in the interior of one of the main cables of the Manhattan Bridge in the City of New York.
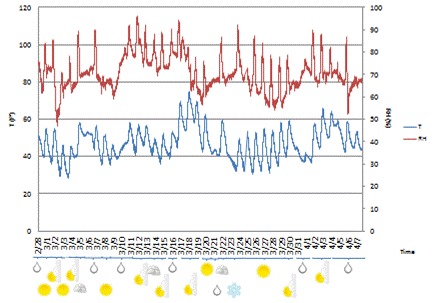
This graph shows temperature and relative humidity recorded by sensor A4 on the Brooklyn side of the Manhattan Bridge during March 2011. The left y-axis shows temperature from 0 to 120 °F (0 to 48.89 °C), the right y-axis shows relative humidity from 0 to 100 percent, and the x-axis shows time in 1-day increments. Temperature is represented by a solid blue line, and relative humidity is represented by a solid red line. Temperature levels fluctuated between 30 and 75 °F for the entire month. Only 3 days recorded temperature levels above 70 °F. The mean temperature for the month was approximately 48 °F. Relative humidity values fluctuated between 50 and 95 percent. The mean relative humidity was approximately 75 percent.
Figure 233. Graph. Temperature-relative humidity measurements for sensor A4 on
Brooklyn side in March 2011
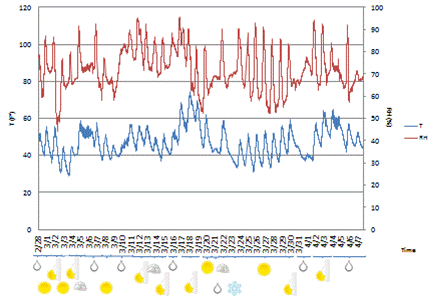
This graph shows temperature and relative humidity recorded by sensor A5 on the Brooklyn side of the Manhattan Bridge during March 2011. The left y-axis shows temperature from 0 to 120 °F (0 to 48.89 °C), the right y-axis shows relative humidity from 0 to 100 percent, and the x-axis shows time in 1-day increments. Temperature is represented by a solid blue line, and relative humidity is represented by a solid red line. Temperature levels fluctuated between 30 and 75 °F for the entire month. Only 3 days recorded temperature levels above 70 °F. The mean temperature for the month was approximately 48 °F. Relative humidity values fluctuated between 50 and 95 percent. The mean relative humidity was approximately 75 percent.
Figure 234. Graph. Temperature-relative humidity measurements for sensor A5 on
Brooklyn side in March 2011
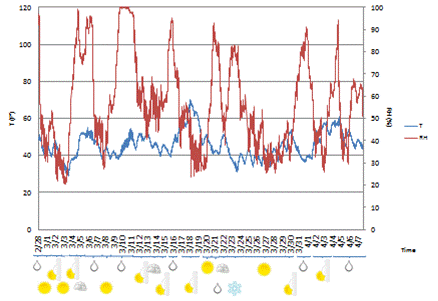
This graph shows temperature and relative humidity recorded by sensor B4 on the Brooklyn side of the Manhattan Bridge during March 2011. The left y-axis shows temperature from 0 to 120 °F (0 to 48.89 °C), the right y-axis shows relative humidity from 0 to 100 percent, and the x-axis shows time in 1-day increments. Temperature is represented by a solid blue line, and relative humidity is represented by a solid red line. Temperature levels fluctuated between 30 and 70 °F for the entire month. Only 1 day recorded temperature levels near 70 °F. The mean temperature for the month was approximately 45 °F. Relative humidity values fluctuated greatly, varying between 30 and 100 percent. No mean values can be deduced.
Figure 235. Graph. Temperature-relative humidity measurements for sensor B4 on
Brooklyn side in March 2011
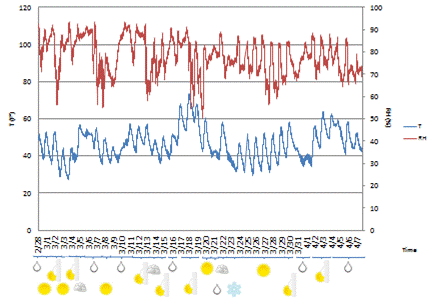
This graph shows temperature and relative humidity recorded by sensor A4 on the Manhattan side of the Manhattan Bridge during March 2011. The left y-axis shows temperature from 0 to 120 °F (0 to 48.89 °C), the right y-axis shows relative humidity from 0 to 100 percent, and the x-axis shows time in 1-day increments. Temperature is represented by a solid blue line, and relative humidity is represented by a solid red line. Temperature levels fluctuated between 30 and 75 °F for the entire month. Only 3 days recorded temperature levels above 70 °F. The mean temperature for the month was approximately 48 °F. Relative humidity values fluctuated between 50 and 95 percent. The mean relative humidity was approximately 75 percent.
Figure 236. Graph. Temperature-relative humidity measurements for sensor A4 on
Manhattan side in March 2011
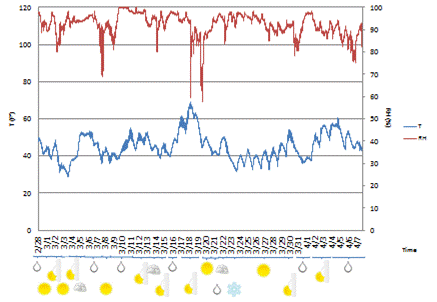
This graph shows temperature and relative humidity recorded by sensor B4 on the Manhattan side of the Manhattan Bridge during March 2011. The left y-axis shows temperature from 0 to 120 °F (0 to 48.89 °C), the right y-axis shows relative humidity from 0 to 100 percent, and the x-axis shows time in 1-day increments. Temperature is represented by a solid blue line, and relative humidity is represented by a solid red line. Temperature levels fluctuated between 30 and 70 °F for the entire month. Only 1 day recorded temperature levels near 70 °F. The mean temperature for the month was approximately 45 °F. Relative humidity values fluctuated between 60 and 100 percent. The recordings of 60 percent were outliers, and the mean relative humidity recorded was approximately 90 percent.
Figure 237. Graph. Temperature-relative humidity measurements for sensor B4 on
Manhattan side in March 2011
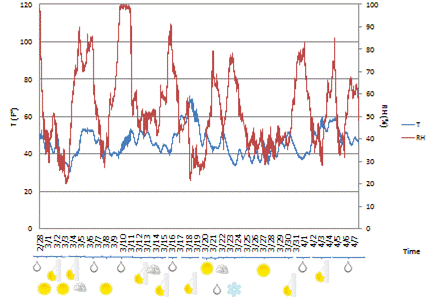
This graph shows temperature and relative humidity recorded by sensor C6 on the Manhattan side of the Manhattan Bridge during March 2011. The left y-axis shows temperature from 0 to 120 °F (0 to 48.89 °C), the right y-axis shows relative humidity from 0 to 100 percent, and the x-axis shows time in 1-day increments. Temperature is represented by a solid blue line, and relative humidity is represented by a solid red line. Temperature levels fluctuated between 30 and 70 °F for the entire month. Only 1 day recorded temperature levels near 70 °F. The mean temperature for the month was approximately 45 °F. Relative humidity values fluctuated greatly, varying between 30 and 100 percent. No mean values can be deduced.
Figure 238. Graph. Temperature-relative humidity measurements for sensor C6 on
Manhattan side in March 2011
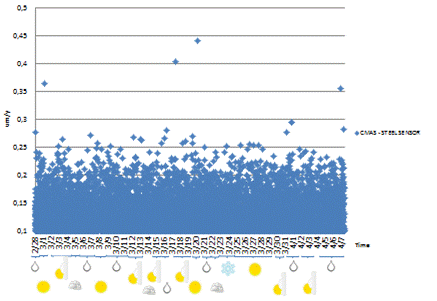
This graph shows the corrosion rate measurements collected by the coupled multi-electrode corrosion carbon steel sensor (CMAS CS) on the Manhattan Bridge during March 2011. The corrosion rates are plotted on the y-axis and measured in micrometers per year, while the x-axis shows time in 1-day increments for the entire month. Data points collected at the specified sampling rate are recorded as blue diamonds and plotted. The majority of data points are plotted below 0.25 micrometers per year with several outlying values.
Figure 239. Graph. Corrosion rate measurements for CMAS CS sensor in March 2011
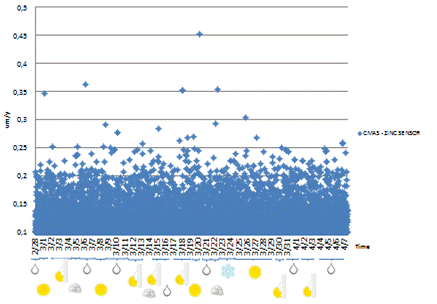
This graph shows the corrosion rate measurements collected by the coupled multi-electrode corrosion zinc sensor (CMAS Zn) on the Manhattan Bridge during March 2011. The corrosion rates are plotted on the y-axis and measured in micrometers per year, while the x-axis shows time in 1-day increments for the entire month. Data points collected at the specified sampling rate are recorded as blue diamonds and plotted. The majority of data points are plotted below 0.25 micrometers per year with several outlying values.
Figure 240. Graph. Corrosion rate measurements for CMAS Zn sensor in March 2011
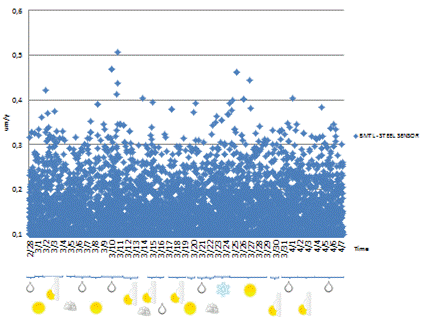
The corrosion rates are plotted on the y-axis and measured in micrometers per year, while the x-axis shows time in 1-day increments for the entire month. Data points collected at the specified sampling rate are recorded as blue diamonds and plotted. The majority of data points are plotted below 0.3 micrometers per year with several outlying values.
Figure 241. Graph. Corrosion rate measurements for BM CS sensor in March 2011
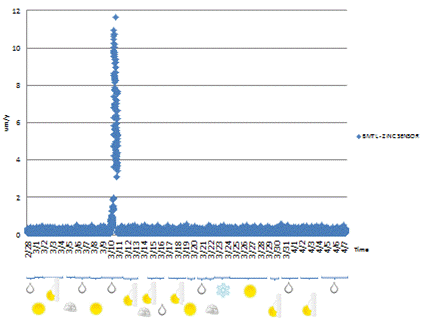
This graph shows the corrosion rate measurements collected by the bimetallic (BM) zinc sensor on the Manhattan Bridge during March 2011. The corrosion rates are plotted on the y-axis and measured in micrometers per year, while the x-axis shows time in 1-day increments for the entire month. Data points collected at the specified sampling rate are recorded as blue diamonds and plotted. The majority of data points are plotted below 0.25 micrometers per year; however, a large spike in corrosion rate to 12 micrometers per year was recorded on March 10. This is seen to be a day of heavy rain.
Figure 242. Graph. Corrosion rate measurements for BM Zn sensor in March 2011
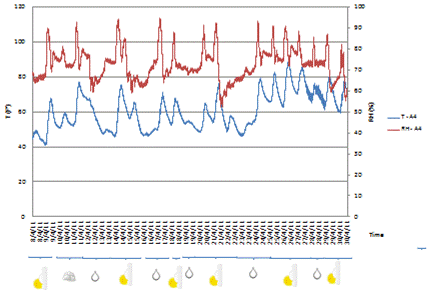
This graph shows temperature and relative humidity recorded by sensor A4 on the Brooklyn side of the Manhattan Bridge during April 2011. The left y-axis shows temperature from 0 to 120 °F (0 to 48.89 °C), the right y-axis shows relative humidity from 0 to 100 percent, and the x-axis shows time in 1-day increments. Temperature is represented by a solid blue line, and relative humidity is represented by a solid red line. Temperature levels fluctuated between 40 and 78 °F for the first 23 days of the month. The temperature increased to range between 60 and 85 °F for the remaining 8 days. The averages were approximately 58 and 70 °F, respectively. Relative humidity values fluctuated between 50 and 90 percent. The majority of days recorded relative humidity levels above 65 percent. The mean relative humidity was approximately 75 percent.
Figure 243. Graph. Temperature-relative humidity measurements for sensor A4 on
Brooklyn side in April 2011
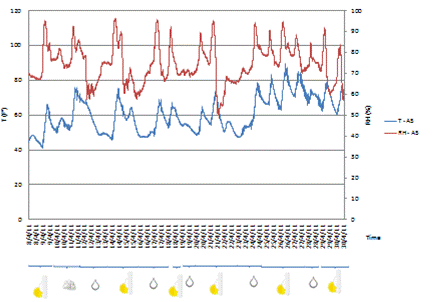
This graph shows temperature and relative humidity recorded by sensor A5 on the Brooklyn side of the Manhattan Bridge during April 2011. The left y-axis shows temperature from 0 to 120 °F (0 to 48.89 °C), the right y-axis shows relative humidity from 0 to 100 percent, and the x-axis shows time in 1-day increments. Temperature is represented by a solid blue line, and relative humidity is represented by a solid red line. Temperature levels fluctuated between 40 and 78 °F for the first 23 days of the month. The temperature increased to range between 60 and 85 °F for the remaining 8 days. The averages were approximately 58 and 70 °F, respectively. Relative humidity values fluctuated between 50 and 90 percent. The majority of days recorded relative humidity levels above 65 percent. The mean relative humidity was approximately 75 percent.
Figure 244. Graph. Temperature-relative humidity measurements for sensor A5 on
Brooklyn side in April 2011
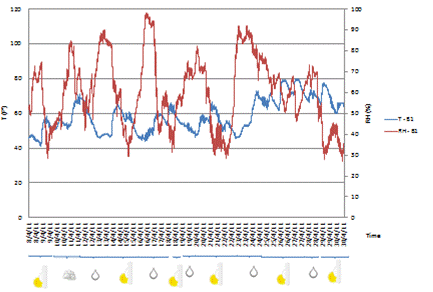
This graph shows temperature and relative humidity recorded by sensor B1 on the Brooklyn side of the Manhattan Bridge during April 2011. The left y-axis shows temperature from 0 to 120 °F (0 to 48.89 °C), the right y-axis shows relative humidity from 0 to 100 percent, and the x-axis shows time in 1-day increments. Temperature is represented by a solid blue line, and relative humidity is represented by a solid red line. Temperature levels fluctuated between 40 and 70 °F for the first 23 days of the month. The temperature increased to range between 60 and 80 °F for the remaining 8 days. The averages were approximately 55 and 70 °F, respectively. Relative humidity values fluctuated between 30 and 98 percent. Wide swings were recorded in the data with a mean value of approximately 65 percent.
Figure 245. Graph. Temperature-relative humidity measurements for sensor B1 on
Brooklyn side in April 2011
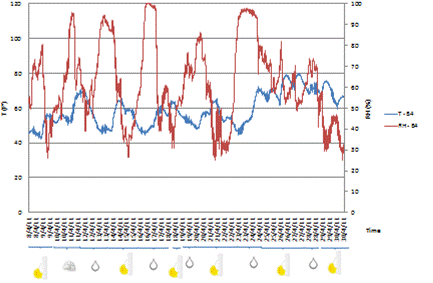
This graph shows temperature and relative humidity recorded by sensor B4 on the Brooklyn side of the Manhattan Bridge during April 2011. The left y-axis shows temperature from 0 to 120 °F (0 to 48.89 °C), the right y-axis shows relative humidity from 0 to 100 percent, and the x-axis shows time in 1-day increments. Temperature is represented by a solid blue line, and relative humidity is represented by a solid red line. Temperature levels fluctuated between 40 and 70 °F for the first 23 days of the month. The temperature increased to range between 60 and 80 °F for the remaining 8 days. The averages were approximately 55 and 70 °F, respectively. Relative humidity values fluctuated between 30 and 100 percent. Wide swings were recorded in the data with a mean value of approximately 65 percent.
Figure 246. Graph. Temperature-relative humidity measurements for sensor B4 on
Brooklyn side in April 2011
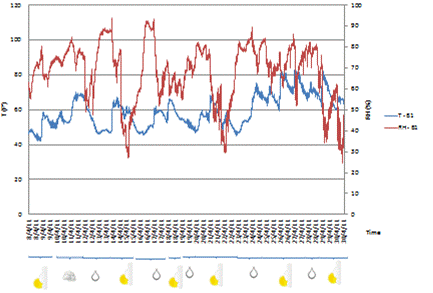
This graph shows temperature and relative humidity recorded by sensor B1 on the Manhattan side of the Manhattan Bridge during April 2011. The left y-axis shows temperature from 0 to 120 °F (0 to 48.89 °C), the right y-axis shows relative humidity from zero to 100 percent, and the x-axis shows time in 1-day increments. Temperature is represented by a solid blue line, and relative humidity is represented by a solid red line. Temperature levels fluctuated between 40 and 70 °F for the first 23 days of the month. The temperature increased to range between 60 and 80 °F for the remaining 8 days. The averages were approximately 55 and 70 °F, respectively. Relative humidity values fluctuated between 30 and 92 percent. The mean relative humidity was approximately 65 percent.
Figure 247. Graph. Temperature-relative humidity measurements for sensor B1 on
Manhattan side in April 2011
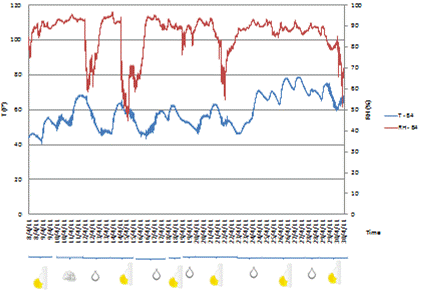
This graph shows temperature and relative humidity recorded by sensor B4 on the Manhattan side of the Manhattan Bridge during April 2011. The left y-axis shows temperature from 0 to 120 °F (0 to 48.89 °C), the right y-axis shows relative humidity from 0 to 100 percent, and the x-axis shows time in 1-day increments. Temperature is represented by a solid blue line, and relative humidity is represented by a solid red line. Temperature levels fluctuated between 40 and 70 °F for the first 23 days of the month. The temperature increased to range between 60 and 80°F for the remaining 8 days. Relative humidity values remained around 90 percent for nearly the entire month. Drops to around 60 percent humidity occurred four times in the month, with two occurrences in the first half and two in the second.
Figure 248. Graph. Temperature-relative humidity measurements for sensor B4 on
Manhattan side in April 2011
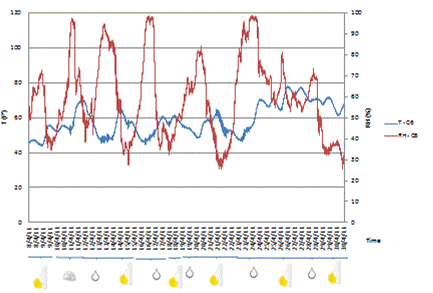
This graph shows temperature and relative humidity recorded by sensor C6 on the Manhattan side of the Manhattan Bridge during April 2011. The left y-axis shows temperature from 0 to 120 °F (0 to 48.89 °C), the right y-axis shows relative humidity from 0 to 100 percent, and the x-axis shows time in 1-day increments. Temperature is represented by a solid blue line, and relative humidity is represented by a solid red line. Temperature levels fluctuated between 40 and 70 °F for the first 23 days of the month. The temperature increased to range between 60 and 80 °F for the remaining 8 days. The averages were approximately 55 and 70 °F, respectively. Relative humidity values fluctuated between 30 and 100 percent. Wide swings were recorded in the data with a mean value of approximately 65 percent.
Figure 249. Graph. Temperature-relative humidity measurements for sensor C6 on
Manhattan side in April 2011
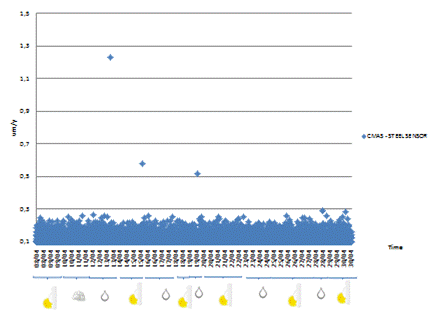
This graph shows the corrosion rate measurements collected by the coupled multi-electrode corrosion carbon steel sensor (CMAS CS) during April 2011. The corrosion rates are plotted on the y-axis and measured in micrometers per year, while the x-axis shows time in 1-day increments for the entire month. Data points collected at the specified sampling rate are recorded as blue diamonds and plotted. The majority of data points are plotted below 0.25 micrometers per year with three outlying values.
Figure 250. Graph. Corrosion rate measurements for CMAS CS sensor in April 2011
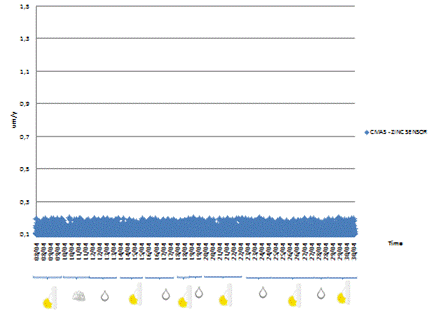
This graph shows the corrosion rate measurements collected by the coupled multi-electrode corrosion zinc sensor (CMAS Zn) during April 2011. The corrosion rates are plotted on the y-axis and measured in micrometers per year, while the x-axis shows time in 1-day increments for the entire month. Data points collected at the specified sampling rate are recorded as blue diamonds and plotted. All of the data points are plotted below 0.2 micrometers per year.
Figure 251. Graph. Corrosion rate measurements for CMAS Zn sensor in April 2011
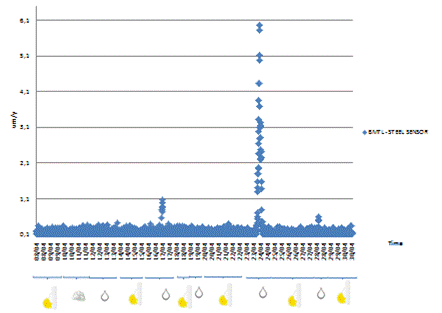
This graph shows the corrosion rate measurements collected by the bimetallic carbon steel (BM CS) sensor during April 2011. The corrosion rates are plotted on the y-axis and measured in micrometers per year, while the x-axis shows time in 1-day increments for the entire month. Data points collected at the specified sampling rate are recorded as blue diamonds and plotted. The majority of data points are plotted below 0.5 micrometers per year; however, two spikes in corrosion rate data occurred. The first occurred on April 17 where corrosion rate values read 1.2 micrometers per year; the second occurred on April 24 with corrosion rate values jumping to 6.2 micrometers per year. Each of these events occurred on rainy days.
Figure 252. Graph. Corrosion rate measurements for BM CS sensor in April 2011
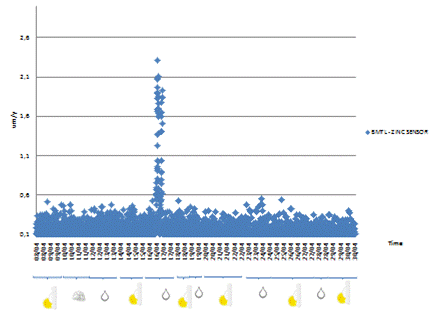
This graph shows the corrosion rate measurements collected by the bimetallic (BM) zinc sensor during April 2011. The corrosion rates are plotted on the y-axis and measured in micrometers per year, while the x-axis shows time in 1-day increments for the entire month. Data points collected at the specified sampling rate are recorded as blue diamonds and plotted. The majority of data points are plotted around or below 0.5 micrometers per year. One spike in corrosion rate data was recorded again on April 17. The maximum corrosion rate value recorded was 2.2 micrometers per year.
Figure 253. Graph. Corrosion rate measurements for BM Zn sensor in April 2011


Federal Highway Administration | 1200 New Jersey Avenue, SE | Washington, DC 20590 | 202-366-4000
Turner-Fairbank Highway Research Center | 6300 Georgetown Pike | McLean, VA | 22101