|

1
| 2 |
3
This appendix provides additional information on the public's satisfaction
with the attributes of major highways. It begins with a recap of
the findings on overall satisfaction with major highways for the
reader's convenience.
Overall Satisfaction with Attributes of Major Highways
Highway travelers were asked to rate their satisfaction with the
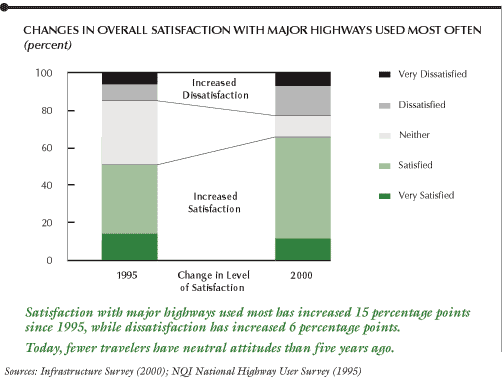
major highways they used most often in 1995 and 2000. There was
a substantial 15 percentage point increase in satisfaction since
1995. There was also a 6 percentage point increase in dissatisfaction.
Compared with attitudes five years ago, fewer travelers have neutral
attitudes about the major highways they use.

Text
summary for chart
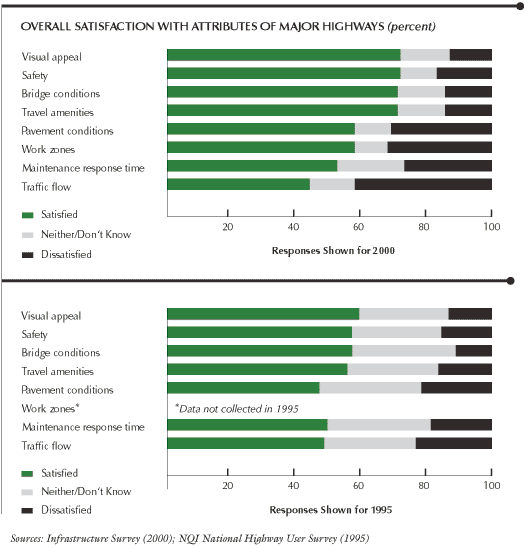
Travelers gave the major highways that they use most often high
marks-much higher in 2000 than in 1995-on the attributes of visual
appeal, safety, bridge
conditions, travel amenities, and pavement conditions. However,
there has been minimal improvement in the ratings of maintenance
response time and a decrease in ratings for traffic flow. In addition,
there was a 20 percentage point increase in dissatisfaction with
traffic flow from 1995 to 2000.

Text
summary for chart
Individual elements of each highway attribute were also measured
in both 1995 and 2000. The figures that follow present this detailed
information. Elements that were not measured in 1995 are noted.
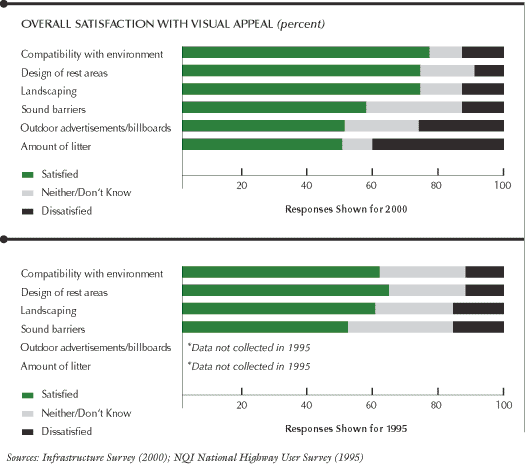
Satisfaction with all elements of visual appeal increased from
1995 to 2000. The public was most satisfied with compatibility with
environment, an increase of 16 percentage points; design of rest
areas, an increase of 11 percentage points; and landscaping, an
increase of 15 percentage points. The public's dissatisfaction with
compatibility with environment increased slightly. They were dissatisfied
with outdoor advertisements/billboards and amount of litter, two
elements not measured in 1995.

Text
summary for chart
|