Trip Purpose and Trip-Chaining
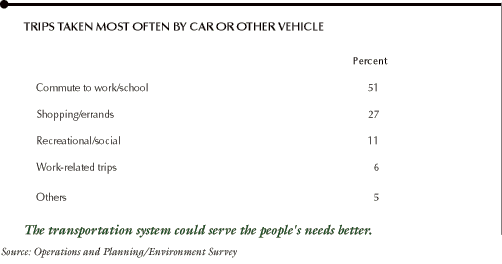
About half of survey respondents who travel on the nation's
roads named "commutes to work or school" as their most
common trip, and another 27 percent named trips for shopping or
errands. However, "trip-chaining" makes it difficult to
separate commutes from trips for shopping, errands, or other purposes.
For example, about 25 percent of commuters report making at least
one stop on the way to work; 33 percent report stopping on the way
home, and they often make multiple stops on the homeward commute.

Text
summary for chart
Overview: Satisfaction with Roadways and Transportation in Communities
Highway travelers were asked to rate their satisfaction with both
"the major highways you use most often" and "the
transportation system and the transportation options in your community."
They were told that transportation options included "more public
transportation choices, or more bicycle and pedestrian paths."
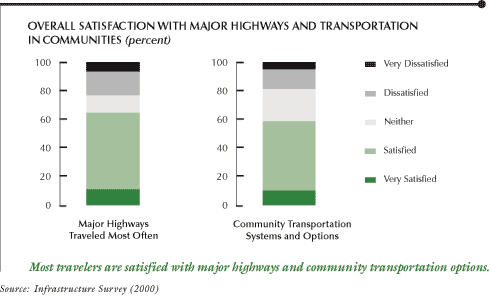
Most highway travelers are satisfied with both the major highways
they use and the existing transportation system and options their
communities offer. Almost two-thirds (65%) said they were satisfied
or very satisfied with major highways, and almost as many (58%)
indicated they were satisfied or very satisfied with their community's
transportation options. However, the level of satisfaction is not
very intense. Only about 10 percent indicated they were "very
satisfied" with either the major highways used most often or
the transportation options in their community.
There is relatively little dissatisfaction. Only about 20 percent
said they were dissatisfied or very dissatisfied with both major
highways and their community transportation options.

Text
summary for chart
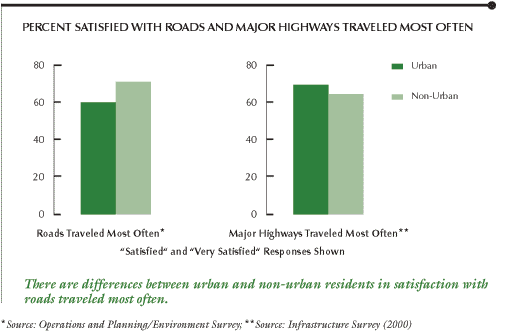
When respondents were asked about the "roads they use most
often," which included city streets, country roads and minor
highways, as well as major highways, urban residents were 60 percent
satisfied. Residents of non-urban areas were 72 percent satisfied.
Respondents seem to be equally satisfied with the quality of major
highways in both urban and non-urban areas. Residents of urban areas
are just about as likely to report being satisfied with major highways
(69%) as are residents of non-urban areas (64%). The term "satisfied"
includes "satisfied" and "very satisfied" responses.

Text
summary for chart
Next
page >
|