|
To further explore satisfaction with the transportation system
and options in communities, two distinct questions were asked. One
dealt with personal satisfaction with the community transportation
systems and options. The second focused on how well the community
transportation met the needs of most people, people with disabilities,
and children/young adults.
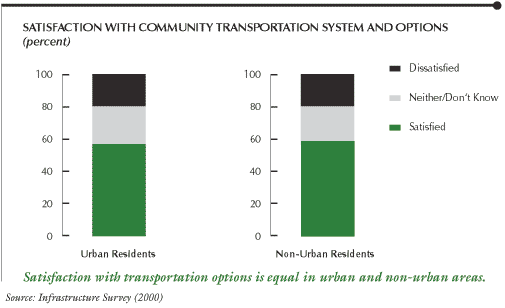
About six in ten respondents living in both urban and non-urban
areas are satisfied with their community's transportation system
and options. Twenty percent of both urban and non-urban respondents
are also dissatisfied with the community transportation system and
options.
Text
summary for chart
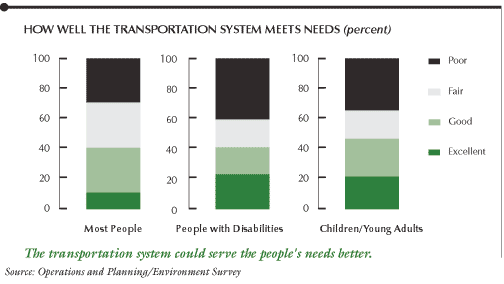
Most respondents think their community's transportation system
could improve in meeting the needs of "most people," people
with disabilities, and children and young adults who do not drive:
- About 60 percent rated their community's transportation
system fair to poor in meeting the needs of most people, with
27 percent rating it poor.
- Just 11 percent indicated that the community's transportation
system is excellent for most people, while 30 percent said it
is good.
- Most respondents with people with disabilities or children/young
adults living in their households also rated the community transportation
system fair to poor in meeting their needs. For example, 60 percent
gave fair or poor ratings for meeting the needs of persons with
disabilities, and 56 percent gave fair or poor ratings for meeting
the needs of school children and young adults who do not drive.
Text
summary for chart
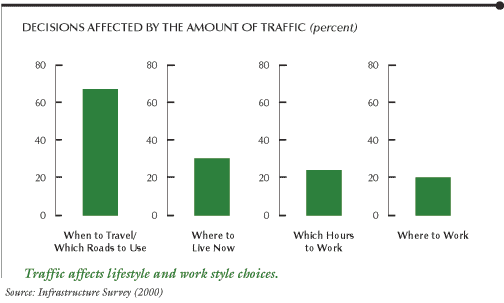
The amount of traffic has not only affected decisions about when
to travel and which roads to use but also where to live, where to
work, and which hours to work. Two in three responded that the amount
of traffic affected their decisions on when to travel and which
roads to use. About 20 percent of respondents indicated that traffic
affected their decisions about where to work and which hours to
work, and 30 percent said it affected their decision about where
they live now. All of these choices affect the growth, livability,
and prosperity of communities.
Text
summary for chart
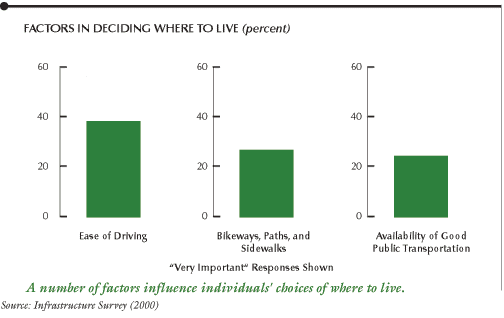
A variety of factors influence people's decision on where
to live. This study focused only on one set of transportation related
factors. All survey participants were asked to respond to how these
factors influenced their decisions on where to live.
The most important factor in deciding where to live is ease of
driving. Bikeways, paths, and sidewalks (26%) and the availability
of good public transportation (23%) were also important considerations.
Text
summary for chart
Next
Page >
|