Factors Contributing to Greater Dissatisfaction
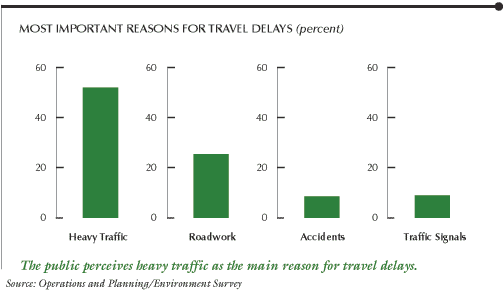
Travelers who reported trip delays were asked to name the main
reason for them.
Heavy traffic is perceived to be by far the most important reason
for travel delays (53%). This is twice the number for roadwork and
five times the number for either accidents or traffic signals.

Text
summary for chart
This finding is not surprising. Over the last two decades, traffic
congestion has been growing in both large metropolitan areas and
in small urban areas (less than 500,000 population). In fact, smaller
urban areas have seen peak period congestion grow more rapidly than
large metropolitan areas. In 1982, only one-third of peak period
travel was congested in smaller urban areas, while in 1997 two-thirds
was congested. During the same years, the percentage of travel in
the small urban areas increased from 14 percent to 36 percent during
congested peak periods.
From the infrastructure perspective, the number of miles driven
is increasing faster than road capacity. Nationally, there was a
10.8 percent increase in licensed drivers from 1990 to 1998 and
a 22.4 percent increase in vehicle miles traveled (VMT). During
the same period, there was a 1 percent increase in the number of
lane miles on roadways.
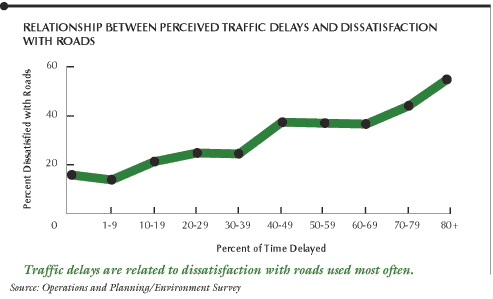
Travelers were asked for the percentage of time their trip is delayed
due to traffic congestion or other problems. Responses varied from
little or no delay to more than an 80 percent delay in their usual
travel time. Travelers who are delayed frequently are more likely
to be dissatisfied with the roads they travel than are those who
are seldom delayed..

Text
summary for chart
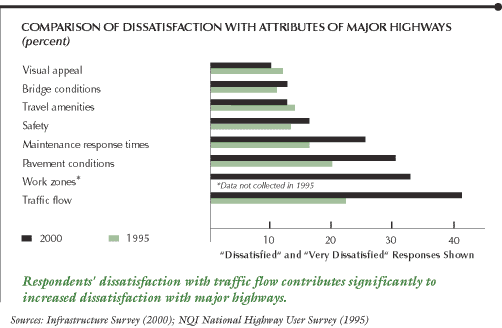
There has also been a large increase (20 percentage point average)
in dissatisfaction with all elements of traffic flow on major highways
during the past five years. In 2000, 43 percent of respondents expressed
dissatisfaction with traffic flow, compared to 23 percent in 1995.
This may explain some of the 6 percentage point increase in dissatisfaction
with highways. Thirty-two percent of respondents expressed dissatisfaction
with work zones, the second highest indicator of dissatisfaction
among attributes of major highways.

Text
summary for chart
Additional analysis was conducted examining all of the factors
measured in the survey that could have contributed to changes in
satisfaction since 1995. This analysis suggested that concerns about
pavement durability and smoothness also may have contributed to
the 6 percentage point increase in dissatisfaction with major highways.
However, it is important to note that these factors explain only
20 percent of the reasons for dissatisfaction, indicating other
unmeasured factors have greater impact than those measured in this
survey.
Satisfaction with the Transportation System and Options in Communities
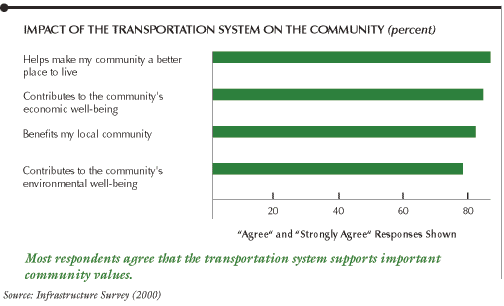
Respondents were asked a series of questions about their community's
transportation system, which includes roads, public transportation,
bikeways and pathways, and how well it supports desirable lifestyles.
Nearly three in four responded positively about how the transportation
system supports important community characteristics. These include
making the community a better place to live and contributing to
both economic and environmental well-being.

Text
summary for chart
|