Satisfaction with Major Highways
Changes in Satisfaction Since 1995
Highway travelers were asked to rate their satisfaction with the
major highways they used most often in 1995 and in 2000.
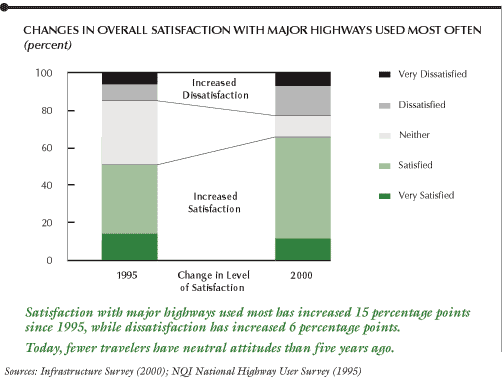
From 1995 to 2000, there has been a substantial increase of 15
percentage points in satisfaction with major highways (from 50%
to 65%). There has also been a 6 percentage point increase in dissatisfaction.
The term "dissatisfied" refers to "dissatisfied"
and "very dissatisfied" responses.
Today, fewer travelers have neutral attitudes about the major highways
they use most often than they did five year ago.

Text
summary for chart
Factors Contributing to Greater Satisfaction
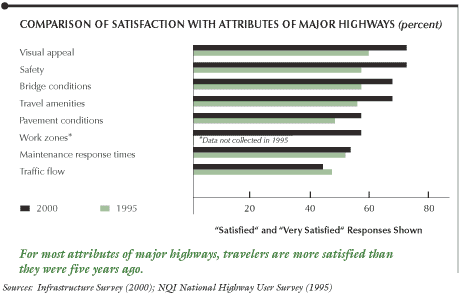
For many attributes of the major highways used most often, travelers
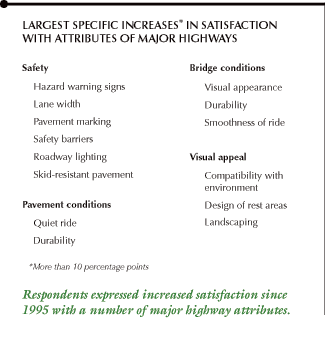
were more satisfied in 2000 than in 1995. These attributes include:
- Visual Appeal (outdoor advertisements, landscaping, appearance
of sound barriers)
- Safety (roadway lighting, shoulder width, safety barriers)
- Bridge Conditions (visual appearance, durability, smoothness)
- Travel Amenities (roadside assistance, mileage signs, number
of rest areas)
- Pavement Conditions (surface appearance, durability, quiet ride)
The improved quality of these attributes probably contributed to
the general increase in overall satisfaction with major highways.
Significant increases in public satisfaction with various highway
attributes are a good indicator of general improvements in their
overall quality. For example, pavement and bridge conditions, which
both increased in public satisfaction from 1995 to 2000, showed
significant increases in their measured physical conditions. The
percentage of deficient bridges (classified as structurally deficient
and/or functionally obsolete) on the National Highway System (NHS)
dropped from 26.3 percent to 23.0 percent from 1993 to 1999. Similarly,
the percentage of miles on the NHS with an acceptable ride quality
(based on an International Roughness Index [IRI] value of less than
170 in/mi) increased from 90.0 percent to 93.0 percent from 1995
to 1999.
Similarly, decreasing trends in satisfaction can be an indicator
of potential areas for quality improvements. Traffic flow, which
decreased in public satisfaction from 1995 to 2000, showed negative
trends in related physical measurements. The estimated percentage
of daily travel occurring under congested conditions increased from
32.0 percent to 32.8 percent from 1996 to 1999, and the estimated
average annual number of hours of travel delay increased from 28
hours in 1996 to 32 hours in 1999.
The two lowest rated attributes in 2000 were maintenance response
time and traffic flow. Satisfaction with maintenance response time
increased slightly, while satisfaction with traffic flow decreased.
Fewer than half of highway travelers said they were satisfied with
traffic flow, and only slightly more than half said they were satisfied
with maintenance response time.

Text
summary for chart

Text
summary for chart
Next
page>
|