|

1
| 2 |
3
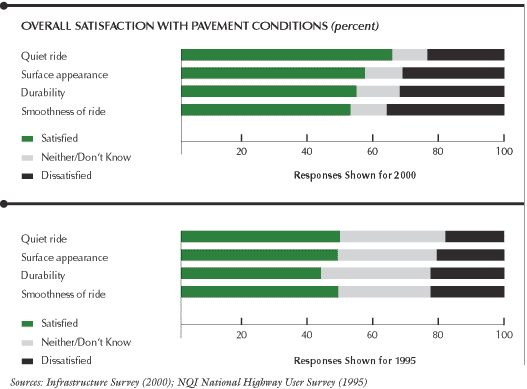
Satisfaction with all elements of pavement conditions increased
from 1995 to 2000. The public was most satisfied with quiet ride,
shown by an increase of 16 percentage points. The public's dissatisfaction
with pavement conditions also increased significantly, especially
with smoothness of ride.

Text
summary for chart
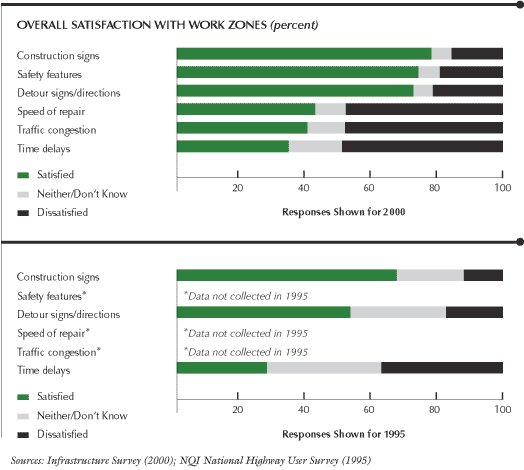
The overall work zone category was not measured in 1995, but several
elements of it were. The public was most satisfied with construction
signs, shown by an increase of 12 percentage points; safety features,
which was not measured in 1995; and detour signs/directions, an
increase of 19 percentage points. The public was least satisfied
with speed of repair, time delays, and traffic congestion in work
zones.

Text
summary for chart
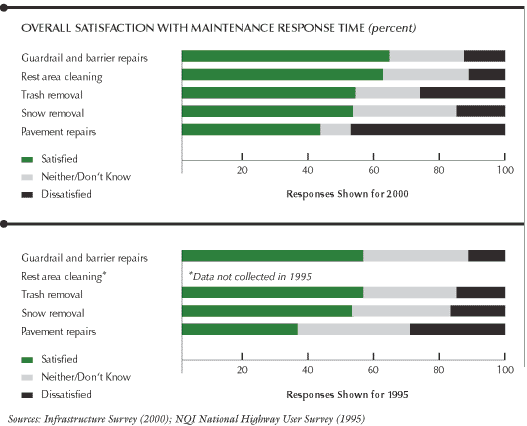
Two elements of maintenance response time increased in satisfaction
from 1995 to 2000. The public was most satisfied with guardrail
and barrier repairs, shown by an increase of 9 percentage points.
The public's dissatisfaction with trash removal increased slightly.
They were least satisfied with response time to pavement repairs,
shown by an increase of 18 percentage points. (Maintenance response
time is a state and local responsibility.)

Text
summary for chart
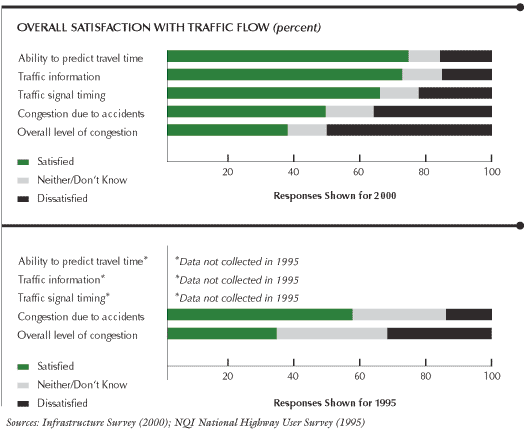
Many elements of traffic flow measured in 2000 were not measured
in 1995. In 2000, the public was most satisfied with the ability
to predict travel time and with traffic information, which were
not measured in 1995. The public was least satisfied with the overall
level of congestion, shown by a 17 percentage point increase in
dissatisfaction.

Text
summary for chart
|