Previous Chapter « Table of Contents » Next Chapter
At least 2,000 practitioners received the survey invitation via direct email and at least another 500 practitioners saw the invitation in the form of electronic or hard copy promotion. This promotion strategy maximized participation and offered a good chance of understanding the breadth of unpaved road management practices currently employed across the nation.
A total of 288 respondents started the survey and 199 completed it (69.1% completion rate). One respondent entered "test" for open-ended questions and was removed from the analysis.
Therefore, the actual total number of respondents was 287. Not all respondents answered every question. Responses to each survey question were downloaded from www.surveymonkey.com and analyzed in Excel.
Slightly more than half of the survey respondents (51%; n = 285) were affiliated with county level government. Others represented private industry, municipalities, federal or state agencies, academic institutions, tribal organizations, or considered themselves to not be easily classified (i.e., "other") (Figure 1; APPENDIX A-I).
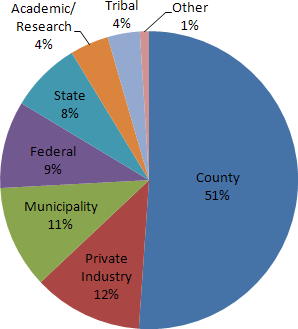
Figure 1. Graph. Affiliations of survey respondents. (rounded up to nearest percent; n = 285)
The majority of respondents (59%; n = 268) indicated their role as being a decision maker or manager within their agency. The remainder represented a variety of respondent-described roles entered as "other," or maintenance superintendents, project engineers, and to a negligible degree, researchers and maintenance workers (Figure 2). "Other" roles included engineer (other than "project engineer"), business administrator, sales representative, planner, consultant, educator, technical support, and regulator (APPENDIX A-II).
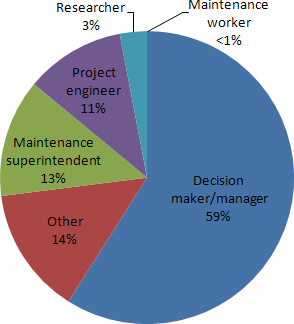
Figure 2. Graph. Roles of survey respondents. (rounded up to nearest percent; n = 268)
Most respondents (73%; n = 274) indicated their agency uses chemical treatments on unpaved roads for dust control, soil stabilization, reduced maintenance, etc. Twenty five percent (25%) indicated their agency does not use chemical treatments and 2% did not know whether or not their agency uses chemical treatments on unpaved roads.
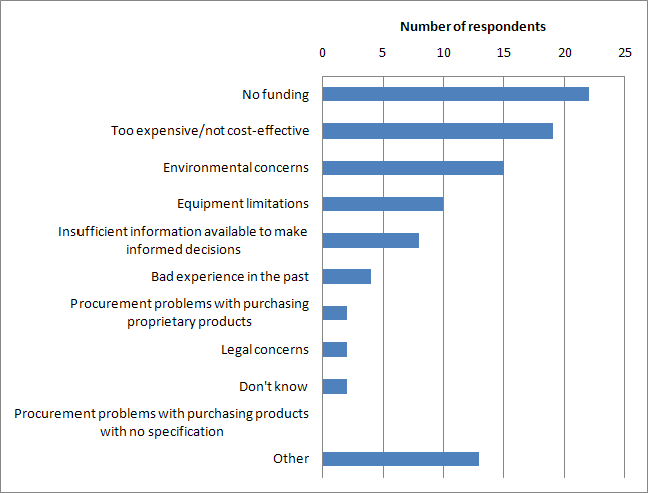
Respondents who indicated that their agency does not use chemical treatments were directed to a more specific question, "If your agency manages unpaved roads but does not use any form of chemical treatment, please state reasons why (check all that apply)." Fifty three respondents answered the question with seven simply stating that their agency does not manage any unpaved roads. The remaining forty six respondents provided the rationale for why their agency does not employ chemical treatments as part of their unpaved road maintenance strategy (Figure 3). The top five most common reasons for not employing chemical treatments were 1.) lack of funding, 2.) cost ineffectiveness, 3.) environmental/health concerns, 4.) equipment limitations, and 5.) insufficient information to make informed decisions. Respondents also provided a variety of other reasons (APPENDIX A-III). This question signified the end of the survey for the set of respondents who indicated their agency does not use chemical treatments on their unpaved road network.
View larger version of Figure 3
Figure 3. Graph. Rationale for not using chemical treatments on unpaved roads. Respondents were asked to check all that apply. (n = 46)
The remainder of the survey pertained to respondents who indicated their agencies do employ chemical treatments on their unpaved roads. The Steering Committee deemed it important to gain an understanding about the relative composition of road networks referenced in this survey. Therefore, the survey included several questions about the length of the road network for which the respondent was affiliated and corresponding budgets (both paved and unpaved).
Seventy five percent of respondents (75%; n = 135) represented agencies responsible for 3 to 500 miles (4.8 to 805 km) of paved roads. Only 4% of respondents represented agencies responsible for tens of thousands of paved road miles (Figure 4). The average paved road network length for respondents of this survey was 1,235 miles (1,986 km). Inapplicable responses, zero values, and question marks were not included in the analysis.
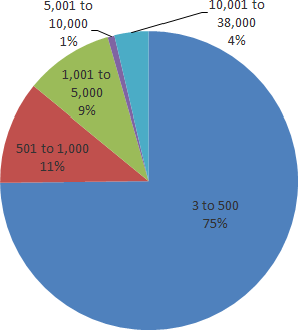
Figure 4. Graph. Relative percent of survey respondents by length of their respective paved road network (assuming center lane miles). (n = 135)
Fifty six percent of respondents (56%; n = 143) represented agencies responsible for 2 to 500 miles (3.2 to 805 km) of unpaved roads. Only 4% of respondents represented agencies responsible for tens of thousands of unpaved road miles (Figure 5). The average unpaved road network length for respondents of this survey was 2,001 miles (3,220 km). Inapplicable responses, zero values, and question marks were not included in the analysis.
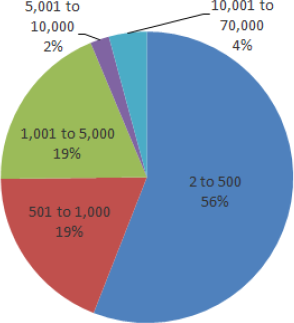
Figure 5. Graph. Relative percent of survey respondents by length of their respective unpaved road network (assuming center lane miles). (n = 143)
The amounts of annual road maintenance budgets varied widely. The most common amount for either paved or unpaved was between $100,001 to $1,000,000 US. Twenty nine percent (29%; n = 109) of respondents are affiliated with an agency that has a paved budget in that range (Figure 6) and 30% (n = 108), an unpaved budget in that range (Figure 7).
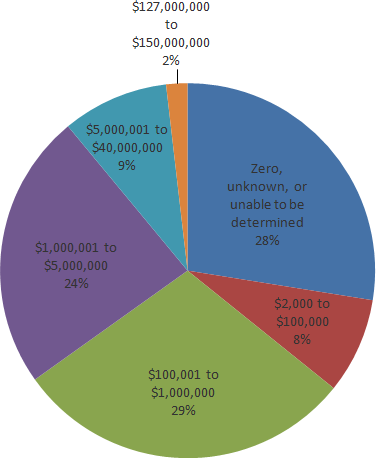
Figure 6. Graph. Relative percent of survey respondents by amount of respective annual paved road maintenance budget (in US$). (n = 109)
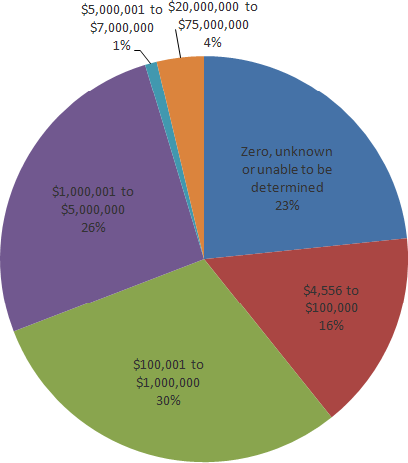
Figure 7. Graph. Relative percent of survey respondents by amount of respective annual unpaved road maintenance budget (in US$). (n = 108)
Ninety (90) respondents provided relatively comprehensive information for the length of their agency's road network and corresponding annual budget amounts (paved and unpaved). Nine (9) of these respondents indicated, however, that their agency's annual road maintenance budget does not differentiate between paved and unpaved.
Of the remaining 81 respondents who provided enough detailed information on this topic, 39 respondents (48%) were affiliated with an agency whose paved road network is bigger than its unpaved network. Similarly, 40 respondents (49%) were affiliated with an agency whose unpaved road network is bigger than its paved network. The remaining two respondents who provided enough detailed information were affiliated with an agency whose paved and unpaved networks are the same length.
In 67 of the cases (83%; n = 81), the bigger portion of the total agency road network also had the larger corresponding annual budget amount, regardless of whether the bigger portion was paved or unpaved. For respondents who provided enough detailed information on this topic, agencies allocate annually an average of $4,989 per paved road mile (n = 77) and an average of $3,909 per unpaved road mile (n = 81). Table 1 illustrates the lowest, highest and average budgets reported. For comparison, one respondent indicated that the national average for Bureau of Indian Affairs/Tribal Roads is about $2,100 per mile, paved or unpaved.
| Lowest annual budget reported (corresponding network length[s]); resulting average budget per mile | Highest annual budget reported (corresponding network length); resulting average budget per mile | Overall average "per mile" budget |
|---|---|---|
| Paved ( n = 77) | ||
| $0 (3 to 5,000 miles); $0 | $875,000,000 (38,000 miles); $23,026 | $4,989 |
| Unpaved ($ US) (n = 81) | ||
| $0 (13 to 1,740 miles); $0 | $75,000,000 (2,400 miles); $31,250 | $3,909 |
The majority of respondents (83%; n = 144) indicated that 5% or less of their agency's unpaved road maintenance budget is used for chemical treatments (Figure 8).
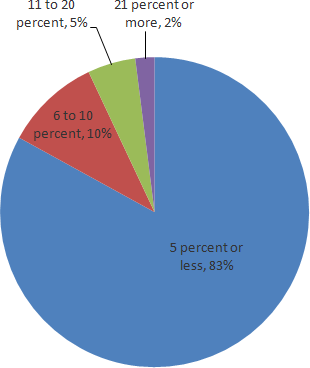
Figure 8. Graph. Relative percent of survey respondents by percentage of agency's unpaved road maintenance budget used for chemical treatments. (n = 144)
Notably, 61% (n = 146) indicated that their agency will apply chemical treatments if a land owner pays for it.
Roughly 80% of respondents (n=164) indicated that their agency has been employing chemical treatments for six or more years. Less than 4% have been using chemical treatments for a year or less.
One hundred sixty nine respondents replied with a rationale for using chemical treatments. However, five (5) "other" responses were not applicable (e.g., "do not have paved roads," "do not use chemical treatment") and, therefore, were not included in the analysis. One of these respondents indicated that his/her agency uses "certified proven environmentally friendly products" in lieu of the chemical treatments described in the survey but, unfortunately, provided little specific information as to what those alternatives might be.
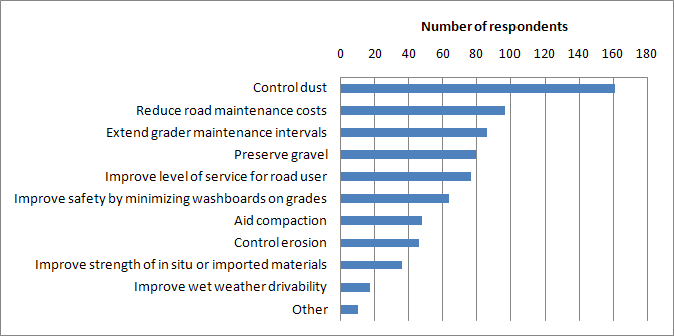
Of those that use or promote the use of chemical treatments, 98% of the respondents (n = 164) indicated it was to control (fugitive road) dust. Some respondents further explained their motivation to control dust (i.e., to comply with federal regulations, for human and livestock health, in response to public complaints, or as a courtesy to the public). Fifty two percent (52%; n = 164) or more of respondents indicated that reducing maintenance costs and extending grader maintenance intervals is part of their agency's rationale for using chemical treatments.
Additional reasons (all from options provided in the survey text) are shown in Figure 9 and "other" responses are listed in APPENDIX A-IV.
View larger version of Figure 9
Figure 9. Graph. Rationale for using chemical treatments on unpaved roads. Respondents were asked to check all that apply. (n = 164)
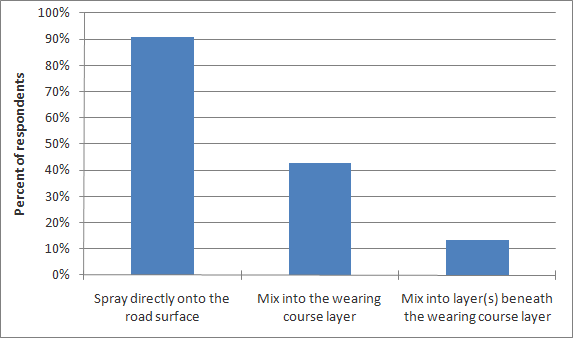
By far, the most common method of chemical application is by spraying directly onto the road surface rather than mixing into road surface layers (Figure 10).
View larger version of Figure 10
Figure 10. Graph. Methods by which agencies apply chemicals. Respondents were asked to check all that apply. (n = 164)
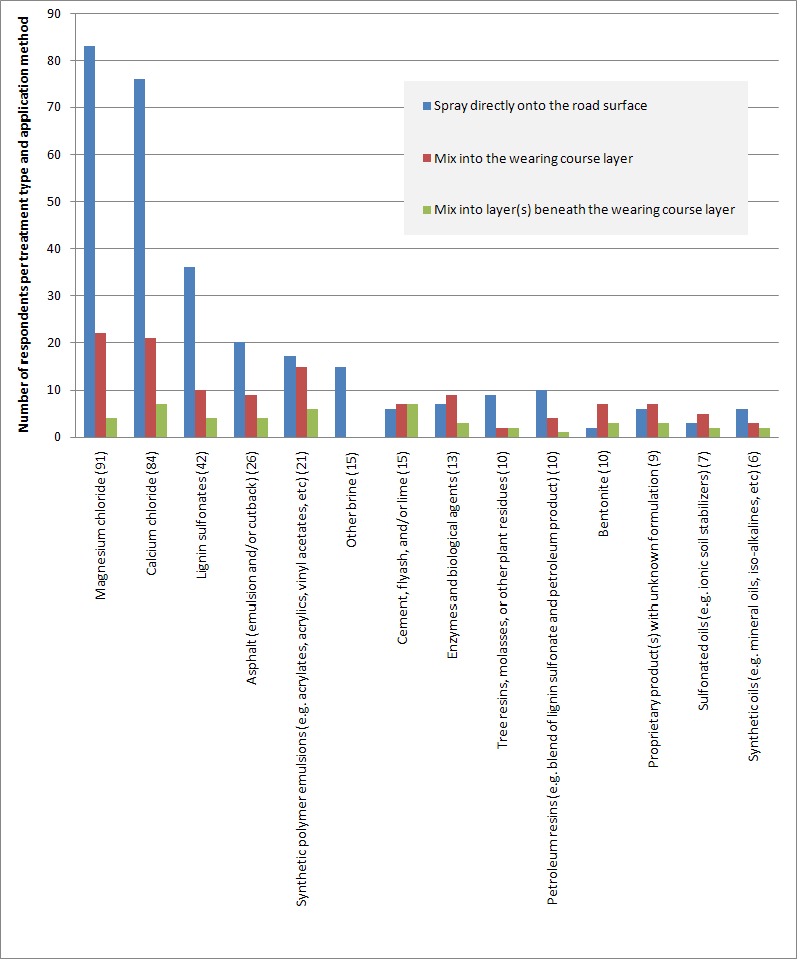
One hundred sixty-three (163) respondents answered the question, "What types of chemical treatments does your agency/organization use for each of the methods checked (previously)? (check all that apply)." Two "other" responses were not applicable and, therefore, not included in the analysis. The chemicals mostly commonly used by respondent agencies are magnesium chloride (MgCl) (57%; n = 161) and calcium chloride (CaCl) (52%), with lignin sulfonates a distant third (26%). Less than 17% of respondents to this question indicated that their agency uses any of the other chemical treatment options listed in the survey text (Figure 11). Nine respondents offered "other" chemical treatment information (APPENDIX A-V).
View larger version of Figure 11
Figure 11. Graph. Use of chemical treatment by application method. Parenthesized number refers to the total number of respondents per treatment type regardless of application method. Respondents were asked to check all that apply. (n = 161)
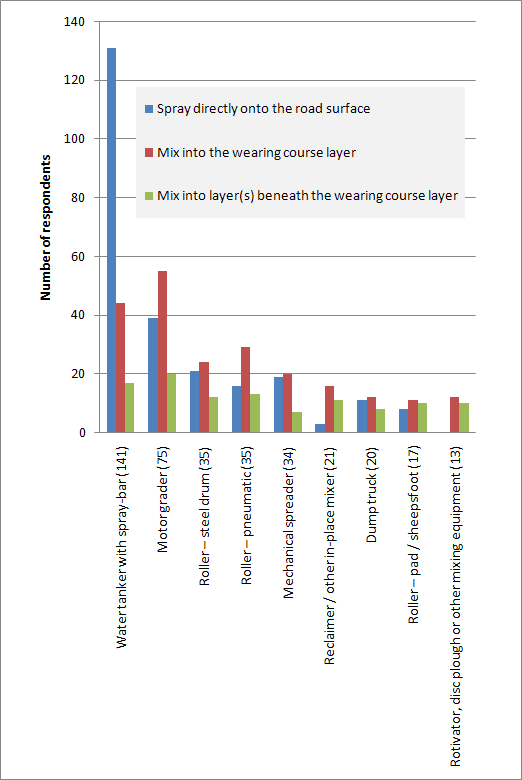
One hundred forty-nine (149) respondents answered the question, "What equipment does your agency/organization use for applying chemical treatments for each of the methods checked (previously)? (check all that apply)." Eight (8) "other" responses to this question were not applicable and, therefore, not included in the analysis. Ninety-nine percent (99%; n = 142) of respondents indicated their agency uses a water tanker, most commonly for spraying directly onto the road surface, whereas, 53% indicated use of motor graders, and 25% or fewer indicated use of any of the other equipment designed more for stabilizing the soil (Figure 12). Seven (7) respondents offered "other" equipment-related information (APPENDIX A-VI).
View larger version of Figure 12
Figure 12. Graph. Type of equipment by application method. Parenthesized number refers to the total number of respondents per equipment type regardless of application method. Respondents were asked to check all that apply. (n = 142)
When asked for the rationale behind their agency's most commonly used treatment, 72% (n =156 cited cost effectiveness. Environmental benefits (52%), experience from previous experiments (49%), and availability of the product (49%) were the next three most popular reasons for using a particular treatment. Additional reasons (all from options provided in the survey text) are shown in Figure 13 and "other" responses are listed in APPENDIX A-VII.
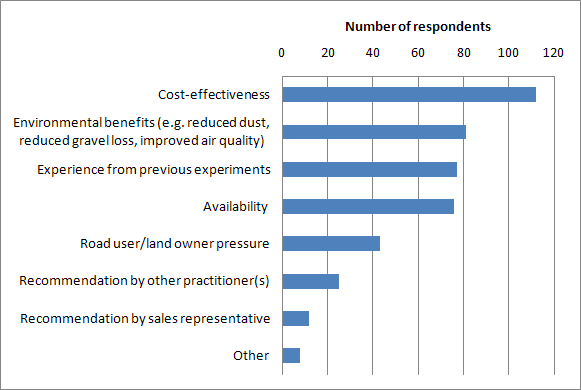
View larger version of Figure 13
Figure 13. Graph. Rationale for choosing their agency's most commonly used chemical treatment. Respondents were asked to check all that apply. (n = 156)
Seventy five percent of respondents (75%; n = 153) indicated their agency has been using its preferred treatment for at least six years while the other 25% indicated the preferred treatment has been in use for five years or less.
Most respondents (95%; n = 156) were either very satisfied or generally satisfied with the performance of their agency's most commonly used treatment (Figure 14). Sixty-five respondents also provided open-ended comments describing the most important reason for their level of satisfaction (APPENDIX A-VIII).
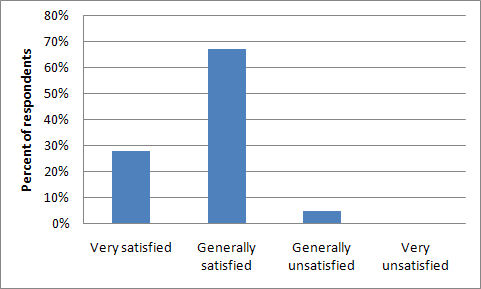
Figure 14. Graph. Respondent level of satisfaction with the performance of their agency's most commonly used treatment. (n = 156)
When asked how their agency assesses performance of chemical treatments, respondents overwhelmingly indicated a subjective and/or qualitative evaluative approach. The two most common methods were visual assessment/drive-by evaluation (93%; n = 158) and gauging feedback from the public (56%). Twenty-five percent (25%) of respondents or fewer indicated they take an objective and/or quantitative approach by documenting differences between treated and untreated roads or by taking measurements (Figure 15). Five (5) respondents provided "other" assessment-related information (APPENDIX A-IX).
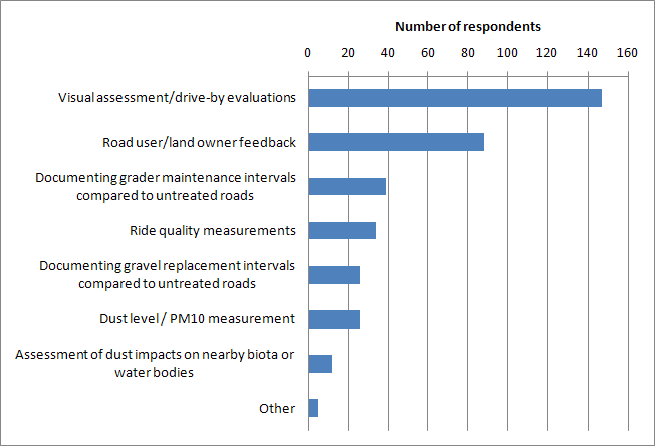
View larger version of Figure 15
Figure 15. Graph. Methods used to assess performance of chemical treatments on unpaved roads. Respondents were asked to check all that apply. (n = 158)
In terms of designing unpaved roads, most respondents indicated their agency relies on historical experience (56%; n = 151) and/or in-house written guidelines (51%) (Figure 16).
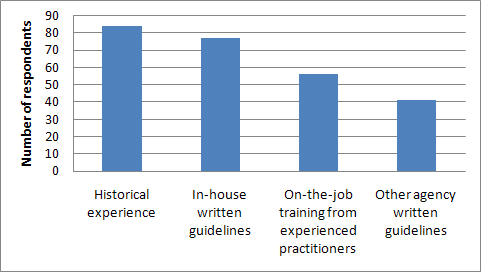
Figure 16. Graph. Agency approach to designing unpaved roads. Respondents were asked to check all that apply. (n = 151).
If written guidelines were used, in-house or otherwise, respondents were asked to provide the name of the document (Table 2). Fourteen (14) "other" open-ended comments regarding the design of unpaved roads are listed in APPENDIX A-X.
| Federal | State | County | Unknown |
|---|---|---|---|
BLM Road Manual (9113) PASER Manuals, DOI Road Maintenance Training LTAP training We used to have the "Forest Service Standard Specifications" book as a guide. Our specs are based on FP-03 standards with supplemental specs developed by the Forest Service engineering AASHTO design standards USDA Forest Service Earthand Aggregate Surfacing Design Guide for Low Volume Roads, September 1996, EM 7170-16 Bureau of Indian Affairs Design Manuals, other agency references that may be available. AASHTO A Policy on Geometric Design of Highways and Streets AASHTO Guidelines for Geometric Design of Very Low-Volume Local Roads |
State DOT specifications New Hampshire Department of Transportation WYDOT VBCRC Standards for Road Development MDOT Specifications for Construction Alaska Preconstruction Design Manual (coordinated w/ FHWA & AASHTO) State DOT Specifications Iowa DOT Design Guides & Design Aids Minnesota DOT specs Alaska DOT&PF Standard Specifications for Highway Construction Use MnDOT pavement design programs Iowa DOT Standard Specifications, Iowa DOT Design Aids IM 3.210 Mn/DOT State Aid Standards state standards |
County Road Standards Our county has developed a material specification for gravel that works best for us. Douglas County Local Road Construction Standards |
Road standards approved minimum standards for design and construction We have a gravel road improvement standard that calls for a 24' surface with a minimum of 6" of compacted 23-A gravel. Standard Construction Specifications. |
Most respondents (roughly 60% or more) indicated that their agency/organization has had generally positive experiences with product manufacturers and suppliers. Figure 17 lists a series of statements for which respondents were asked to indicate their level of agreement.
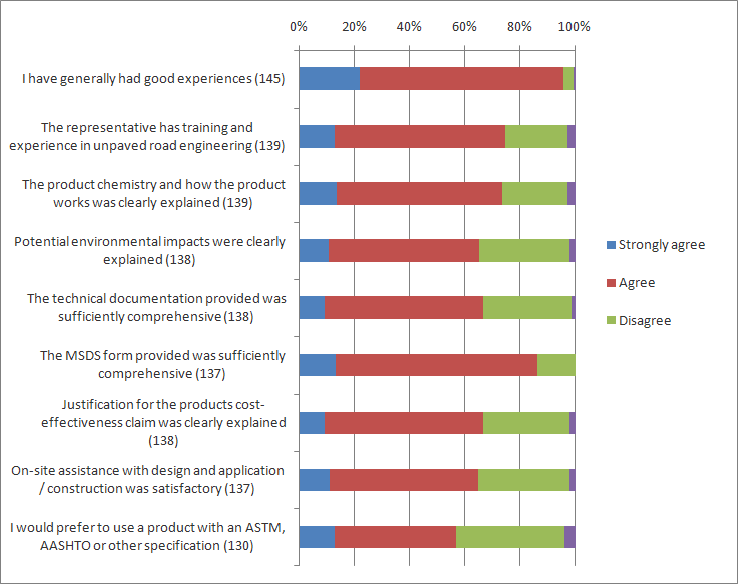
View larger version of Figure 17
Figure 17. Graph. Degree of agreement with statements about agency/organization's experience with manufacturers and suppliers. Respondents were asked to answer all. Parenthesized numbers indicate the total number of respondents per statement, therefore, n ranged from 130 to 145.
Most respondents (80% or more) indicated that they believe chemical treatments can be considered an unpaved road best management practice, however, they also agreed that more research and more comprehensive guidelines for their use are needed. A solid 60% agreed that manufacturers and suppliers should form an industry association. Figure 18 lists a series of statements for which respondents were asked to indicate their level of agreement.
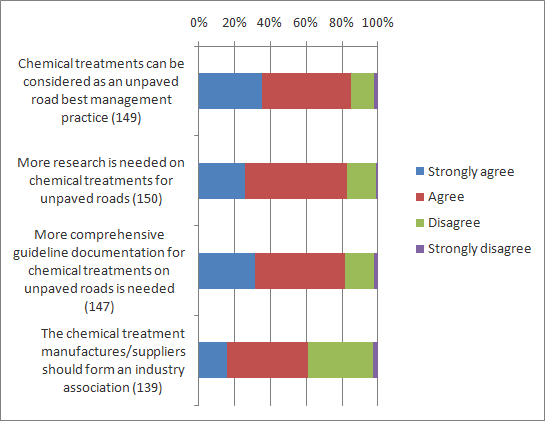
View larger version of Figure 18
Figure 18. Graph. Degree of agreement with statements about chemical treatments. Respondents were asked to answer all. Parenthesized numbers indicate the total number of respondents per statement, therefore, n ranged from 139 to 150.
Seventy six percent of respondents (76%; n = 149) indicated their agency has evaluated chemical treatment experiments in the past. Sixty seven percent (67%; n = 147) indicated their agency/organization plans to evaluate chemical treatment experiments in the future. Sixty percent (60%; n = 140) considers their agency/organization's chemical treatment program a good example of a best management practice. Figure 19 lists a series of statements for which respondents were asked to indicate their level of agreement.
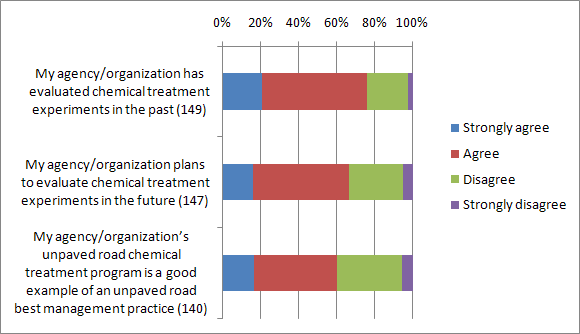
View larger version of Figure 19
Figure 19. Graph. Degree of agreement with statements about agency/organization's chemical treatment program. Respondents were asked to answer all. Parenthesized numbers indicate the total number of respondents per statement, therefore, n ranged from 140 to 149.
The most commonly desired output from a national research program on unpaved road management practices was a "how to" manual for best practices in application (85%; n = 146). More than 60% of respondents were also interested in a web-based clearinghouse of resources and a database of summary reports on the performance of various practices. Figure 20 lists the output choices. Nineteen (19) "other" comments regarding desired outputs are listed in APPENDIX A-XI.
Questions 27 and 28 were aimed at identifying potential host sites for the National Scan of Best Practices for Chemical Treatments on Unpaved Roads. Some responses led to actual host sites visited on the Scan.
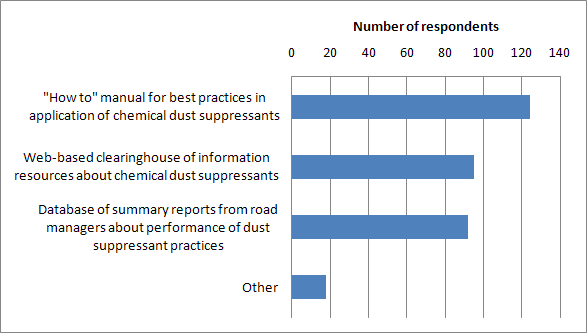
View larger version of Figure 20
Figure 20. Graph. Desired outputs from a national program of managed research on unpaved road management practices. (n = 146)
Stay up to date
Sign up for announcements on grant opportunities, training, and webinars.