
This section discusses the instrumentation used for acoustics, meteorology, traffic analysis, and site surveys, as well as auxiliary instrumentation used in the study. For more detailed technical information, please refer to Rochat 200213.
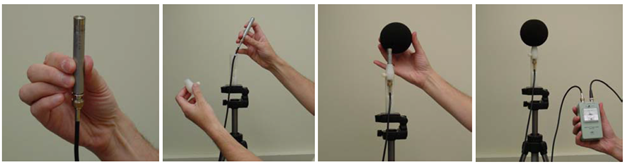
The microphone system, shown in Figure B - 1, consists of four main components: the microphone, preamplifier, power supply and windscreen. For these measurements, 1/2-inch diameter pressure-response electret condenser microphones were used (Brüel and Kjær (B&K) Models 4155 and 4189). Pre-polarized, these microphones are closed off to humidity, effectively eliminating the potential for condensation. The preamplifier and power supply models were B&K Model 2671 and Model WB 1372, respectively. A B&K Model 237 foam windscreen, 3.5 inch in diameter placed on top of each microphone, served to reduce wind-effects at the microphone diaphragm and improve the signal-to-noise ratio of sound measurements.
Using four, two-channel, one-third octave-band Larson Davis Laboratories (LDL) Model 2900 spectrum analyzers can accommodate eight microphone systems set up at the acoustic observer's station. Each channel was configured to continuously measure the A-weighted equivalent sound level and its associated one-third octave-band spectrum, averaged over 5-second intervals. Multiple 5-second averaging periods were combined later in post-processing to obtain noise levels over longer time periods. The LDL 2900 is capable of storing up to 36 hours of data in this configuration. Data was periodically transferred to disk for post-processing and data analysis.
As an auxiliary system to the microphone and spectrum analyzer system, an LDL sound level meter, Model 820 in conjunction with a Sony Model TCD-D100 digital audio tape (DAT) recorder could be set up at a measurement site to obtain supplementary noise information. Like the spectrum analyzer, the sound level meter continuously measured the overall A-weighted equivalent sound levels that were averaged over 5-seconds. After measurements were completed, data were transferred to a laptop computer. The DAT recorder could continuously record up to 4 hours of data in "LP" (half-speed) mode. Each measurement day, then, required multiple tapes that would be post-processed with the spectrum analyzer to obtain one-third octave-band data.
Throughout any measurement day, it was possible to have incident non-traffic noise sources that contaminated the data (e.g. airplanes flying overhead, lawn mowers, sirens). In order to remove the contaminated data and ensure acoustically clean data, an incident noise log was utilized. The noise log consisted of a macro-enabled spreadsheet on a palmtop computer, which allowed for a user to log a start and stop time as well as the description of any incident noise sources that could intrude on the highway traffic noise measurements. This log would be used later in analysis to remove affected data, discussed in more detail in Section 5.
Collecting meteorological measurements provides a full accounting of the conditions for the acoustic measurements and was taken with the intent of incorporating meteorological effects into future versions of TNM. When possible, four Qualimetrics Transportable Automated Meteorological Stations (TAMS) were set up at each measurement site to measure temperature, relative humidity, wind speed and direction, and ambient atmospheric pressure with a sampling period of 1-second. These data were captured on a palmtop computer and files were saved every two hours. At the end of each measurement day, the meteorological data were transferred to a laptop computer.
As it was necessary to analyze traffic for determination of noise levels emitted by different vehicles, video cameras were employed to record traffic information. When available, the video camera systems were stationed on an overpass, positioned such that each camera captured traffic for up to three single-direction lanes. For highways without an overpass, cameras were positioned as high as possible along the side. The video tapes provide up to two hours of recording time on standard play, requiring the use of multiple tapes in a measurement day.
To extract the traffic data, either a manual analysis method or an automated analysis method was applied. The manual analysis involved using fixed reference points of known spacing to determine speeds of vehicles captured by video. This was the only method available for highways that had to rely on video cameras positioned along the side of the road, rather than above on an overpass. The automated analysis consisted of utilizing an Autoscope Model 2004 automated traffic detection system, which detects vehicle speeds when a user inputs fixed reference points of known spacing and the height of the cameras above the roadway.
Coordinates of all important site features – microphone positions, roadways, zones of different ground types, and significant ground undulations – were measured through the use of a differential global positioning system (dGPS). The dGPS system provides a relative, three-dimensional position accuracy of 8 in (20 cm) using a base station and a roving unit.
The acoustical instrumentation was calibrated in the field by a calibration instrumentation system composed of a B&K Model 4231 sound calibrator for absolute level calibration, an Ivie IE-20 B pink noise generator for relative frequency response calibration, and a 1/2-inch microphone simulator to evaluate the instrumentation noise floor and for onsite troubleshooting of electromagnetic interference or other instrumentation problems.
For technical and safety purposes throughout the measurement process, personnel communicated through the use of hand-held transceivers.
A single digital watch served as the master clock for time synchronization of all instrumentation.
13 At the time of the measurements, these instruments were state of the art. We continue to use this historical dataset because it provides a method to compare performance consistent with the original validation effort. Current and future measurements involve new instrumentation that allows more efficient collection of data.

