APPENDIX I: COMPARISON OF MODELED AND MEASURED RESULTS (ADJUSTED FOR REFERENCE MICROPHONE)
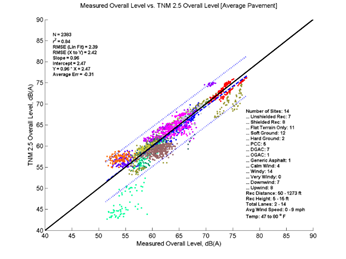
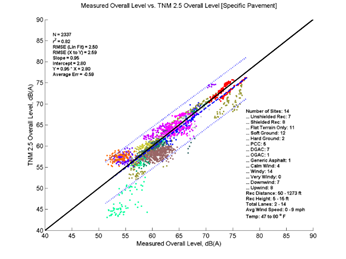
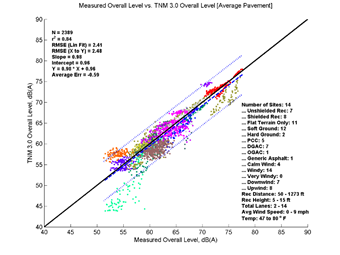
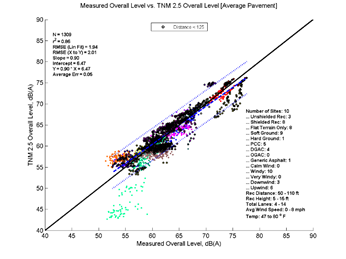
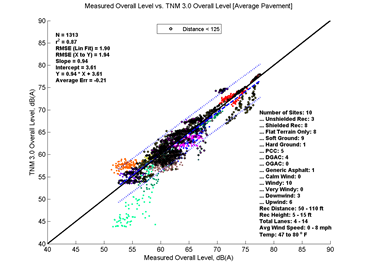
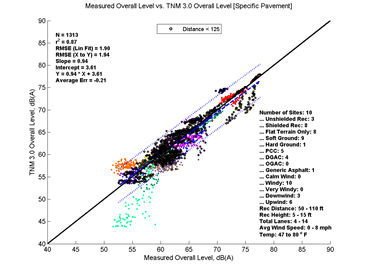
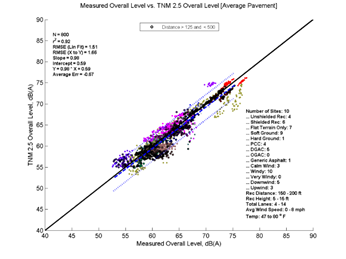
In these figures, the colored circles represent individual 5-minute model computations (color coding is given in the legend); the blue dashed line shows the first-order linear regression between the two datasets; the blue dotted lines indicate the 95-percent prediction interval for any new computations; and the solid black line indicates where all results would fall if both models gave the same predictions for all analyses. Note that in the upper left-hand corner of the graph several statistical parameters are presented: the number of samples, the coefficient of determination (r2), the root mean squared error (RMSE), the regression slope and intercept, the regression equation, and the average difference. These statistics are also repeated in the tables that follow. In the lower right-hand corner, a metadata summary is provided covering the number of sites, the presence of a barrier, receiver distances and heights, number of roadway lanes, pavement type, and temperature and wind conditions included in the analysis. Each site is presented in a different color in order to help highlight any potential grouping of the data.
In general, the larger the sample size, the higher the confidence for the computation of all parameters. In this report, the maximum number of modeled samples is 5987. When sub-sets are examined, the number of samples will be smaller. The r2 provides a measure of correlation. The RMSE provides a measure of absolute variation between the two predictions and represents the sample standard deviation. A slope (m) of one indicates that for every 1-dB change in one model's prediction there will be an identical 1-dB change in the other model's prediction. If the slope is less than one, then the model on the y-axis tends to change predictions slower than the model on the x-axis and vice versa. If the intercept (b) is zero and the slope is one, then there is perfect agreement between the two datasets. If the intercept is negative, then the model on the y-axis predicts lower levels than the model on the x-axis for low levels and vice versa; however, the average difference provides a measure of the overall bias between the two datasets.
I.1 TNM Predictions vs. Measured Results - All Data Analyzed
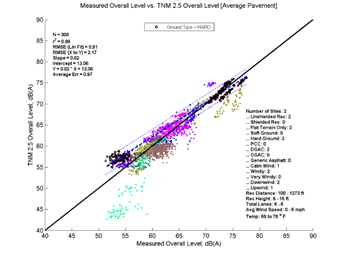
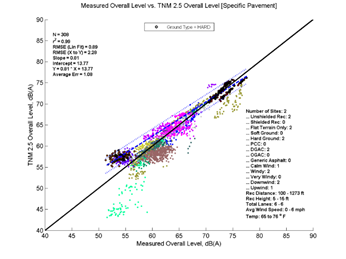
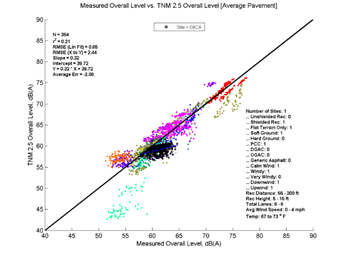
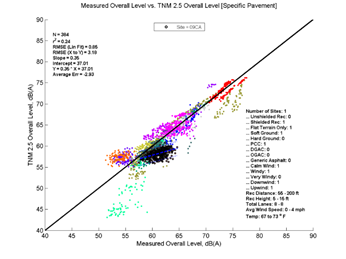
Figure I - 1: TNM 2.5 and 3.0 Predictions vs. Measured Results using Average and Specific Pavements – All Data, adj.
Table I - 1: Summary Statistics for TNM 2.5 and 3.0 Predictions vs. Measured Results using Average and Specific Pavements – All Data, adj.
Average Measured vs. TNM 2.5
Specific Measured vs. TNM 2.5
Average Measured vs. TNM 3.0
Specific Measured vs. TNM 3.0
N
2383
2337
2389
2389
r2
0.84
0.82
0.84
0.84
RMSE (Lin Fit)
2.39
2.5
2.41
2.41
RMSE (X to Y)
2.42
2.59
2.48
2.48
Slope
0.96
0.95
0.98
0.98
Intercept
2.47
2.8
0.96
0.96
Y
0.96 * X + 2.47
0.95 * X + 2.80
0.98 * X + 0.96
0.98 * X + 0.96
Average Error
-0.31
-0.59
-0.59
-0.59
Slope 95% CI
0.9387, 0.9728
0.9280, 0.9640
0.9581, 0.9924
0.9581, 0.9924
Intercept 95% CI
1.3935, 3.5421
1.6632, 3.9287
-0.1181, 2.0423
-0.1181, 2.0423
Avg Err 95% CI
-0.4064, -0.2133
-0.6877, -0.4831
-0.6886, -0.4954
-0.6886, -0.4954
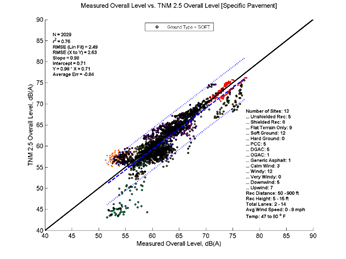
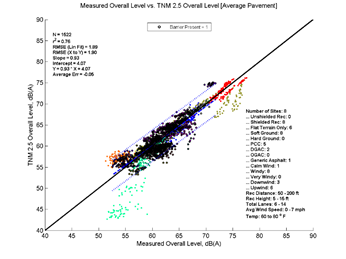
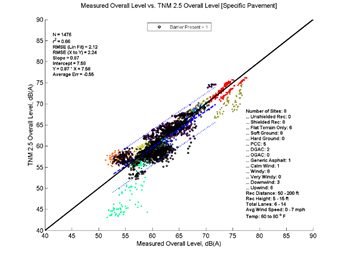
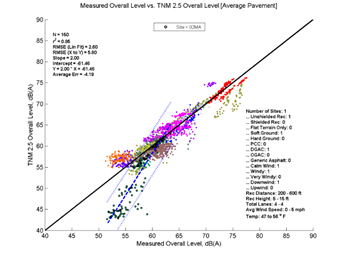
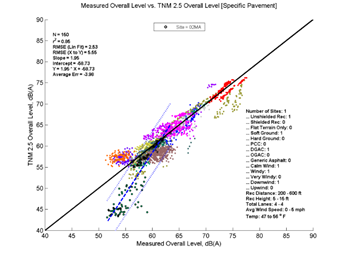
I.2 TNM Predictions vs. Measured Results - Ground Type
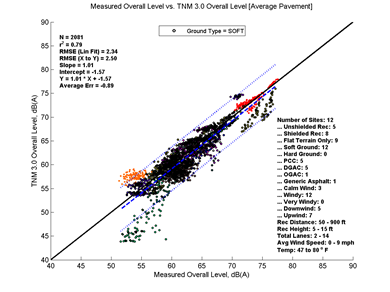
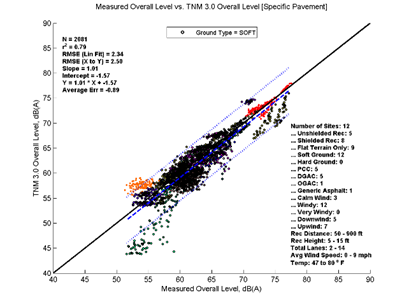
Figure I - 2: TNM 2.5 and 3.0 Predictions vs. Measured Results using Average and Specific Pavements – Acoustically Soft Ground, adj.
Table I - 2: Summary Statistics for TNM 2.5 and 3.0 Predictions vs. Measured Results using Average and Specific Pavements – Acoustically Soft Ground, adj.
Average Measured vs. TNM 2.5
Specific Measured vs. TNM 2.5
Average Measured vs. TNM 3.0
Specific Measured vs. TNM 3.0
N
2075
2029
2081
2081
r2
0.78
0.76
0.79
0.79
RMSE (Lin Fit)
2.41
2.49
2.34
2.34
RMSE (X to Y)
2.46
2.63
2.5
2.5
Slope
1
0.98
1.01
1.01
Intercept
-0.44
0.71
-1.57
-1.57
Y
1.00 * X + -0.44
0.98 * X + 0.71
1.01 * X + -1.57
1.01 * X + -1.57
Average Error
-0.5
-0.84
-0.89
-0.89
Slope 95% CI
0.9764, 1.0218
0.9511, 0.9990
0.9889, 1.0330
0.9889, 1.0330
Intercept 95% CI
-1.8616, 0.9733
-0.7824, 2.2025
-2.9430, -0.1909
-2.9430, -0.1909
Avg Err 95% CI
-0.6031, -0.3958
-0.9464, -0.7291
-0.9856, -0.7845
-0.9856, -0.7845
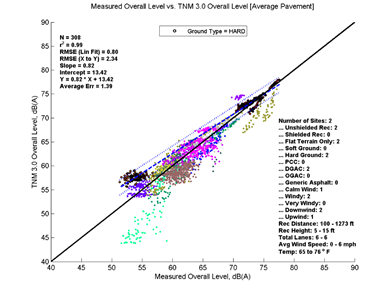
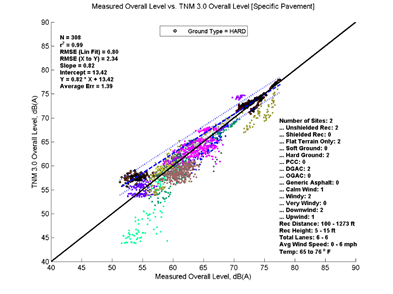
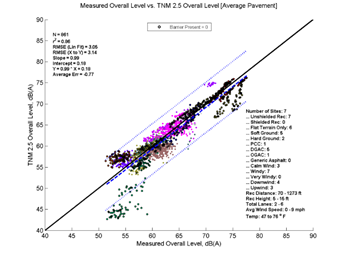
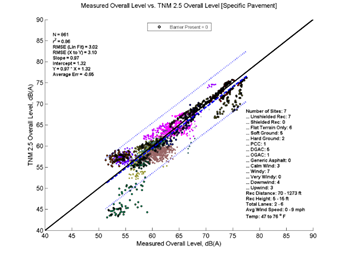
Figure I - 3: TNM 2.5 and 3.0 Predictions vs. Measured Results using Average and Specific Pavements – Acoustically Hard Ground, adj.
Table I - 3: Summary Statistics for TNM 2.5 and 3.0 Predictions vs. Measured Results using Average and Specific Pavements – Acoustically Hard Ground, adj.
Average Measured vs. TNM 2.5
Specific Measured vs. TNM 2.5
Average Measured vs. TNM 3.0
Specific Measured vs. TNM 3.0
N
308
308
308
308
r2
0.99
0.99
0.99
0.99
RMSE (Lin Fit)
0.91
0.89
0.8
0.8
RMSE (X to Y)
2.17
2.28
2.34
2.34
Slope
0.82
0.81
0.82
0.82
Intercept
13.06
13.77
13.42
13.42
Y
0.82 * X + 13.06
0.81 * X + 13.77
0.82 * X + 13.42
0.82 * X + 13.42
Average Error
0.97
1.08
1.39
1.39
Slope 95% CI
0.8073, 0.8289
0.7987, 0.8197
0.8097, 0.8285
0.8097, 0.8285
Intercept 95% CI
12.3408, 13.7888
13.0599, 14.4724
12.7874, 14.0514
12.7874, 14.0514
Avg Err 95% CI
0.7500, 1.1849
0.8525, 1.3019
1.1770, 1.5986
1.1770, 1.5986
I.3 TNM Predictions vs. Measured Results - Barriers
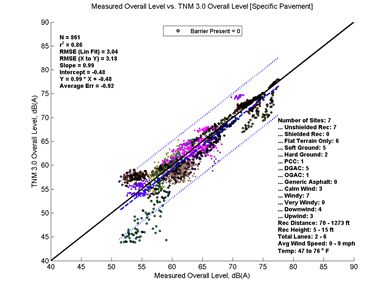
Figure I - 4: TNM 2.5 and 3.0 Predictions vs. Measured Results using Average and Specific Pavements – Site without Barriers, adj.
Table I - 4: Summary Statistics for TNM 2.5 and 3.0 Predictions vs. Measured Results using Average and Specific Pavements – Site without Barriers, adj.
Average Measured vs. TNM 2.5
Specific Measured vs. TNM 2.5
Average Measured vs. TNM 3.0
Specific Measured vs. TNM 3.0
N
861
861
861
861
r2
0.86
0.86
0.86
0.86
RMSE (Lin Fit)
3.05
3.02
3.04
3.04
RMSE (X to Y)
3.14
3.1
3.18
3.18
Slope
0.99
0.97
0.99
0.99
Intercept
0.18
1.32
-0.48
-0.48
Y
0.99 * X + 0.18
0.97 * X + 1.32
0.99 * X + -0.48
0.99 * X + -0.48
Average Error
-0.77
-0.65
-0.92
-0.92
Slope 95% CI
0.9587, 1.0120
0.9433, 0.9961
0.9666, 1.0198
0.9666, 1.0198
Intercept 95% CI
-1.5630, 1.9152
-0.4088, 3.0449
-2.2182, 1.2574
-2.2182, 1.2574
Avg Err 95% CI
-0.9758, -0.5689
-0.8497, -0.4447
-1.1269, -0.7205
-1.1269, -0.7205
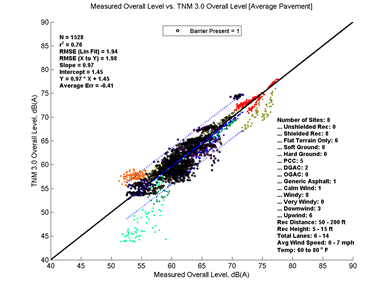
Figure I - 5: TNM 2.5 and 3.0 Predictions vs. Measured Results using Average and Specific Pavements – Site with Barriers, adj.
Table I - 5: Summary Statistics for TNM 2.5 and 3.0 Predictions vs. Measured Results using Average and Specific Pavements – Site with Barriers, adj.
Average Measured vs. TNM 2.5
Specific Measured vs. TNM 2.5
Average Measured vs. TNM 3.0
Specific Measured vs. TNM 3.0
N
1522
1476
1528
1528
r2
0.76
0.66
0.76
0.76
RMSE (Lin Fit)
1.89
2.12
1.94
1.94
RMSE (X to Y)
1.9
2.24
1.98
1.98
Slope
0.93
0.87
0.97
0.97
Intercept
4.07
7.58
1.45
1.45
Y
0.93 * X + 4.07
0.87 * X + 7.58
0.97 * X + 1.45
0.97 * X + 1.45
Average Error
-0.05
-0.55
-0.41
-0.41
Slope 95% CI
0.9064, 0.9596
0.8359, 0.8991
0.9425, 0.9971
0.9425, 0.9971
Intercept 95% CI
2.4334, 5.7147
5.6405, 9.5239
-0.2301, 3.1391
-0.2301, 3.1391
Avg Err 95% CI
-0.1438, 0.0473
-0.6601, -0.4385
-0.5025, -0.3077
-0.5025, -0.3077
I.4 TNM Predictions vs. Measured Results - Distance
Figure I - 6: TNM 2.5 and 3.0 Predictions vs. Measured Results using Average and Specific Pavements – Measurement Locations within 125 Feet of the Center of the Nearest Lane, adj.
Table I - 6: Summary Statistics for TNM 2.5 and 3.0 Predictions vs. Measured Results using Average and Specific Pavements – Measurement Locations within 125 Feet of the Center of the Nearest Lane, adj.
Average Measured vs. TNM 2.5
Specific Measured vs. TNM 2.5
Average Measured vs. TNM 3.0
Specific Measured vs. TNM 3.0
N
1309
1287
1313
1313
r2
0.86
0.83
0.87
0.87
RMSE (Lin Fit)
1.94
2.15
1.9
1.9
RMSE (X to Y)
2.01
2.24
1.94
1.94
Slope
0.9
0.9
0.94
0.94
Intercept
6.47
6.01
3.61
3.61
Y
0.90 * X + 6.47
0.90 * X + 6.01
0.94 * X + 3.61
0.94 * X + 3.61
Average Error
0.05
-0.36
-0.21
-0.21
Slope 95% CI
0.8790, 0.9186
0.8774, 0.9217
0.9131, 0.9525
0.9219, 0.9636
Intercept 95% CI
5.2134, 7.7358
4.6016, 7.4228
2.9103, 5.4192
1.9731, 4.6198
Avg Err 95% CI
-0.0624, 0.1553
-0.4776, -0.2358
-0.2065, -0.0055
-0.4385, -0.2184
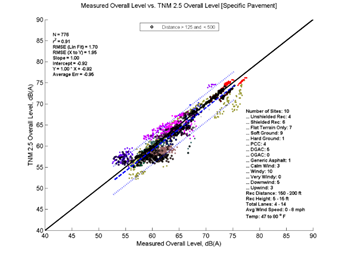
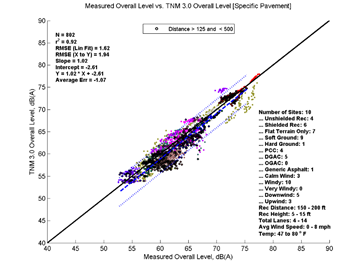
Figure I - 7: TNM 2.5 and 3.0 Predictions vs. Measured Results using Average and Specific Pavements – Measurement Locations between 125 and 500 Feet of the Center of the Nearest Lane, adj.
Table I - 7: Summary Statistics for TNM 2.5 and 3.0 Predictions vs. Measured Results using Average and Specific Pavements – Measurement Locations between 125 and 500 Feet of the Center of the Nearest Lane, adj.
Average Measured vs. TNM 2.5
Specific Measured vs. TNM 2.5
Average Measured vs. TNM 3.0
Specific Measured vs. TNM 3.0
N
800
776
802
802
r2
0.92
0.91
0.92
0.92
RMSE (Lin Fit)
1.51
1.7
1.62
1.62
RMSE (X to Y)
1.66
1.95
1.94
1.94
Slope
0.98
1
1.02
1.02
Intercept
0.59
-0.92
-2.61
-2.61
Y
0.98 * X + 0.59
1.00 * X + -0.92
1.02 * X + -2.61
1.02 * X + -2.61
Average Error
-0.67
-0.95
-1.07
-1.07
Slope 95% CI
0.9605, 0.9999
0.9773, 1.0218
1.0030, 1.0451
1.0030, 1.0451
Intercept 95% CI
-0.6701, 1.8518
-2.3477, 0.5020
-3.9520, -1.2594
-3.9520, -1.2594
Avg Err 95% CI
-0.7778, -0.5679
-1.0701, -0.8304
-1.1844, -0.9602
-1.1844, -0.9602
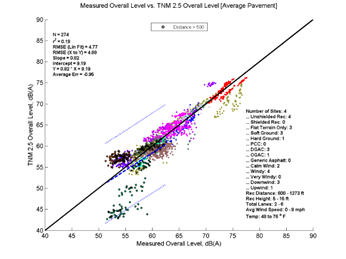
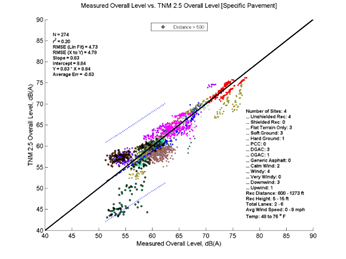
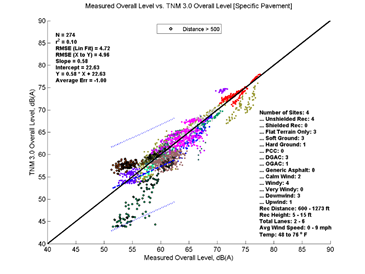
Figure I - 8: TNM 2.5 and 3.0 Predictions vs. Measured Results using Average and Specific Pavements – Measurement Locations Greater than 500 Feet of the Center of the Nearest Lane, adj.
Table I - 8: Summary Statistics for TNM 2.5 and 3.0 Predictions vs. Measured Results using Average and Specific Pavements – Measurement Locations Greater than 500 Feet of the Center of the Nearest Lane, adj.
Average Measured vs. TNM 2.5
Specific Measured vs. TNM 2.5
Average Measured vs. TNM 3.0
Specific Measured vs. TNM 3.0
N
274
274
274
274
r2
0.19
0.2
0.1
0.1
RMSE (Lin Fit)
4.77
4.73
4.72
4.72
RMSE (X to Y)
4.88
4.78
4.96
4.96
Slope
0.82
0.83
0.58
0.58
Intercept
9.19
8.84
22.63
22.63
Y
0.82 * X + 9.19
0.83 * X + 8.84
0.58 * X + 22.63
0.58 * X + 22.63
Average Error
-0.95
-0.63
-1
-1
Slope 95% CI
0.6189, 1.0193
0.6328, 1.0295
0.3804, 0.7764
0.3804, 0.7764
Intercept 95% CI
-2.0500, 20.4202
-2.2958, 19.9686
11.5171, 33.7373
11.5171, 33.7373
Avg Err 95% CI
-1.5199, -0.3847
-1.1881, -0.0641
-1.5790, -0.4277
-1.5790, -0.4277
I.5 Variation by Site
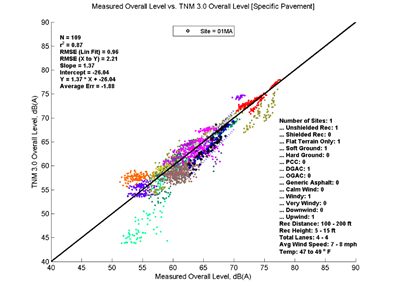
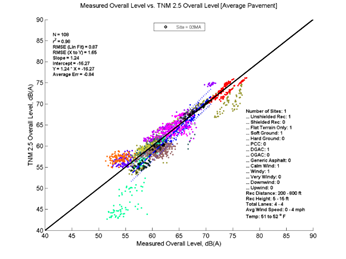
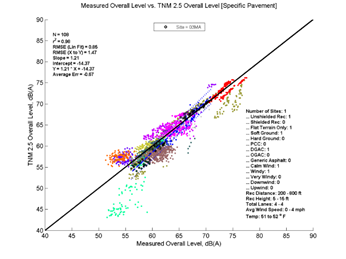
Figure I - 9: TNM 2.5 and 3.0 Predictions vs. Measured Results using Average and Specific Pavements – 01MA, adj.
Table I - 9: Summary Statistics for TNM 2.5 and 3.0 Predictions vs. Measured Results using Average and Specific Pavements – 01MA, adj.
Average Measured vs. TNM 2.5
Specific Measured vs. TNM 2.5
Average Measured vs. TNM 3.0
Specific Measured vs. TNM 3.0
N
109
109
109
109
r2
0.88
0.89
0.87
0.87
RMSE (Lin Fit)
0.91
0.89
0.96
0.96
RMSE (X to Y)
1.38
1.35
2.21
2.21
Slope
1.38
1.38
1.37
1.37
Intercept
-25.95
-25.61
-26.04
-26.04
Y
1.38 * X + -25.95
1.38 * X + -25.61
1.37 * X + -26.04
1.37 * X + -26.04
Average Error
-0.79
-0.77
-1.88
-1.88
Slope 95% CI
1.2866, 1.4752
1.2833, 1.4691
1.2657, 1.4662
1.2657, 1.4662
Intercept 95% CI
-32.1752, -19.7174
-31.7489, -19.4805
-32.6667, -19.4190
-32.6667, -19.4190
Avg Err 95% CI
-1.0033, -0.5773
-0.9805, -0.5604
-2.0950, -1.6576
-2.0950, -1.6576
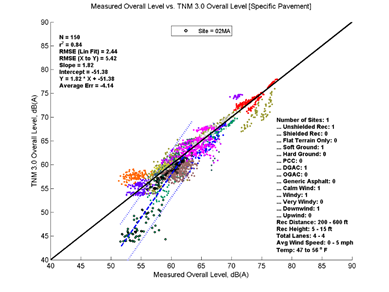
Figure I - 10: TNM 2.5 and 3.0 Predictions vs. Measured Results using Average and Specific Pavements – 02MA, adj.
Table I - 10: Summary Statistics for TNM 2.5 and 3.0 Predictions vs. Measured Results using Average and Specific Pavements – 02MA, adj.
Average Measured vs. TNM 2.5
Specific Measured vs. TNM 2.5
Average Measured vs. TNM 3.0
Specific Measured vs. TNM 3.0
N
150
150
150
150
r2
0.85
0.85
0.84
0.84
RMSE (Lin Fit)
2.6
2.53
2.44
2.44
RMSE (X to Y)
5.8
5.55
5.42
5.42
Slope
2
1.95
1.82
1.82
Intercept
-61.46
-58.73
-51.38
-51.38
Y
2.00 * X + -61.46
1.95 * X + -58.73
1.82 * X + -51.38
1.82 * X + -51.38
Average Error
-4.19
-3.98
-4.14
-4.14
Slope 95% CI
1.8600, 2.1308
1.8198, 2.0834
1.6941, 1.9479
1.6941, 1.9479
Intercept 95% CI
-69.2631, -53.6605
-66.3219, -51.1342
-58.6876, -44.0661
-58.6876, -44.0661
Avg Err 95% CI
-4.8363, -3.5487
-4.6010, -3.3607
-4.7049, -3.5805
-4.7049, -3.5805
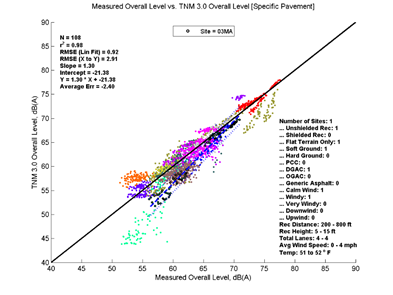
Figure I - 11: TNM 2.5 and 3.0 Predictions vs. Measured Results using Average and Specific Pavements – 03MA, adj.
Table I - 11: Summary Statistics for TNM 2.5 and 3.0 Predictions vs. Measured Results using Average and Specific Pavements – 03MA, adj.
Average Measured vs. TNM 2.5
Specific Measured vs. TNM 2.5
Average Measured vs. TNM 3.0
Specific Measured vs. TNM 3.0
N
108
108
108
108
r2
0.98
0.98
0.98
0.98
RMSE (Lin Fit)
0.87
0.85
0.92
0.92
RMSE (X to Y)
1.65
1.47
2.91
2.91
Slope
1.24
1.21
1.3
1.3
Intercept
-16.27
-14.37
-21.38
-21.38
Y
1.24 * X + -16.27
1.21 * X + -14.37
1.30 * X + -21.38
1.30 * X + -21.38
Average Error
-0.84
-0.67
-2.4
-2.4
Slope 95% CI
1.2061, 1.2766
1.1800, 1.2484
1.2595, 1.3342
1.2595, 1.3342
Intercept 95% CI
-18.5294, -14.0066
-16.5612, -12.1734
-23.7696, -18.9826
-23.7696, -18.9826
Avg Err 95% CI
-1.1080, -0.5710
-0.9202, -0.4267
-2.7109, -2.0829
-2.7109, -2.0829
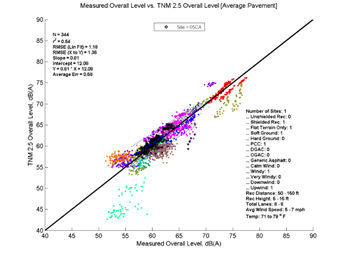
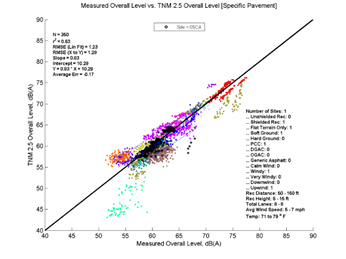
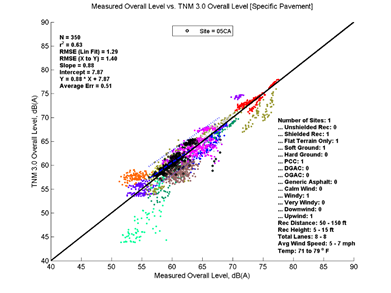
Figure I - 12: TNM 2.5 and 3.0 Predictions vs. Measured Results using Average and Specific Pavements – 05CA, adj.
Table I - 12: Summary Statistics for TNM 2.5 and 3.0 Predictions vs. Measured Results using Average and Specific Pavements – 05CA, adj.
Average Measured vs. TNM 2.5
Specific Measured vs. TNM 2.5
Average Measured vs. TNM 3.0
Specific Measured vs. TNM 3.0
N
344
350
350
350
r2
0.64
0.63
0.63
0.63
RMSE (Lin Fit)
1.18
1.23
1.29
1.29
RMSE (X to Y)
1.36
1.28
1.4
1.4
Slope
0.81
0.83
0.88
0.88
Intercept
12.08
10.29
7.87
7.87
Y
0.81 * X + 12.08
0.83 * X + 10.29
0.88 * X + 7.87
0.88 * X + 7.87
Average Error
0.58
-0.17
0.51
0.51
Slope 95% CI
0.7447, 0.8741
0.7598, 0.8934
0.8076, 0.9484
0.8076, 0.9484
Intercept 95% CI
8.1756, 15.9827
6.2606, 14.3278
3.6183, 12.1175
3.6183, 12.1175
Avg Err 95% CI
0.4467, 0.7079
-0.3048, -0.0387
0.3687, 0.6436
0.3687, 0.6436
Figure I - 13: TNM 2.5 and 3.0 Predictions vs. Measured Results using Average and Specific Pavements – 06CA, adj.
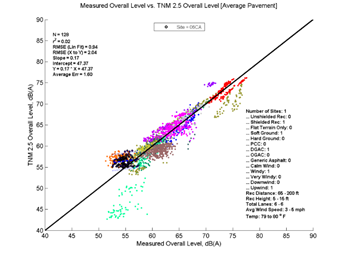
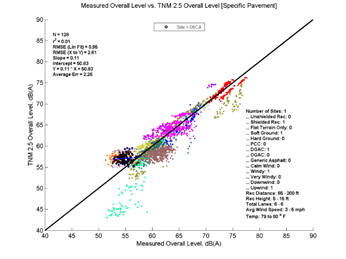
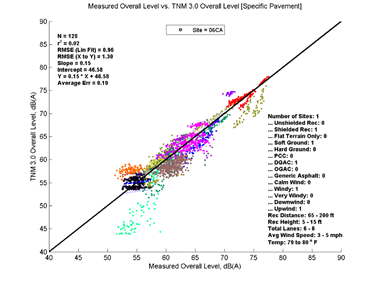
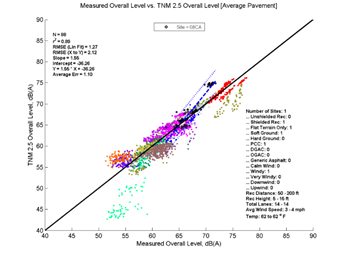
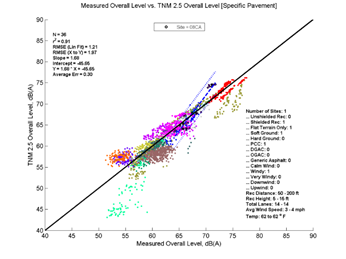
Table I - 13: Summary Statistics for TNM 2.5 and 3.0 Predictions vs. Measured Results using Average and Specific Pavements – 06CA, adj.
Average Measured vs. TNM 2.5
Specific Measured vs. TNM 2.5
Average Measured vs. TNM 3.0
Specific Measured vs. TNM 3.0
N
128
128
128
128
r2
0.02
0.01
0.02
0.02
RMSE (Lin Fit)
0.94
0.95
0.96
0.96
RMSE (X to Y)
2.04
2.61
1.3
1.3
Slope
0.17
0.11
0.15
0.15
Intercept
47.37
50.83
46.58
46.58
Y
0.17 * X + 47.37
0.11 * X + 50.83
0.15 * X + 46.58
0.15 * X + 46.58
Average Error
1.6
2.26
0.19
0.19
Slope 95% CI
0.0066, 0.3245
-0.0453, 0.2741
-0.0076, 0.3158
-0.0076, 0.3158
Intercept 95% CI
38.6483, 56.0869
42.0699, 59.5889
37.7130, 55.4565
37.7130, 55.4565
Avg Err 95% CI
1.3784, 1.8197
2.0301, 2.4851
-0.0336, 0.4147
-0.0336, 0.4147
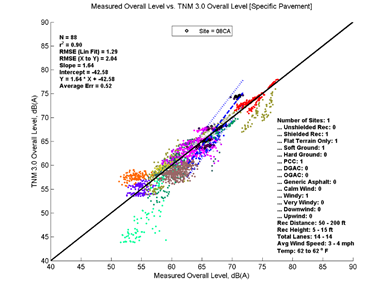
Figure I - 14: TNM 2.5 and 3.0 Predictions vs. Measured Results using Average and Specific Pavements – 08CA, adj.
Table I - 14: Summary Statistics for TNM 2.5 and 3.0 Predictions vs. Measured Results using Average and Specific Pavements – 08CA, adj.
Average Measured vs. TNM 2.5
Specific Measured vs. TNM 2.5
Average Measured vs. TNM 3.0
Specific Measured vs. TNM 3.0
N
88
36
88
88
r2
0.89
0.91
0.9
0.9
RMSE (Lin Fit)
1.27
1.21
1.29
1.29
RMSE (X to Y)
2.12
1.97
2.04
2.04
Slope
1.55
1.68
1.64
1.64
Intercept
-36.26
-45.65
-42.58
-42.58
Y
1.55 * X + -36.26
1.68 * X + -45.65
1.64 * X + -42.58
1.64 * X + -42.58
Average Error
1.1
0.3
0.52
0.52
Slope 95% CI
1.4413, 1.6686
1.5076, 1.8532
1.5244, 1.7560
1.5244, 1.7560
Intercept 95% CI
-43.9161, -28.6042
-57.3278, -33.9750
-50.3840, -34.7823
-50.3840, -34.7823
Avg Err 95% CI
0.7251, 1.4839
-0.3458, 0.9443
0.1089, 0.9364
0.1089, 0.9364
Figure I - 15: TNM 2.5 and 3.0 Predictions vs. Measured Results using Average and Specific Pavements – 09CA, adj.
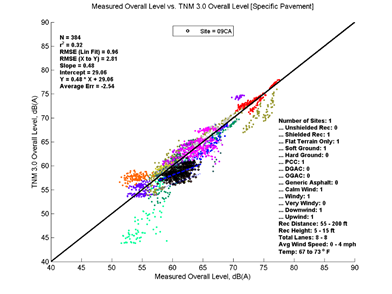
Table I - 15: Summary Statistics for TNM 2.5 and 3.0 Predictions vs. Measured Results using Average and Specific Pavements – 09CA, adj.
Average Measured vs. TNM 2.5
Specific Measured vs. TNM 2.5
Average Measured vs. TNM 3.0
Specific Measured vs. TNM 3.0
N
384
384
384
384
r2
0.21
0.24
0.32
0.32
RMSE (Lin Fit)
0.85
0.85
0.96
0.96
RMSE (X to Y)
2.44
3.18
2.81
2.81
Slope
0.32
0.35
0.48
0.48
Intercept
39.72
37.01
29.06
29.06
Y
0.32 * X + 39.72
0.35 * X + 37.01
0.48 * X + 29.06
0.48 * X + 29.06
Average Error
-2.08
-2.93
-2.54
-2.54
Slope 95% CI
0.2546, 0.3784
0.2855, 0.4083
0.4134, 0.5531
0.4134, 0.5531
Intercept 95% CI
35.9341, 43.5074
33.2512, 40.7640
24.7921, 33.3337
24.7921, 33.3337
Avg Err 95% CI
-2.2093, -1.9552
-3.0558, -2.8088
-2.6603, -2.4211
-2.6603, -2.4211
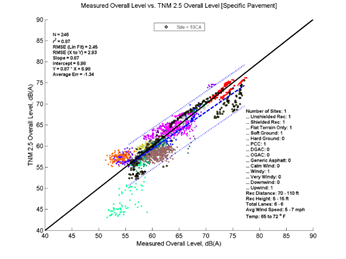
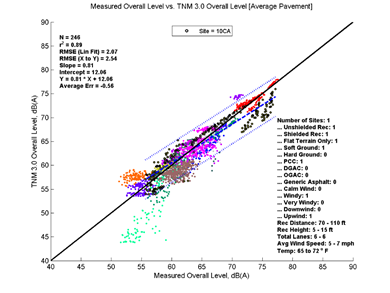
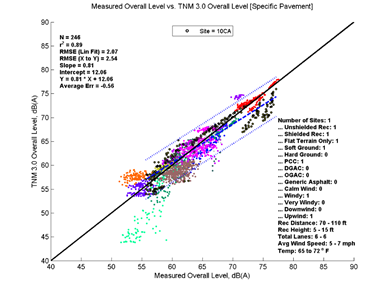
Figure I - 16: TNM 2.5 and 3.0 Predictions vs. Measured Results using Average and Specific Pavements – 10CA, adj.
Table I - 16: Summary Statistics for TNM 2.5 and 3.0 Predictions vs. Measured Results using Average and Specific Pavements – 10CA, adj.
Average Measured vs. TNM 2.5
Specific Measured vs. TNM 2.5
Average Measured vs. TNM 3.0
Specific Measured vs. TNM 3.0
N
246
246
246
246
r2
0.87
0.87
0.89
0.89
RMSE (Lin Fit)
2.28
2.45
2.07
2.07
RMSE (X to Y)
2.77
2.93
2.54
2.54
Slope
0.82
0.87
0.81
0.81
Intercept
10.52
6.98
12.06
12.06
Y
0.82 * X + 10.52
0.87 * X + 6.98
0.81 * X + 12.06
0.81 * X + 12.06
Average Error
-0.96
-1.34
-0.56
-0.56
Slope 95% CI
0.7848, 0.8647
0.8301, 0.9158
0.7711, 0.8435
0.7711, 0.8435
Intercept 95% CI
7.8876, 13.1481
4.1595, 9.7997
9.6722, 14.4413
9.6722, 14.4413
Avg Err 95% CI
-1.2823, -0.6317
-1.6660, -1.0139
-0.8745, -0.2532
-0.8745, -0.2532
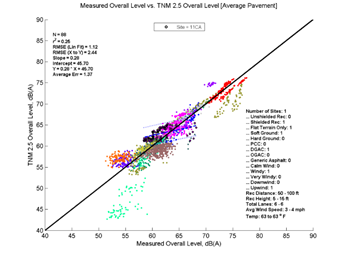
Figure I - 17: TNM 2.5 and 3.0 Predictions vs. Measured Results using Average and Specific Pavements – 11CA, adj.
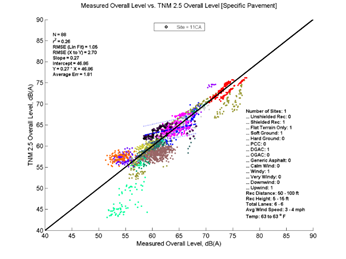
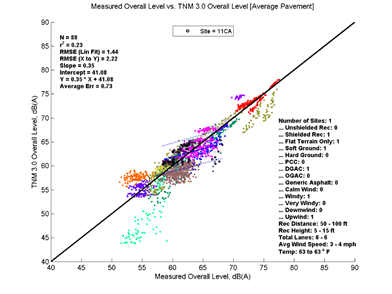
Table I - 17: Summary Statistics for TNM 2.5 and 3.0 Predictions vs. Measured Results using Average and Specific Pavements – 11CA, adj.
Average Measured vs. TNM 2.5
Specific Measured vs. TNM 2.5
Average Measured vs. TNM 3.0
Specific Measured vs. TNM 3.0
N
88
88
88
88
r2
0.25
0.26
0.23
0.23
RMSE (Lin Fit)
1.12
1.05
1.44
1.44
RMSE (X to Y)
2.44
2.7
2.22
2.22
Slope
0.28
0.27
0.35
0.35
Intercept
45.7
46.86
41.08
41.08
Y
0.28 * X + 45.70
0.27 * X + 46.86
0.35 * X + 41.08
0.35 * X + 41.08
Average Error
1.37
1.81
0.73
0.73
Slope 95% CI
0.1800, 0.3814
0.1748, 0.3631
0.2160, 0.4746
0.2160, 0.4746
Intercept 95% CI
39.4909, 51.9091
41.0555, 52.6657
33.1062, 49.0573
33.1062, 49.0573
Avg Err 95% CI
0.9467, 1.7929
1.3894, 2.2289
0.2942, 1.1730
0.2942, 1.1730
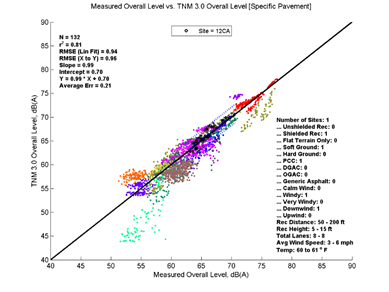
Figure I - 18: TNM 2.5 and 3.0 Predictions vs. Measured Results using Average and Specific Pavements – 12CA, adj.
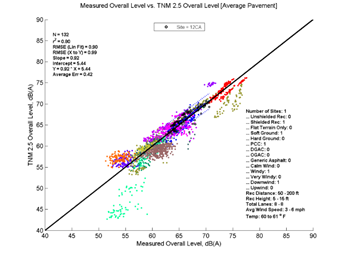
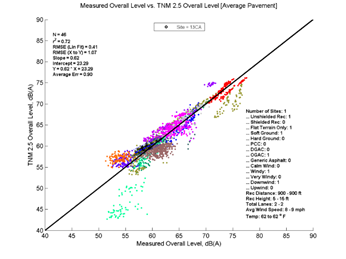
Table I - 18: Summary Statistics for TNM 2.5 and 3.0 Predictions vs. Measured Results using Average and Specific Pavements – 12CA, adj.
Average Measured vs. TNM 2.5
Specific Measured vs. TNM 2.5
Average Measured vs. TNM 3.0
Specific Measured vs. TNM 3.0
N
132
132
132
132
r2
0.8
0.81
0.81
0.81
RMSE (Lin Fit)
0.9
0.9
0.94
0.94
RMSE (X to Y)
0.99
0.96
0.96
0.96
Slope
0.92
0.94
0.99
0.99
Intercept
5.44
3.64
0.7
0.7
Y
0.92 * X + 5.44
0.94 * X + 3.64
0.99 * X + 0.70
0.99 * X + 0.70
Average Error
0.42
-0.33
0.21
0.21
Slope 95% CI
0.8455, 1.0022
0.8607, 1.0188
0.9099, 1.0752
0.9099, 1.0752
Intercept 95% CI
0.2770, 10.6097
-1.5717, 8.8556
-4.7459, 6.1558
-4.7459, 6.1558
Avg Err 95% CI
0.2670, 0.5754
-0.4841, -0.1745
0.0531, 0.3741
0.0531, 0.3741
Figure I - 19: TNM 2.5 and 3.0 Predictions vs. Measured Results using Average and Specific Pavements – 13CA, adj.
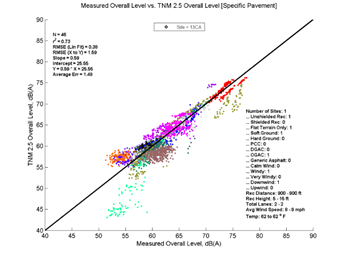
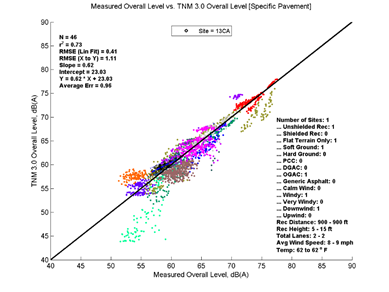
Table I - 19: Summary Statistics for TNM 2.5 and 3.0 Predictions vs. Measured Results using Average and Specific Pavements – 13CA, adj.
Average Measured vs. TNM 2.5
Specific Measured vs. TNM 2.5
Average Measured vs. TNM 3.0
Specific Measured vs. TNM 3.0
N
46
46
46
46
r2
0.72
0.73
0.73
0.73
RMSE (Lin Fit)
0.41
0.38
0.41
0.41
RMSE (X to Y)
1.07
1.59
1.11
1.11
Slope
0.62
0.59
0.62
0.62
Intercept
23.29
25.55
23.03
23.03
Y
0.62 * X + 23.29
0.59 * X + 25.55
0.62 * X + 23.03
0.62 * X + 23.03
Average Error
0.9
1.48
0.96
0.96
Slope 95% CI
0.5066, 0.7304
0.4860, 0.6938
0.5123, 0.7358
0.5123, 0.7358
Intercept 95% CI
16.7242, 29.8594
19.4532, 31.6525
16.4678, 29.5853
16.4678, 29.5853
Avg Err 95% CI
0.7355, 1.0684
1.3132, 1.6478
0.7947, 1.1250
0.7947, 1.1250
Figure I - 20: TNM 2.5 and 3.0 Predictions vs. Measured Results using Average and Specific Pavements – 14CA, adj.
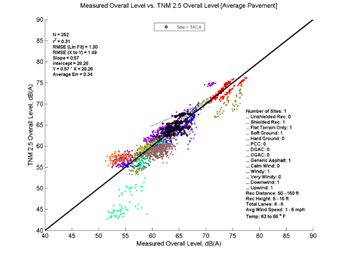
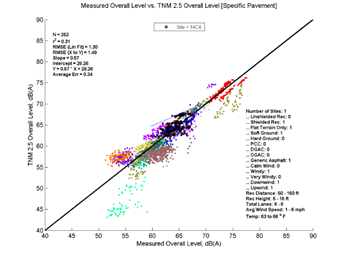
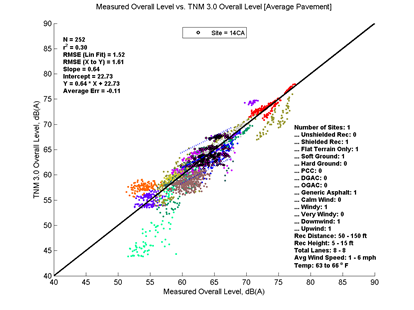
Table I - 20: Summary Statistics for TNM 2.5 and 3.0 Predictions vs. Measured Results using Average and Specific Pavements – 14CA, adj.
Average Measured vs. TNM 2.5
Specific Measured vs. TNM 2.5
Average Measured vs. TNM 3.0
Specific Measured vs. TNM 3.0
N
252
252
252
252
r2
0.31
0.31
0.3
0.3
RMSE (Lin Fit)
1.3
1.3
1.52
1.52
RMSE (X to Y)
1.49
1.49
1.61
1.61
Slope
0.57
0.57
0.64
0.64
Intercept
28.26
28.26
22.73
22.73
Y
0.57 * X + 28.26
0.57 * X + 28.26
0.64 * X + 22.73
0.64 * X + 22.73
Average Error
0.34
0.34
-0.11
-0.11
Slope 95% CI
0.4611, 0.6702
0.4611, 0.6702
0.5224, 0.7669
0.5224, 0.7669
Intercept 95% CI
21.5409, 34.9840
21.5409, 34.9840
14.8716, 30.5956
14.8716, 30.5956
Avg Err 95% CI
0.1624, 0.5217
0.1624, 0.5217
-0.3062, 0.0910
-0.3062, 0.0910
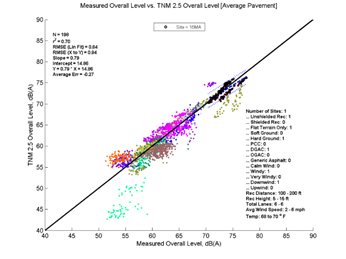
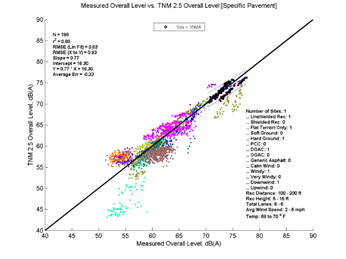
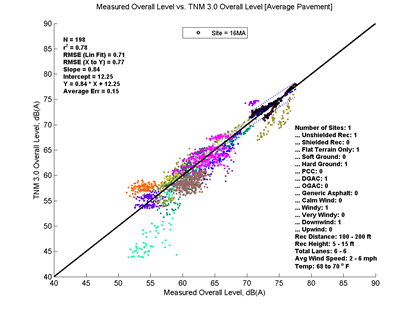
Figure I - 21: TNM 2.5 and 3.0 Predictions vs. Measured Results using Average and Specific Pavements – 16MA, adj.
Table I - 21: Summary Statistics for TNM 2.5 and 3.0 Predictions vs. Measured Results using Average and Specific Pavements – 16MA, adj.
Average Measured vs. TNM 2.5
Specific Measured vs. TNM 2.5
Average Measured vs. TNM 3.0
Specific Measured vs. TNM 3.0
N
198
198
198
198
r2
0.7
0.69
0.78
0.78
RMSE (Lin Fit)
0.84
0.83
0.71
0.71
RMSE (X to Y)
0.94
0.93
0.77
0.77
Slope
0.79
0.77
0.84
0.84
Intercept
14.86
16.3
12.25
12.25
Y
0.79 * X + 14.86
0.77 * X + 16.30
0.84 * X + 12.25
0.84 * X + 12.25
Average Error
-0.27
-0.23
0.15
0.15
Slope 95% CI
0.7208, 0.8671
0.7026, 0.8473
0.7733, 0.8972
0.7733, 0.8972
Intercept 95% CI
9.4858, 20.2364
10.9867, 21.6167
7.6947, 16.8043
7.6947, 16.8043
Avg Err 95% CI
-0.3997, -0.1486
-0.3522, -0.1002
0.0422, 0.2535
0.0422, 0.2535
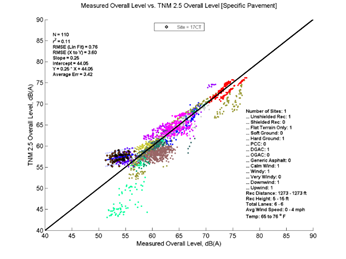
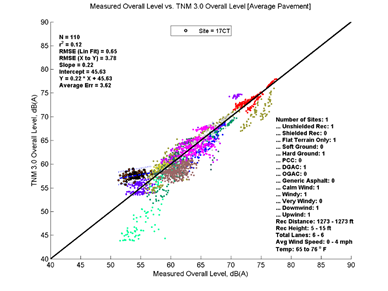
Figure I - 22: TNM 2.5 and 3.0 Predictions vs. Measured Results using Average and Specific Pavements – 17CT, adj.
Table I - 22: Summary Statistics for TNM 2.5 and 3.0 Predictions vs. Measured Results using Average and Specific Pavements – 17CT, adj.