APPENDIX G: COMPARISON OF MODELED RESULTS FOR TNM 2.5, 2.6, AND 3.0
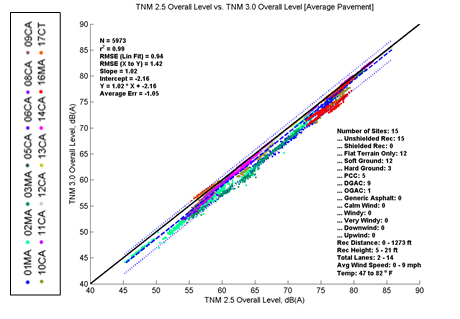
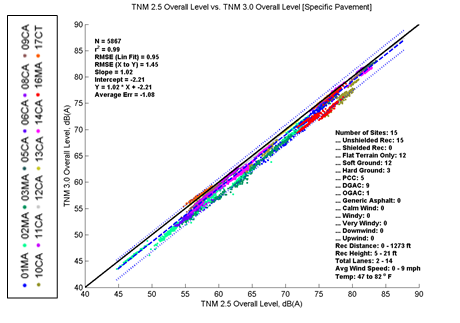
G.1 TNM 2.5 and TNM 3.0
Figure G - 1: TNM 2.5 Predictions vs. TNM 3.0 Predictions using Average Pavement – All DataFigure G - 2: TNM 2.5 Predictions vs. TNM 3.0 Predictions using Specific Pavement – All Data
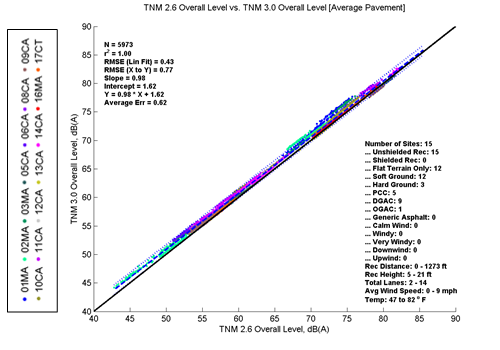
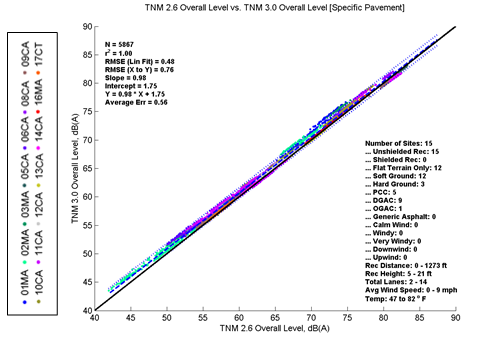
G.2 TNM 2.6 and 3.0
Figure G - 3: TNM 2.6 Predictions vs. TNM 3.0 Predictions using Average Pavement – All DataFigure G - 4: TNM 2.6 Predictions vs. TNM 3.0 Predictions using Specific Pavement – All Data