Larson Davis Laboratories (Instrumentation Company)
OGAC
Open Graded Asphalt Concrete
PCC
Portland Cement Concrete
RMS
Root Mean Squared
RMSE
Root Mean Squared Error
SLM
Sound Level Meter
SPL
Sound Pressure Level
TNM
Traffic Noise Model
TAMS
Transportable Automated Meteorological Stations
ANSI
American National Standards Institute
Executive Summary
The Federal Highway Administration (FHWA), conducted a validation study to quantify the agreement of FHWA's Traffic Noise Model Version 3.0 (TNM 3.0) with measured highway noise data and also with predictions from TNM 2.5.
The FHWA Traffic Noise Model (TNM), first released in 1998, has been a valuable tool for highway traffic noise analysis and barrier design. Given the utility and impact of TNM, it is necessary to validate the sound level predictions to ensure accuracy. In 2002, the FHWA completed a comprehensive Validation of TNM 2.5. This validation included collection and analysis of traffic noise data at seventeen highway sites around the country (the validation dataset). These sites had characteristics of those most commonly modeled by TNM users: open areas next to the highway with acoustically soft ground (e.g., lawn); open areas with acoustically hard ground (e.g., pavement or water); and areas next to the highway with an open area behind a single noise barrier.
The most recent version of TNM, version 3.0, includes improved acoustical computations as well as minor changes and updates. These improvements include:
Bug Fixes
One affecting ground impedance averaging (Bug 1)
One affecting the selection of highest path points (Bug 2)
The removal of interpolation/extrapolation at lowest and highest one-third octave bands
The replacement of horizontal divergence with combined horizontal and vertical divergence
A change in the manner in which elemental triangles are determined
Updated computations for Day-night equivalent Level (Ldn) and Day-evening-night equivalent level (Lden)
Added percentile level computations, L10 and L50
Changes to vehicle speed computations to make them more robust
The correction of a few coefficients in the reference emission level (REMEL) database
The standardization of effective flow resistivity (EFR) and noise reduction coefficient (NRC) values
Because of these changes, it is advisable once again to validate the model against the measured validation dataset in order to ascertain the model's accuracy in predicting practical site conditions. This report contains the results of this validation study; leveraging the original validation dataset, to compare and contrast measured data against TNM 3.0 predictions, providing continuity and consistency of analyses. Following the methodology of the TNM 2.5 validation study, TNM 3.0 predictions were generated for all 5-minute time blocks using input files from the TNM 2.5 studies, exported to TNM 3.0 compatible format. Predictions were first generated for all 5-minute time blocks using Average pavement. As an additional analysis set, predictions were also generated with the TNM specific pavement (Dense Graded Asphalt Concrete (DGAC), Open Graded Asphalt Concrete (OGAC), or Portland Cement Concrete (PCC)) that best matched the site. Although other factors are confounded with pavement type, comparing data modeled with specific pavement type against measured data can provide additional insight by accounting for one known deviation between sites as modeled and actual measurements.
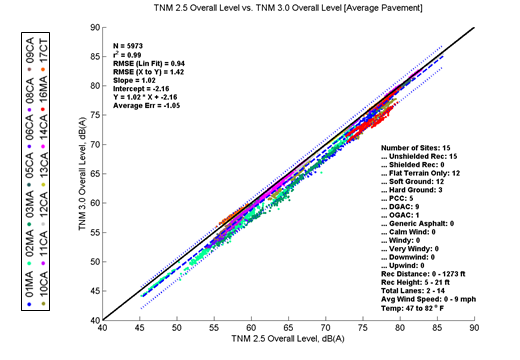
Changes in predictions between TNM 2.5 and TNM 3.0 were first examined, as it is important to understand how the model improvements affect results under a variety of conditions, as well as providing historical context. A direct comparison of levels predicted by TNM 2.5 and TNM 3.0 for the measured validation dataset is shown in Figure 1. This figure shows that TNM 3.0 predicts values about 1 dB lower than TNM 2.5. In the figure, the colored circles represent individual 5-minute model computations (color coding is given in the legend); the blue dashed line shows a first-order linear regression between the two datasets; the blue dotted lines indicate the 95-percent prediction interval for any new computations; and the solid black line indicates where all results would fall if both models gave the same predictions for all analyses. Although the statistical parameters (noted in the top left corner of the graphic) indicate good average agreement, individual predictions are somewhat varied between models, since 95-percent of the variation falls within a +/-2.78 dB range.
Figure 1: Comparison of Predicted Levels between TNM Version 2.5 and Version 3.0 (Measurement Data)
The variation is due to the combined effects of all changes between TNM 2.5 and 3.0. Further exploration was completed to understand the major contributors to the variation. An analysis of predictions found that the largest differences occurred at sites with multiple ground types, especially at larger source-to-receiver distances, while smaller differences occur at sites where multiple ground impedances are not part of the computations (sites with a single ground type). As a result, it was concluded that the first bug fix accounts for a significant portion of the observed differences between TNM 2.5 and 3.0 for the measured validation dataset.
In addition to reanalyzing the original measured validation dataset, sites that are included in the Consistency Test Suite (CTS) were also used to explore changes in predictions between TNM 2.5 and TNM 3.0. The CTS sites have a large number of receivers and can show how differences in TNM versions change more continuously as a function of distance or location. These sites also provide a greater diversity of acoustically significant structures and traffic flow. These models, however, do not include measurement data. For these model sites, it was found that on average TNM 3.0 predicts values about 2 dB lower than TNM 2.5. Although the statistical parameters indicate good average agreement, individual predictions are somewhat inconsistent between models, since 95-percent of the variation falls within +/- 5.33 dB range. This larger prediction interval is not surprising, as the CTS sites incorporate a greater number TNM's features, and thus a greater number of improvements between TNM 2.5 and TNM 3.0 can potentially affect results.
A research version of TNM (TNM 2.6), which included several bug fixes including the fix to the ground impedance averaging bug but not the remainder of the TNM 3.0 improvements, was utilized to identify causes of variation outside of the bug fixes. The average Root Mean Squared (RMS) difference between TNM 2.6 and 3.0 is small, 0.43 dB, compared to 1.42 dB between TNM 2.5 and 3.0, so, from a sound pressure level perspective, 70% of the variation is due to bug fixes (especially the fix to the ground impedance averaging). Further exploration of the data found that much of the remaining variation was the result of receivers at somewhat extreme locations: 1) large heights (up to 60 ft above ground), 2) large distances (up to 1600 ft from the roadway), and 3) positions near the end of the roadway oriented in a line perpendicular to the roadway. Computations for these receivers were affected by the following TNM 3.0 improvements:
The replacement of horizontal divergence with combined horizontal and vertical divergence,
The removal of interpolation/extrapolation at lowest and highest one-third octave bands, and
A change in the manner in which elemental triangles are determined.
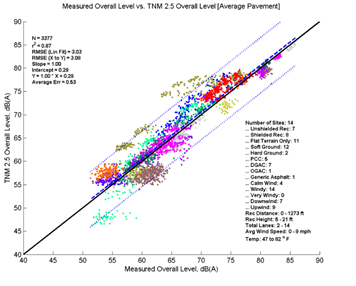
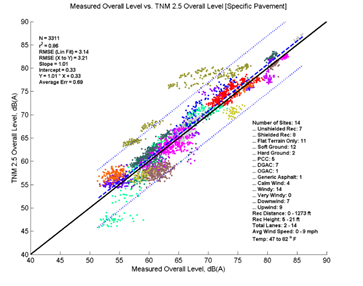
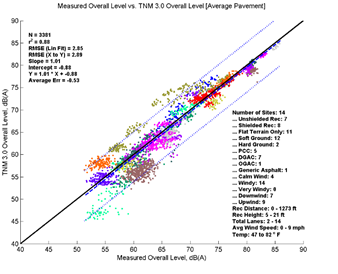
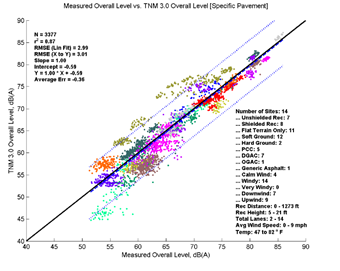
Finally, comparison of the measured validation dataset and model predictions was performed. The initial comparison, shown in Figure 2, includes all data in aggregate and was performed for four model variations: 1) TNM 2.5 with Average pavement (top left), 2) TNM 3.0 with Average pavement (bottom left) 3) TNM 2.5 with specific pavement (top right) and 4) TNM 3.0 with specific pavement (bottom right). The formatting is similar to Figure 1, except in this presentation the levels on the x-axis correspond to measured data instead of a second set of modeled data.
Figure 2: TNM 2.5 and 3.0 Predictions and Measured Results using Average and Specific Pavements for All Data Analyzed
Figure 2 shows that TNM 2.5 (top two graphics) on average over predicts the measured data while TNM 3.0 (bottom two graphics) under predicts the measured data. This trend is consistent over the range of measured sound levels; the offset between the solid black line and dashed regression line is nearly constant. Modeling with specific pavement types does not change the overall picture greatly; the same general trends are visible in both sets of results. Modeled with average pavement, TNM 2.5 on average over predicts these data by 0.53 dB, while TNM 3.0 under predicts these data by -0.53 dB. Modeled with specific pavements, the average error is shifted upward to 0.69 for TNM 2.5 and -0.36 for TNM 3.0; a result of modeling 5 of the 14 sites with PCC pavement. Because PCC typically has much higher sound pressure levels than Average pavement, while DGAC has only slightly lower sound pressure levels than Average pavement for the same traffic, one would expect an upward shift in these results modeled with specific pavements.
To determine if TNM 3.0 is performing better or worse for a specific type of site, comparisons were also performed for several sub-sets of the data: sites with acoustically hard or soft ground, sites with or without a barrier, receivers at near, medium and far distances, and on a site-by-site basis. These results are summarized as follows:
Sites with acoustically soft ground: TNM 3.0 and TNM 2.5 have similar magnitudes in average prediction errors. TNM 3.0 on average under predicts soft ground by 0.81 dB with Average pavement and by 0.47 dB with specific pavements. TNM 2.5 on average over predicts soft ground by 0.23 dB with Average pavement and by 0.56 dB with specific pavements.
Sites with acoustically hard ground: TNM 3.0 has smaller magnitudes in average prediction errors. TNM 3.0 on average over predicts hard ground by 1.11 dB with Average pavement and by 0.25 dB with specific pavements. TNM 2.5 on average over predicts hard ground by 2.29 dB with Average pavement and by 1.4 dB with specific pavements.
Sites without a barrier (Open sites): TNM 3.0 has smaller magnitudes in average prediction errors. TNM 3.0 on average over predicts open sites by 0.4 dB with Average pavement and under predicts by 0.11 dB with specific pavements. TNM 2.5 on average over predicts open sites by 1.98 dB with Average pavement and by 1.46 dB with specific pavements.
Sites with a barrier: TNM 3.0 has larger magnitudes in average prediction errors. TNM 3.0 on average under predicts sites with barriers by 1.15 dB with Average pavement and by 0.53 dB with specific pavements. TNM 2.5 on average under predicts sites with barriers by 0.44 dB with Average pavement and over predicts by 0.15 dB with specific pavements.
Comparisons for Measurements at Similar Distances: Distance effects are especially difficult to analyze in the aggregate because all possible confounding factors tend to show up in each distance category. For example, data for acoustically hard and soft ground, and for sites with and without barriers are present for receivers at most distances. Thus, interactions between distance and ground type, barrier presence, and pavement type may be present at all distances. Even so, it is still useful to consider how each model is performing at various distances.
Distances less than 125 feet: TNM 3.0 has smaller magnitudes in average prediction errors. TNM 3.0 on average under predicts near distances by 0.17 dB with Average pavement and over predicts by 0.19 dB with specific pavements. TNM 2.5 on average over predicts near distances by 0.78 dB with Average pavement and by 1.15 dB with specific pavements.
Distances between 125 and 500 feet: TNM 3.0 has larger magnitudes in average prediction errors. TNM 3.0 on average under predicts middle distances by 1.21 dB with Average pavement and over predicts by 1.2 dB with specific pavements. TNM 2.5 on average over predicts middle distances by 0.18 dB with Average pavement and by 0.12 dB with specific pavements.
Distances greater than 500 feet: TNM 3.0 has larger magnitudes in average prediction errors. TNM 3.0 on average under predicts far distances by 0.78 dB with Average pavement and by 1.37 dB with specific pavements. TNM 2.5 on average over predicts middle distances by 0.03 dB with Average pavement and under predicts by 0.55 dB with specific pavements.
Site-by-site basis: In general, the trends for individual sites mirror trends for the groupings noted above. TNM 2.5 tends to over predict measured data while TNM 3.0 tends to under predict measured data; modeling with specific pavements increases overall levels when sites include PCC pavements.
Overall, when predictions were compared to measured data, both TNM 2.5 and TNM 3.0 performed similarly, but not identically. In general, the correlation and variance were not significantly different; however, biases as measured by average errors showed that TNM 2.5 tends to over predict measured data by about 0.5 dB while TNM 3.0 tends to under predict measured data by about 0.5 dB. The differences between the predicted results (TNM 2.5 to TNM 3.0) were generally found to be the result of a correction to the computation of Fresnel ellipses used to account for changes in ground impedance between source and receiver. This primarily affected sites with acoustically soft ground. It should be noted that the Fresnel ellipse correction may also affect the pre-computed sub-source corrections used to project the reference sound level (REMELs) data at 50 feet back to the source; these were derived during TNM's original development. This may explain why TNM 3.0 is predicting about 1 dB lower than TNM 2.5 on average for the measured validation dataset. It is recommended that the sub-source corrections be recomputed using TNM 3.0 and the datasets in this report be compared again to document any improvements obtained.