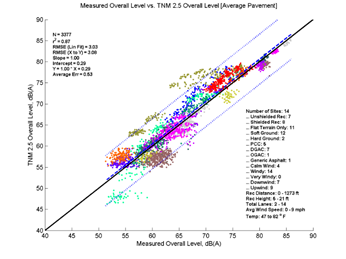
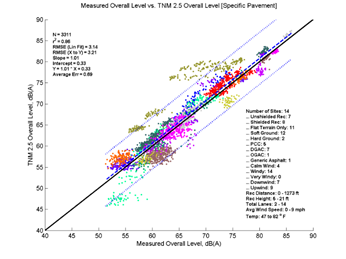
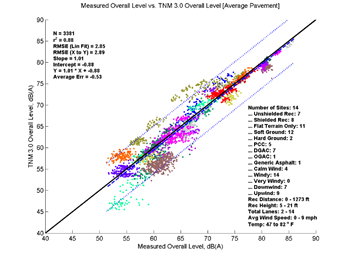
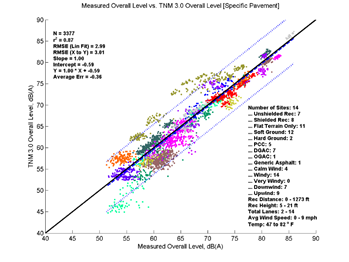
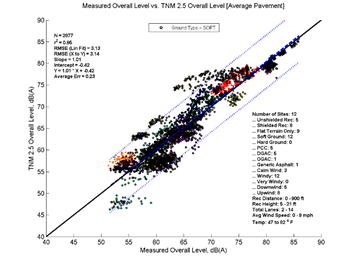
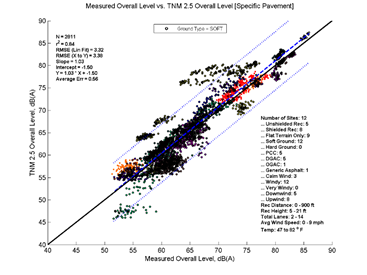
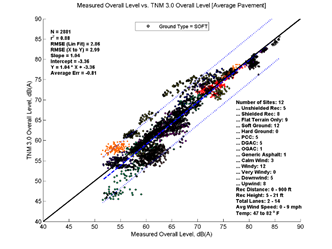
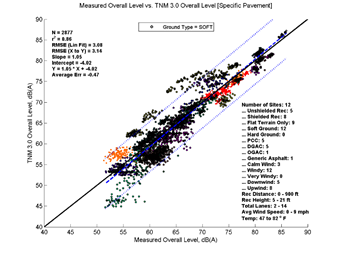
APPENDIX H: COMPARISON OF MODELED AND MEASURED RESULTS (NOT ADJUSTED FOR REFERENCE MICROPHONE)
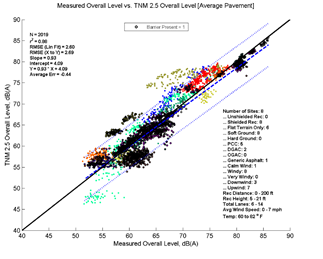
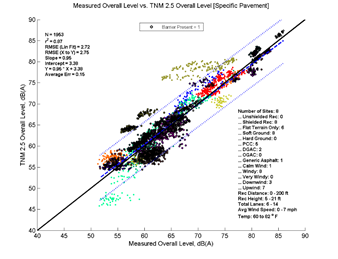
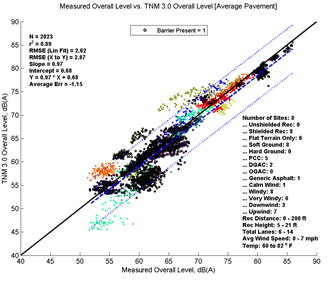
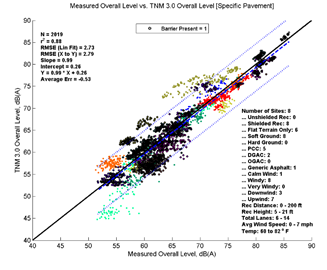
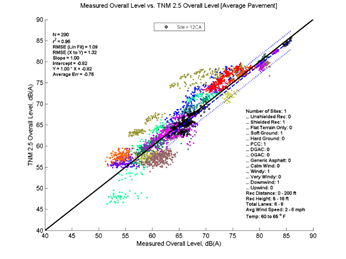
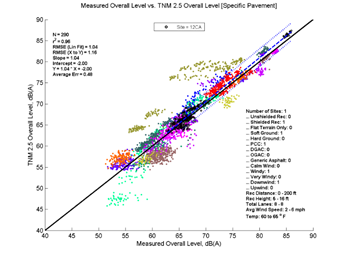
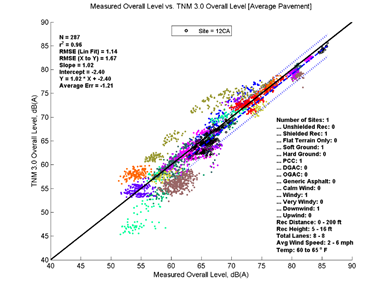
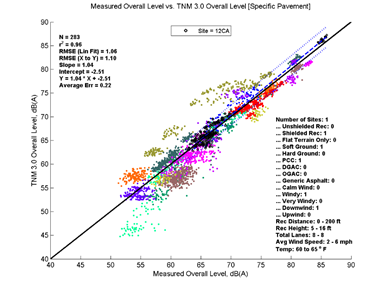
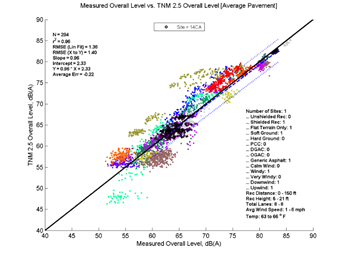
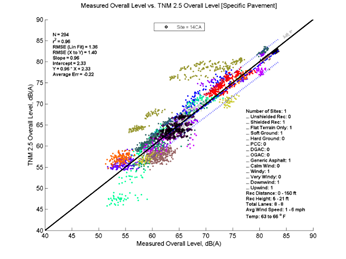
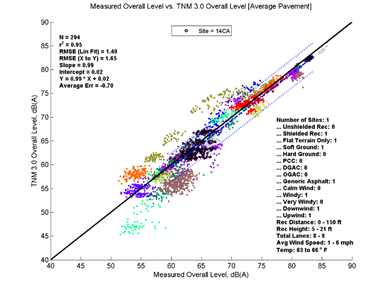
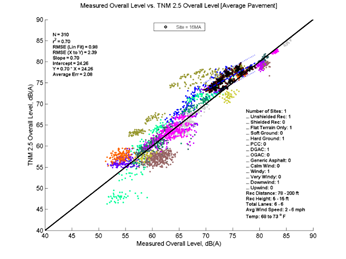
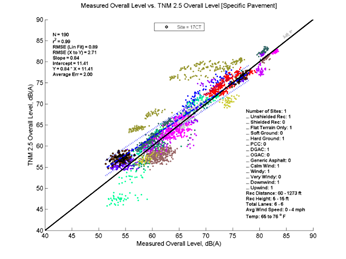
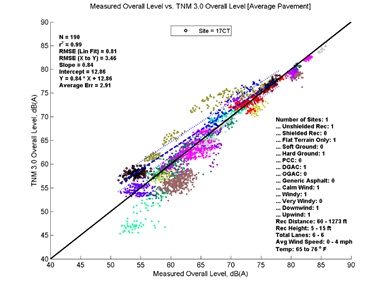
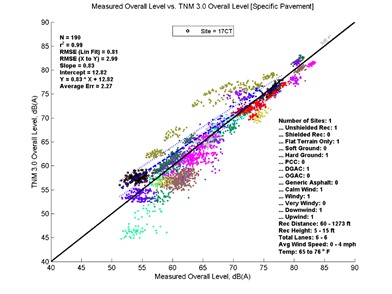
In these figures, the colored circles represent individual 5-minute model computations (color coding is given in the legend); the blue dashed line shows the first-order linear regression between the two datasets; the blue dotted lines indicate the 95-percent prediction interval for any new computations; and the solid black line indicates where all results would fall if both models gave the same predictions for all analyses. Note that in the upper left-hand corner of the graph several statistical parameters are presented: the number of samples, the coefficient of determination (r2), the root mean squared error (RMSE), the regression slope and intercept, the regression equation, and the average difference. These statistics are also repeated in the tables that follow. In the lower right-hand corner, a metadata summary is provided covering the number of sites, the presence of a barrier, receiver distances and heights, number of roadway lanes, pavement type, and temperature and wind conditions included in the analysis. Each site is presented in a different color to help highlight any potential grouping of the data.
In general, the larger the sample size, the higher the confidence for the computation of all parameters. In this report, the maximum number of modeled samples is 5987. When sub-sets are examined, the number of samples will be smaller. The r2 provides a measure of correlation. The RMSE provides a measure of absolute variation between the two predictions and represents the sample standard deviation. A slope (m) of one indicates that for every 1-dB change in one model's prediction there will be an identical 1-dB change in the other model's prediction. If the slope is less than one, then the model on the y-axis tends to change predictions slower than the model on the x-axis and vice versa. If the intercept (b) is zero and the slope is one, then there is perfect agreement between the two datasets. If the intercept is negative, then the model on the y-axis predicts lower levels than the model on the x-axis for low levels and vice versa; however, the average difference provides a measure of the overall bias between the two datasets.
H.1 TNM Predictions vs. Measured Results - All Data Analyzed
Figure H - 1: TNM 2.5 and 3.0 Predictions vs. Measured Results using Average and Specific Pavements – All Data
Table H - 1: Summary Statistics for TNM 2.5 and 3.0 Predictions vs. Measured Results using Average and Specific Pavements – All Data
Average Measured vs. TNM 2.5
Specific Measured vs. TNM 2.5
Average Measured vs. TNM 3.0
Specific Measured vs. TNM 3.0
N
3377
3311
3381
3377
r2
0.87
0.86
0.88
0.87
RMSE (Lin Fit)
3.03
3.14
2.85
2.99
RMSE (X to Y)
3.08
3.21
2.89
3.01
Slope
1
1.01
1.01
1
Intercept
0.29
0.33
-0.88
-0.59
Y
1.00 * X + 0.29
1.01 * X + 0.33
1.01 * X + -0.88
1 * X + -0.59
Average Error
0.53
0.69
-0.53
-0.36
Slope 95% CI
0.9904, 1.0169
0.9917, 1.0193
0.9929, 1.0178
0.9905, 1.0166
Intercept 95% CI
-0.5799, 1.1691
-0.5835, 1.2424
-1.6994, -0.0606
-1.4548, 0.2686
Avg Err 95% CI
0.4320, 0.6367
0.5822, 0.7961
-0.6258, -0.4339
-0.4613, -0.2595
H.2 TNM Predictions vs. Measured Results - Ground Type
Figure H - 2: TNM 2.5 and 3.0 Predictions vs. Measured Results using Average and Specific Pavements – Acoustically Soft Ground
Table H - 2: Summary Statistics for TNM 2.5 and 3.0 Predictions vs. Measured Results using Average and Specific Pavements – Acoustically Soft Ground
Average Measured vs. TNM 2.5
Specific Measured vs. TNM 2.5
Average Measured vs. TNM 3.0
Specific Measured vs. TNM 3.0
N
2877
2811
2881
2877
r2
0.85
0.84
0.88
0.86
RMSE (Lin Fit)
3.13
3.32
2.86
3.08
RMSE (X to Y)
3.14
3.38
2.99
3.14
Slope
1.01
1.03
1.04
1.05
Intercept
-0.42
-1.5
-3.36
-4.02
Y
1.01 * X + -0.42
1.03 * X + -1.50
1.04 * X + -3.36
1.05 * X + -4.02
Average Error
0.23
0.56
-0.81
-0.47
Slope 95% CI
0.9943, 1.0257
1.0149, 1.0487
1.0249, 1.0535
1.0393, 1.0701
Intercept 95% CI
-1.4472, 0.6036
-2.6034, -0.3998
-4.2985, -2.4254
-5.0286, -3.0142
Avg Err 95% CI
0.1140, 0.3430
0.4404, 0.6866
-0.9187, -0.7085
-0.5800, -0.3530
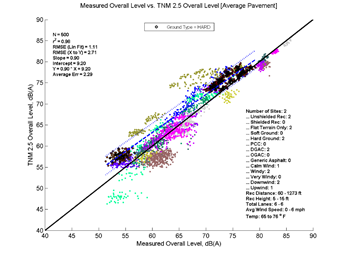
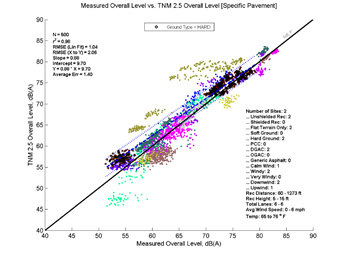
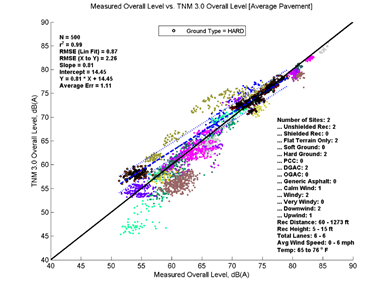
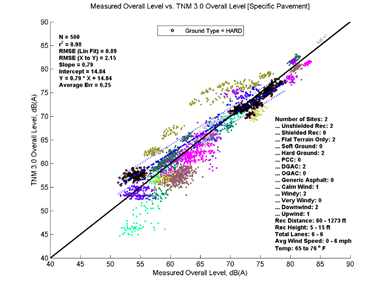
Figure H - 3: TNM 2.5 and 3.0 Predictions vs. Measured Results using Average and Specific Pavements – Acoustically Hard Ground
Table H - 3: Summary Statistics for TNM 2.5 and 3.0 Predictions vs. Measured Results using Average and Specific Pavements – Acoustically Hard Ground
Average Measured vs. TNM 2.5
Specific Measured vs. TNM 2.5
Average Measured vs. TNM 3.0
Specific Measured vs. TNM 3.0
N
500
500
500
500
r2
0.98
0.98
0.99
0.98
RMSE (Lin Fit)
1.11
1.04
0.87
0.89
RMSE (X to Y)
2.71
2.06
2.26
2.15
Slope
0.9
0.88
0.81
0.79
Intercept
9.2
9.7
14.45
14.84
Y
0.90 * X + 9.20
0.88 * X + 9.70
0.81 * X + 14.45
0.79 * X + 14.84
Average Error
2.29
1.4
1.11
0.25
Slope 95% CI
0.8890, 0.9103
0.8694, 0.8894
0.7979, 0.8146
0.7796, 0.7967
Intercept 95% CI
8.4623, 9.9421
9.0074, 10.3975
13.8671, 15.0255
14.2416, 15.4297
Avg Err 95% CI
2.1679, 2.4207
1.2621, 1.5286
0.9319, 1.2784
0.0628, 0.4372
H.3 TNM Predictions vs. Measured Results - Barriers
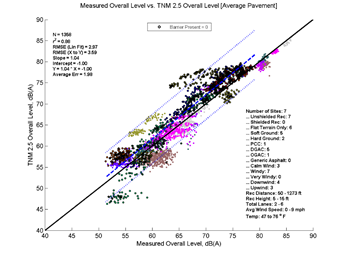
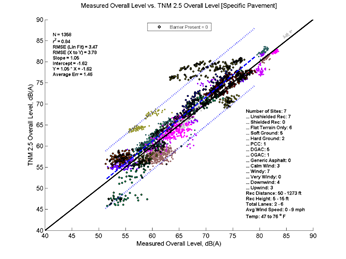
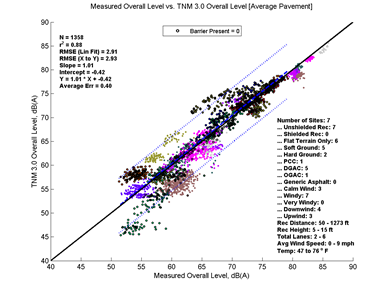
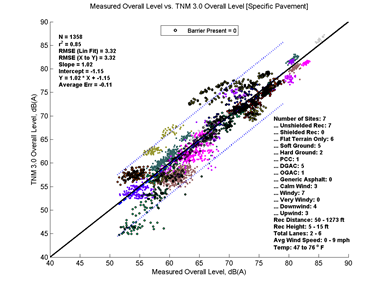
Figure H - 4: TNM 2.5 and 3.0 Predictions vs. Measured Results using Average and Specific Pavements – Sites without Barriers
Table H - 4: Summary Statistics for TNM 2.5 and 3.0 Predictions vs. Measured Results using Average and Specific Pavements – Sites without Barriers
Average Measured vs. TNM 2.5
Specific Measured vs. TNM 2.5
Average Measured vs. TNM 3.0
Specific Measured vs. TNM 3.0
N
1358
1358
1358
1358
r2
0.88
0.84
0.88
0.85
RMSE (Lin Fit)
2.97
3.47
2.91
3.32
RMSE (X to Y)
3.59
3.78
2.93
3.32
Slope
1.04
1.05
1.01
1.02
Intercept
-1
-1.62
-0.42
-1.15
Y
1.04 * X + -1.00
1.05 * X + -1.62
1.01 * X + -0.42
1.02 * X + -1.15
Average Error
1.98
1.46
0.4
-0.11
Slope 95% CI
1.0239, 1.0650
1.0219, 1.0700
0.9921, 1.0323
0.9924, 1.0384
Intercept 95% CI
-2.3920, 0.3847
-3.2487, 0.0004
-1.7805, 0.9394
-2.7003, 0.4078
Avg Err 95% CI
1.8252, 2.1430
1.2760, 1.6473
0.2439, 0.5533
-0.2905, 0.0631
Figure H - 5: TNM 2.5 and 3.0 Predictions vs. Measured Results using Average and Specific Pavements – Sites with Barriers
Table H - 5: Summary Statistics for TNM 2.5 and 3.0 Predictions vs. Measured Results using Average and Specific Pavements – Sites with Barriers
Average Measured vs. TNM 2.5
Specific Measured vs. TNM 2.5
Average Measured vs. TNM 3.0
Specific Measured vs. TNM 3.0
N
2019
1953
2023
2019
r2
0.88
0.87
0.89
0.88
RMSE (Lin Fit)
2.6
2.72
2.62
2.73
RMSE (X to Y)
2.69
2.75
2.87
2.79
Slope
0.93
0.95
0.97
0.99
Intercept
4.09
3.38
0.68
0.26
Y
0.93 * X + 4.09
0.95 * X + 3.38
0.97 * X + 0.68
0.99 * X + 0.26
Average Error
-0.44
0.15
-1.15
-0.53
Slope 95% CI
0.9148, 0.9447
0.9339, 0.9659
0.9565, 0.9867
0.9720, 1.0035
Intercept 95% CI
3.1158, 5.0622
2.3422, 4.4155
-0.3013, 1.6561
-0.7590, 1.2864
Avg Err 95% CI
-0.5564, -0.3251
0.0303, 0.2737
-1.2675, -1.0387
-0.6457, -0.4070
H.4 TNM Predictions vs. Measured Results – Distance
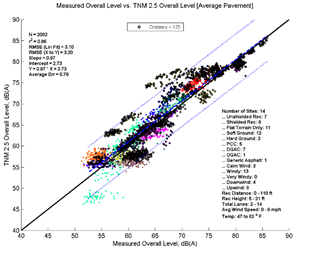
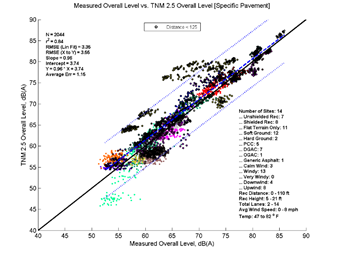
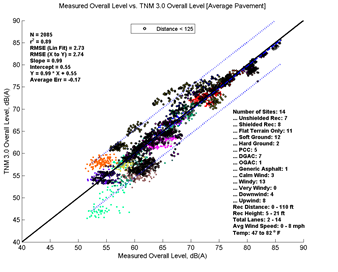
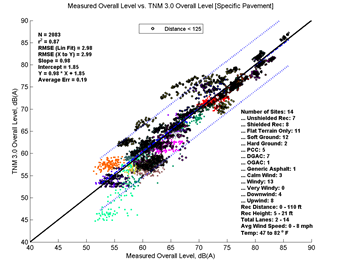
Figure H - 6: TNM 2.5 and 3.0 Predictions vs. Measured Results using Average and Specific Pavements – Measurement Locations within 125 Feet of the Center of the Nearest Lane
Table H - 6: Summary Statistics for TNM 2.5 and 3.0 Predictions vs. Measured Results using Average and Specific Pavements – Measurement Locations within 125 Feet of the Center of the Nearest Lane
Average Measured vs. TNM 2.5
Specific Measured vs. TNM 2.5
Average Measured vs. TNM 3.0
Specific Measured vs. TNM 3.0
N
2082
2044
2085
2083
r2
0.86
0.84
0.89
0.87
RMSE (Lin Fit)
3.1
3.35
2.73
2.98
RMSE (X to Y)
3.2
3.55
2.74
2.99
Slope
0.97
0.96
0.99
0.98
Intercept
2.73
3.74
0.55
1.85
Y
0.97 * X + 2.73
0.96 * X + 3.74
0.99 * X + 0.55
0.98 * X + 1.85
Average Error
0.78
1.15
-0.17
0.19
Slope 95% CI
0.9544, 0.9881
0.9433, 0.9801
0.9745, 1.0042
0.9593, 0.9916
Intercept 95% CI
1.5789, 3.8733
2.4910, 4.9919
-0.4618, 1.5582
0.7491, 2.9487
Avg Err 95% CI
0.6445, 0.9117
1.0058, 1.2974
-0.2915, -0.0567
0.0586, 0.3149
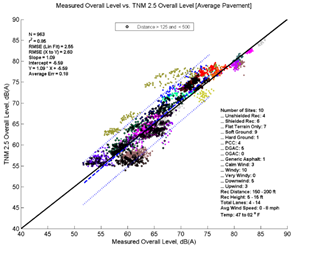
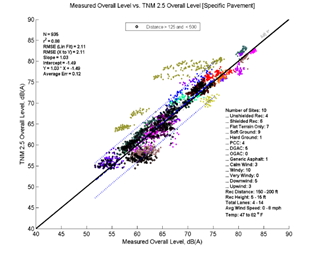
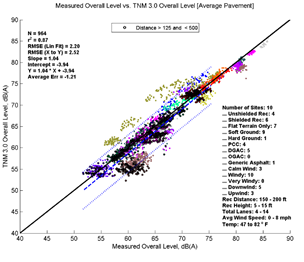
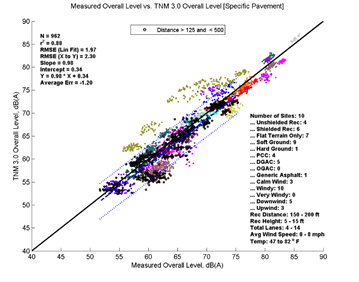
Figure H - 7: TNM 2.5 and 3.0 Predictions vs. Measured Results using Average and Specific Pavements – Measurement Locations between 125 and 500 Feet of the Center of the Nearest Lane
Table H - 7: Summary Statistics for TNM 2.5 and 3.0 Predictions vs. Measured Results using Average and Specific Pavements – Measurement Locations between 125 and 500 Feet of the Center of the Nearest Lane
Average Measured vs. TNM 2.5
Specific Measured vs. TNM 2.5
Average Measured vs. TNM 3.0
Specific Measured vs. TNM 3.0
N
963
935
964
962
r2
0.85
0.88
0.87
0.88
RMSE (Lin Fit)
2.55
2.11
2.2
1.97
RMSE (X to Y)
2.6
2.11
2.52
2.3
Slope
1.09
1.03
1.04
0.98
Intercept
-5.59
-1.49
-3.94
0.34
Y
1.09 * X + -5.59
1.03 * X + -1.49
1.04 * X + -3.94
0.98 * X + 0.34
Average Error
0.18
0.12
-1.21
-1.2
Slope 95% CI
1.0605, 1.1193
1.0006, 1.0497
1.0170, 1.0677
0.9534, 0.9987
Intercept 95% CI
-7.4903, -3.6969
-3.0741, 0.0846
-5.5688, -2.3021
-1.1159, 1.8032
Avg Err 95% CI
0.0159, 0.3441
-0.0156, 0.2548
-1.3529, -1.0737
-1.3199, -1.0710
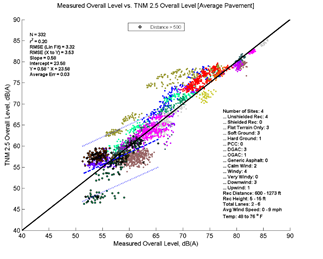
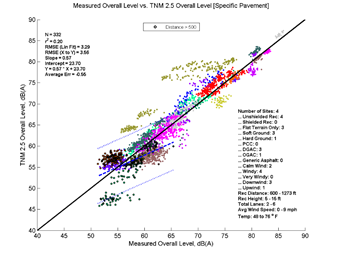
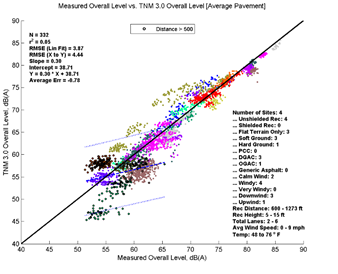
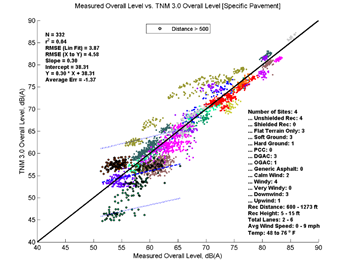
Figure H - 8: TNM 2.5 and 3.0 Predictions vs. Measured Results using Average and Specific Pavements – Measurement Locations Greater than 500 Feet of the Center of the Nearest Lane
Table H - 8: Summary Statistics for TNM 2.5 and 3.0 Predictions vs. Measured Results using Average and Specific Pavements – Measurement Locations Greater than 500 Feet of the Center of the Nearest Lane
Average Measured vs. TNM 2.5
Specific Measured vs. TNM 2.5
Average Measured vs. TNM 3.0
Specific Measured vs. TNM 3.0
N
332
332
332
332
r2
0.2
0.2
0.05
0.04
RMSE (Lin Fit)
3.32
3.29
3.87
3.87
RMSE (X to Y)
3.53
3.56
4.44
4.58
Slope
0.58
0.57
0.3
0.3
Intercept
23.58
23.7
38.71
38.31
Y
0.58 * X + 23.58
0.57 * X + 23.70
0.30 * X + 38.71
0.30 * X + 38.31
Average Error
0.03
-0.55
-0.78
-1.37
Slope 95% CI
0.4589, 0.7044
0.4473, 0.6909
0.1551, 0.4418
0.1519, 0.4381
Intercept 95% CI
16.6637, 30.5018
16.8356, 30.5669
30.6346, 46.7915
30.2448, 46.3812
Avg Err 95% CI
-0.3461, 0.4134
-0.9325, -0.1754
-1.2501, -0.3089
-1.8442, -0.9029
H.5 Variation by Site
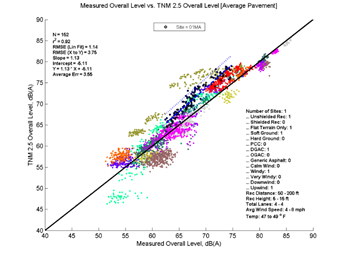
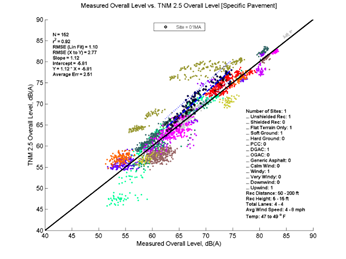
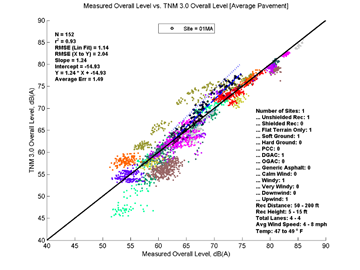
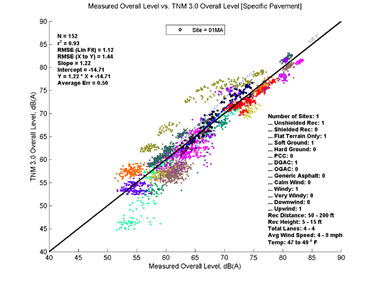
Figure H - 9: TNM 2.5 and 3.0 Predictions vs. Measured Results using Average and Specific Pavements – 01MA
Table H - 9: Summary Statistics for TNM 2.5 and 3.0 Predictions vs. Measured Results using Average and Specific Pavements – 01MA
Average Measured vs. TNM 2.5
Specific Measured vs. TNM 2.5
Average Measured vs. TNM 3.0
Specific Measured vs. TNM 3.0
N
152
152
152
152
r2
0.92
0.92
0.93
0.93
RMSE (Lin Fit)
1.14
1.1
1.14
1.12
RMSE (X to Y)
3.75
2.77
2.04
1.44
Slope
1.13
1.12
1.24
1.22
Intercept
-5.11
-5.81
-14.93
-14.71
Y
1.13 * X + -5.11
1.12 * X + -5.81
1.24 * X + -14.93
1.22 * X + -14.71
Average Error
3.55
2.51
1.49
0.5
Slope 95% CI
1.0746, 1.1804
1.0715, 1.1737
1.1888, 1.2946
1.1718, 1.2762
Intercept 95% CI
-8.7031, -1.5151
-9.2851, -2.3377
-18.5219, -11.3310
-18.2559, -11.1592
Avg Err 95% CI
3.3557, 3.7418
2.3274, 2.7002
1.2626, 1.7090
0.2883, 0.7197
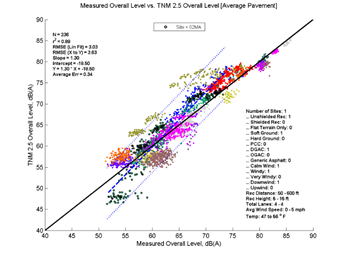
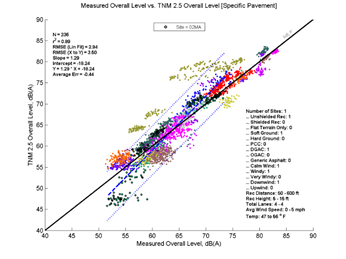
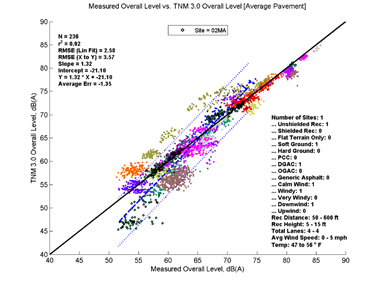
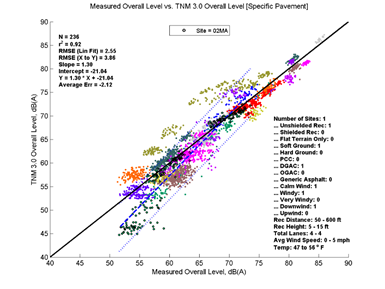
Figure H - 10: TNM 2.5 and 3.0 Predictions vs. Measured Results using Average and Specific Pavements – 02MA
Table H - 10: Summary Statistics for TNM 2.5 and 3.0 Predictions vs. Measured Results using Average and Specific Pavements – 02MA
Average Measured vs. TNM 2.5
Specific Measured vs. TNM 2.5
Average Measured vs. TNM 3.0
Specific Measured vs. TNM 3.0
N
236
236
236
236
r2
0.89
0.89
0.92
0.92
RMSE (Lin Fit)
3.03
2.94
2.58
2.55
RMSE (X to Y)
3.63
3.5
3.57
3.86
Slope
1.3
1.29
1.32
1.3
Intercept
-18.5
-18.24
-21.1
-21.04
Y
1.30 * X + -18.50
1.29 * X + -18.24
1.32 * X + -21.10
1.30 * X + -21.04
Average Error
0.34
-0.44
-1.35
-2.12
Slope 95% CI
1.2447, 1.3628
1.2297, 1.3439
1.2682, 1.3686
1.2553, 1.3544
Intercept 95% CI
-22.1854, -14.8208
-21.8021, -14.6719
-24.2340, -17.9695
-24.1305, -17.9444
Avg Err 95% CI
-0.1174, 0.8073
-0.8849, 0.0037
-1.7690, -0.9229
-2.5334, -1.7079
Figure H - 11: TNM 2.5 and 3.0 Predictions vs. Measured Results using Average and Specific Pavements – 03MA
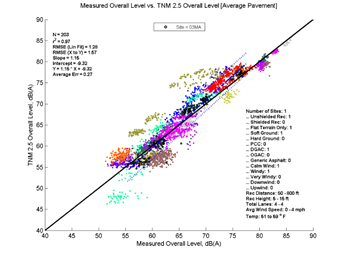
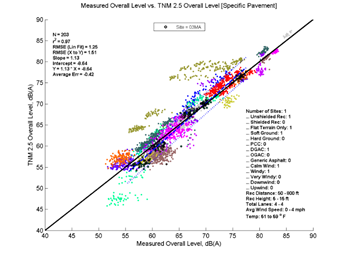
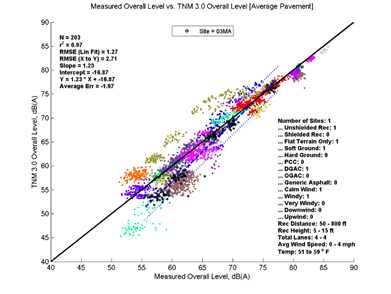
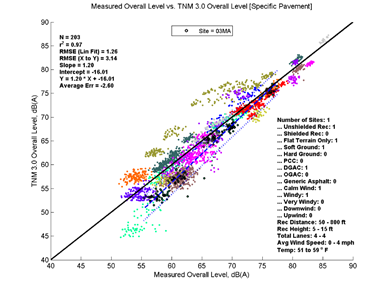
Table H - 11: Summary Statistics for TNM 2.5 and 3.0 Predictions vs. Measured Results using Average and Specific Pavements – 03MA
Average Measured vs. TNM 2.5
Specific Measured vs. TNM 2.5
Average Measured vs. TNM 3.0
Specific Measured vs. TNM 3.0
N
203
203
203
203
r2
0.97
0.97
0.97
0.97
RMSE (Lin Fit)
1.28
1.25
1.27
1.26
RMSE (X to Y)
1.57
1.51
2.71
3.14
Slope
1.15
1.13
1.23
1.2
Intercept
-9.32
-8.64
-16.87
-16.01
Y
1.15 * X + -9.32
1.13 * X + -8.64
1.23 * X + -16.87
1.20 * X + -16.01
Average Error
0.27
-0.42
-1.97
-2.6
Slope 95% CI
1.1174, 1.1753
1.0972, 1.1538
1.1987, 1.2561
1.1761, 1.2331
Intercept 95% CI
-11.2213, -7.4106
-10.4994, -6.7808
-18.7554, -14.9785
-17.8828, -14.1300
Avg Err 95% CI
0.0590, 0.4866
-0.6203, -0.2190
-2.2260, -1.7108
-2.8463, -2.3601
Figure H - 12: TNM 2.5 and 3.0 Predictions vs. Measured Results using Average and Specific Pavements – 05CA
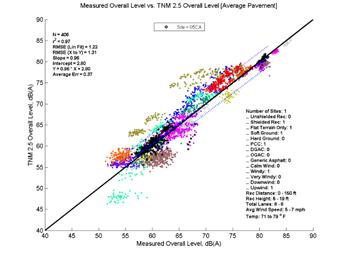
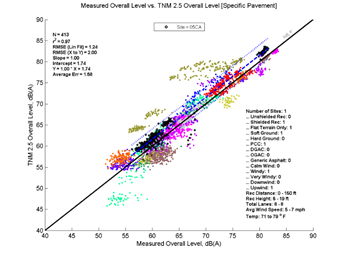
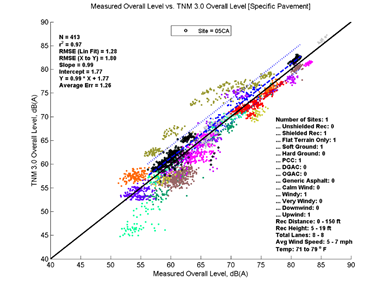
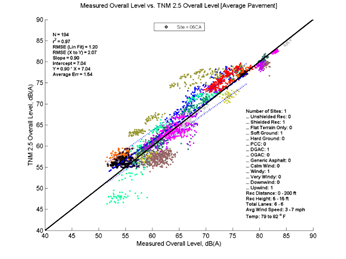
Table H - 12: Summary Statistics for TNM 2.5 and 3.0 Predictions vs. Measured Results using Average and Specific Pavements – 05CA
Average Measured vs. TNM 2.5
Specific Measured vs. TNM 2.5
Average Measured vs. TNM 3.0
Specific Measured vs. TNM 3.0
N
406
413
413
413
r2
0.97
0.97
0.97
0.97
RMSE (Lin Fit)
1.22
1.24
1.31
1.28
RMSE (X to Y)
1.31
2
1.33
1.8
Slope
0.96
1
0.97
0.99
Intercept
2.8
1.74
1.83
1.77
Y
0.96 * X + 2.80
1.00 * X + 1.74
0.97 * X + 1.83
0.99 * X + 1.77
Average Error
0.37
1.58
-0.12
1.26
Slope 95% CI
0.9453, 0.9777
0.9811, 1.0136
0.9520, 0.9864
0.9751, 1.0088
Intercept 95% CI
1.7666, 3.8303
0.7092, 2.7798
0.7314, 2.9189
0.7016, 2.8452
Avg Err 95% CI
0.2435, 0.4877
1.4567, 1.6953
-0.2494, 0.0064
1.1387, 1.3859
Figure H - 13: TNM 2.5 and 3.0 Predictions vs. Measured Results using Average and Specific Pavements – 06CA
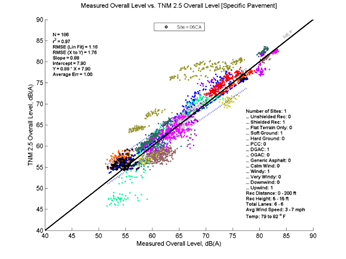
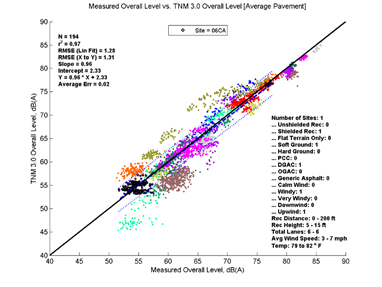
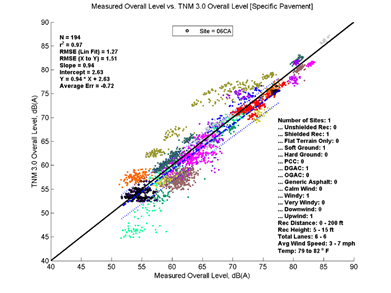
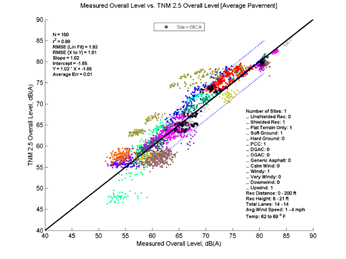
Table H - 13: Summary Statistics for TNM 2.5 and 3.0 Predictions vs. Measured Results using Average and Specific Pavements – 06CA
Average Measured vs. TNM 2.5
Specific Measured vs. TNM 2.5
Average Measured vs. TNM 3.0
Specific Measured vs. TNM 3.0
N
194
186
194
194
r2
0.97
0.97
0.97
0.97
RMSE (Lin Fit)
1.2
1.16
1.28
1.27
RMSE (X to Y)
2.07
1.76
1.31
1.51
Slope
0.9
0.88
0.96
0.94
Intercept
7.04
7.9
2.33
2.63
Y
0.90 * X + 7.04
0.88 * X + 7.90
0.96 * X + 2.33
0.94 * X + 2.63
Average Error
1.54
1
0.02
-0.72
Slope 95% CI
0.8803, 0.9272
0.8566, 0.9020
0.9347, 0.9847
0.9165, 0.9662
Intercept 95% CI
5.6897, 8.3907
6.5922, 9.2092
0.8867, 3.7635
1.2042, 4.0619
Avg Err 95% CI
1.3494, 1.7393
0.7868, 1.2046
-0.1610, 0.2075
-0.9033, -0.5270
Figure H - 14: TNM 2.5 and 3.0 Predictions vs. Measured Results using Average and Specific Pavements – 08CA
Table H - 14: Summary Statistics for TNM 2.5 and 3.0 Predictions vs. Measured Results using Average and Specific Pavements – 08CA
Average Measured vs. TNM 2.5
Specific Measured vs. TNM 2.5
Average Measured vs. TNM 3.0
Specific Measured vs. TNM 3.0
N
150
85
150
150
r2
0.88
0.84
0.87
0.88
RMSE (Lin Fit)
1.92
2.16
2.06
2.11
RMSE (X to Y)
1.91
2.53
2.14
2.43
Slope
1.02
1.12
1.08
1.11
Intercept
-1.65
-7.25
-6.07
-6.8
Y
1.02 * X + -1.65
1.12 * X + -7.25
1.08 * X + -6.07
1.11 * X + -6.80
Average Error
0.01
1.25
-0.47
1.08
Slope 95% CI
0.9629, 1.0846
1.0188, 1.2252
1.0148, 1.1459
1.0459, 1.1802
Intercept 95% CI
-5.9033, 2.6095
-14.4485, -0.0502
-10.6519, -1.4851
-11.4949, -2.1102
Avg Err 95% CI
-0.2972, 0.3156
0.7742, 1.7183
-0.8026, -0.1314
0.7316, 1.4301
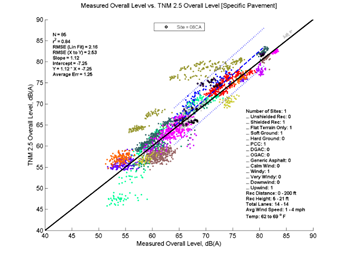
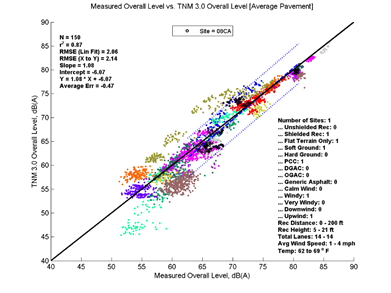
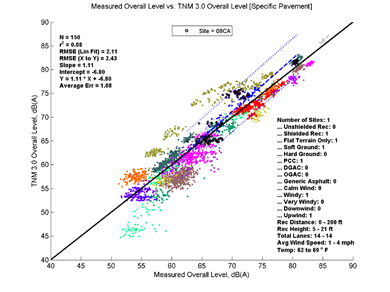
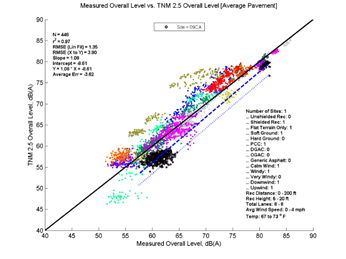
Figure H - 15: TNM 2.5 and 3.0 Predictions vs. Measured Results using Average and Specific Pavements – 09CA
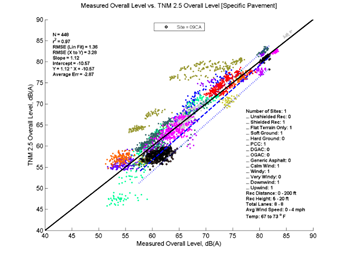
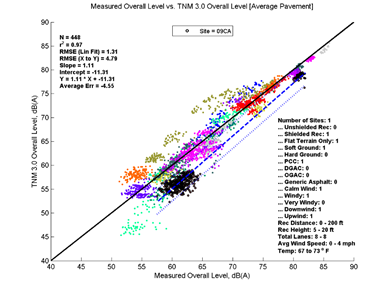
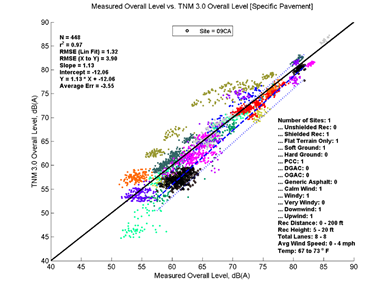
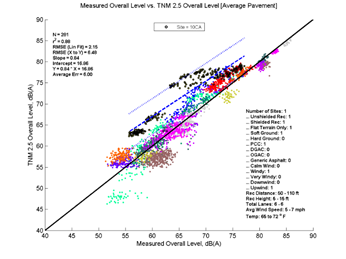
Table H - 15: Summary Statistics for TNM 2.5 and 3.0 Predictions vs. Measured Results using Average and Specific Pavements – 09CA
Average Measured vs. TNM 2.5
Specific Measured vs. TNM 2.5
Average Measured vs. TNM 3.0
Specific Measured vs. TNM 3.0
N
448
448
448
448
r2
0.97
0.97
0.97
0.97
RMSE (Lin Fit)
1.35
1.36
1.31
1.32
RMSE (X to Y)
3.9
3.28
4.79
3.9
Slope
1.08
1.12
1.11
1.13
Intercept
-8.61
-10.57
-11.31
-12.06
Y
1.08 * X + -8.61
1.12 * X + -10.57
1.11 * X + -11.31
1.13 * X + -12.06
Average Error
-3.62
-2.87
-4.55
-3.55
Slope 95% CI
1.0603, 1.0956
1.1025, 1.1381
1.0885, 1.1228
1.1157, 1.1502
Intercept 95% CI
-9.7478, -7.4730
-11.7135, -9.4224
-12.4111, -10.2023
-13.1732, -10.9484
Avg Err 95% CI
-3.7560, -3.4865
-3.0160, -2.7195
-4.6875, -4.4086
-3.7021, -3.4025
Figure H - 16: TNM 2.5 and 3.0 Predictions vs. Measured Results using Average and Specific Pavements – 10CA
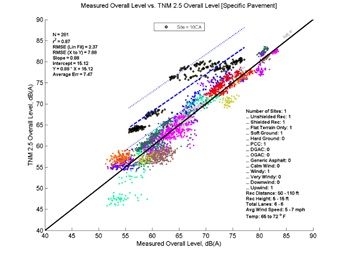
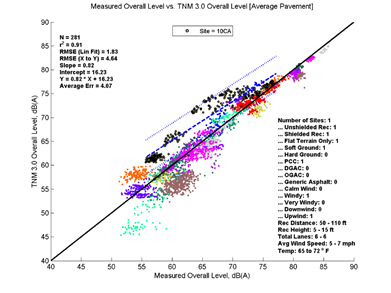
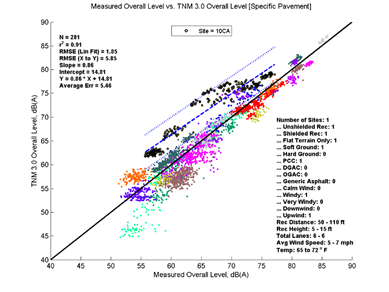
Table H - 16: Summary Statistics for TNM 2.5 and 3.0 Predictions vs. Measured Results using Average and Specific Pavements – 10CA
Average Measured vs. TNM 2.5
Specific Measured vs. TNM 2.5
Average Measured vs. TNM 3.0
Specific Measured vs. TNM 3.0
N
281
281
281
281
r2
0.88
0.87
0.91
0.91
RMSE (Lin Fit)
2.15
2.37
1.83
1.85
RMSE (X to Y)
6.48
7.88
4.64
5.85
Slope
0.84
0.88
0.82
0.86
Intercept
16.86
15.12
16.23
14.81
Y
0.84 * X + 16.86
0.88 * X + 15.12
0.82 * X + 16.23
0.86 * X + 14.81
Average Error
6
7.47
4.07
5.46
Slope 95% CI
0.7996, 0.8722
0.8444, 0.9244
0.7853, 0.8469
0.8275, 0.8898
Intercept 95% CI
14.4432, 19.2698
12.4567, 17.7775
14.1810, 18.2777
12.7435, 16.8817
Avg Err 95% CI
5.7187, 6.2880
7.1772, 7.7626
3.8091, 4.3302
5.2206, 5.7091
Figure H - 17: TNM 2.5 and 3.0 Predictions vs. Measured Results using Average and Specific Pavements – 11CA
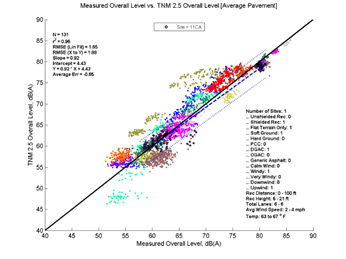
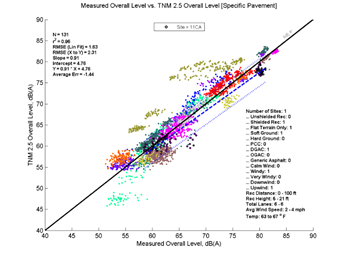
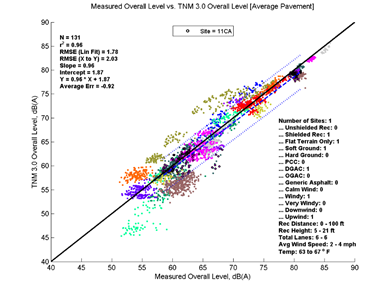
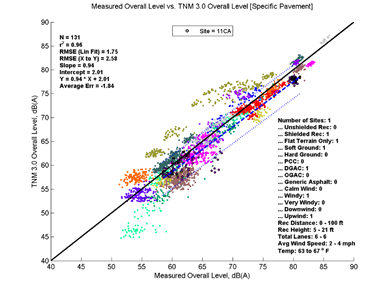
Table H - 17: Summary Statistics for TNM 2.5 and 3.0 Predictions vs. Measured Results using Average and Specific Pavements – 11CA
Average Measured vs. TNM 2.5
Specific Measured vs. TNM 2.5
Average Measured vs. TNM 3.0
Specific Measured vs. TNM 3.0
N
131
131
131
131
r2
0.96
0.96
0.96
0.96
RMSE (Lin Fit)
1.65
1.63
1.78
1.75
RMSE (X to Y)
1.88
2.31
2.03
2.58
Slope
0.92
0.91
0.96
0.94
Intercept
4.43
4.76
1.87
2.01
Y
0.92 * X + 4.43
0.91 * X + 4.76
0.96 * X + 1.87
0.94 * X + 2.01
Average Error
-0.65
-1.44
-0.92
-1.84
Slope 95% CI
0.8932, 0.9565
0.8771, 0.9396
0.9245, 0.9929
0.9095, 0.9768
Intercept 95% CI
2.2733, 6.5939
2.6322, 6.8975
-0.4646, 4.2085
-0.2887, 4.3027
Avg Err 95% CI
-0.9560, -0.3490
-1.7507, -1.1292
-1.2346, -0.6141
-2.1533, -1.5316
Figure H - 18: TNM 2.5 and 3.0 Predictions vs. Measured Results using Average and Specific Pavements – 12CA
Table H - 18: Summary Statistics for TNM 2.5 and 3.0 Predictions vs. Measured Results using Average and Specific Pavements – 12CA
Average Measured vs. TNM 2.5
Specific Measured vs. TNM 2.5
Average Measured vs. TNM 3.0
Specific Measured vs. TNM 3.0
N
290
290
287
283
r2
0.96
0.96
0.96
0.96
RMSE (Lin Fit)
1.09
1.04
1.14
1.06
RMSE (X to Y)
1.32
1.16
1.67
1.1
Slope
1
1.04
1.02
1.04
Intercept
-0.82
-2
-2.4
-2.51
Y
1.00 * X + -0.82
1.04 * X + -2.00
1.02 * X + -2.40
1.04 * X + -2.51
Average Error
-0.76
0.48
-1.21
0.22
Slope 95% CI
0.9769, 1.0249
1.0139, 1.0596
0.9925, 1.0427
1.0170, 1.0638
Intercept 95% CI
-2.4425, 0.8057
-3.5519, -0.4536
-4.1047, -0.7004
-4.0973, -0.9223
Avg Err 95% CI
-0.8825, -0.6319
0.3615, 0.6046
-1.3468, -1.0821
0.0939, 0.3464
Figure H - 19: TNM 2.5 and 3.0 Predictions vs. Measured Results using Average and Specific Pavements – 13CA
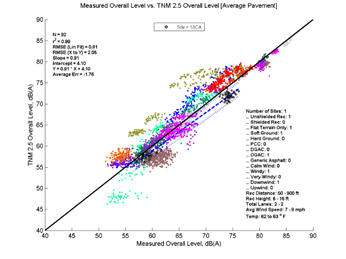
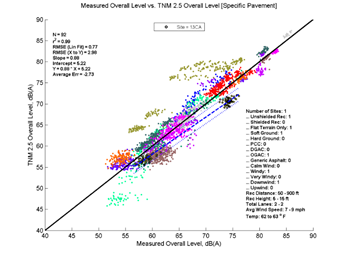
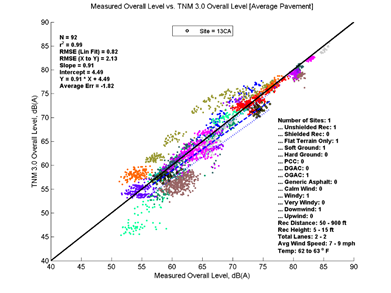
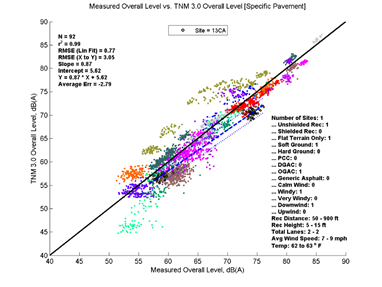
Table H - 19: Summary Statistics for TNM 2.5 and 3.0 Predictions vs. Measured Results using Average and Specific Pavements – 13CA
Average Measured vs. TNM 2.5
Specific Measured vs. TNM 2.5
Average Measured vs. TNM 3.0
Specific Measured vs. TNM 3.0
N
92
92
92
92
r2
0.99
0.99
0.99
0.99
RMSE (Lin Fit)
0.81
0.77
0.82
0.77
RMSE (X to Y)
2.05
2.98
2.13
3.05
Slope
0.91
0.88
0.91
0.87
Intercept
4.1
5.22
4.49
5.62
Y
0.91 * X + 4.10
0.88 * X + 5.22
0.91 * X + 4.49
0.87 * X + 5.62
Average Error
-1.76
-2.73
-1.82
-2.79
Slope 95% CI
0.8906, 0.9331
0.8603, 0.9005
0.8836, 0.9265
0.8533, 0.8937
Intercept 95% CI
2.6778, 5.5230
3.8797, 6.5646
3.0542, 5.9245
4.2707, 6.9753
Avg Err 95% CI
-1.9779, -1.5425
-2.9732, -2.4783
-2.0452, -1.5932
-3.0429, -2.5291
Figure H - 20: TNM 2.5 and 3.0 Predictions vs. Measured Results using Average and Specific Pavements – 14CA
Table H - 20: Summary Statistics for TNM 2.5 and 3.0 Predictions vs. Measured Results using Average and Specific Pavements – 14CA
Average Measured vs. TNM 2.5
Specific Measured vs. TNM 2.5
Average Measured vs. TNM 3.0
Specific Measured vs. TNM 3.0
N
294
294
294
294
r2
0.96
0.96
0.95
0.95
RMSE (Lin Fit)
1.36
1.36
1.49
1.51
RMSE (X to Y)
1.4
1.4
1.65
2.14
Slope
0.96
0.96
0.99
0.98
Intercept
2.33
2.33
0.02
0.12
Y
0.96 * X + 2.33
0.96 * X + 2.33
0.99 * X + 0.02
0.98 * X + 0.12
Average Error
-0.22
-0.22
-0.7
-1.51
Slope 95% CI
0.9385, 0.9851
0.9385, 0.9851
0.9636, 1.0148
0.9498, 1.0016
Intercept 95% CI
0.7673, 3.9014
0.7673, 3.9014
-1.7019, 1.7432
-1.6238, 1.8622
Avg Err 95% CI
-0.3818, -0.0660
-0.3818, -0.0660
-0.8711, -0.5296
-1.6815, -1.3343
Figure H - 21: TNM 2.5 and 3.0 Predictions vs. Measured Results using Average and Specific Pavements – 16MA
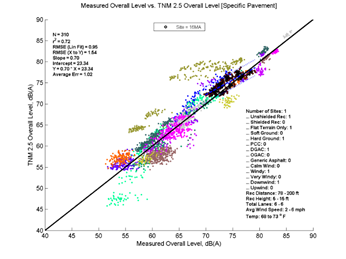
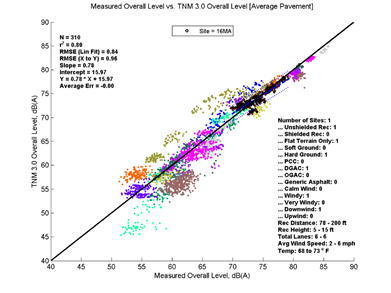
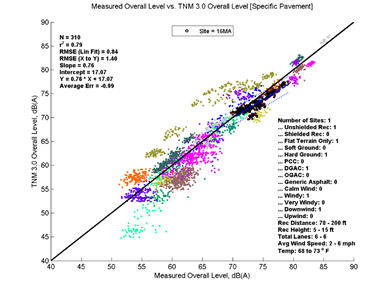
Table H - 21: Summary Statistics for TNM 2.5 and 3.0 Predictions vs. Measured Results using Average and Specific Pavements – 16MA
Average Measured vs. TNM 2.5
Specific Measured vs. TNM 2.5
Average Measured vs. TNM 3.0
Specific Measured vs. TNM 3.0
N
310
310
310
310
r2
0.7
0.72
0.8
0.79
RMSE (Lin Fit)
0.98
0.95
0.84
0.84
RMSE (X to Y)
2.39
1.54
0.96
1.4
Slope
0.7
0.7
0.78
0.76
Intercept
24.26
23.34
15.97
17.07
Y
0.70 * X + 24.26
0.70 * X + 23.34
0.78 * X + 15.97
0.76 * X + 17.07
Average Error
2.08
1.02
0
-0.99
Slope 95% CI
0.6493, 0.7503
0.6489, 0.7470
0.7403, 0.8273
0.7122, 0.7989
Intercept 95% CI
20.5246, 27.9884
19.7132, 26.9605
12.7571, 19.1842
13.8680, 20.2778
Avg Err 95% CI
1.9505, 2.2119
0.8944, 1.1510
-0.1106, 0.1040
-1.0956, -0.8746
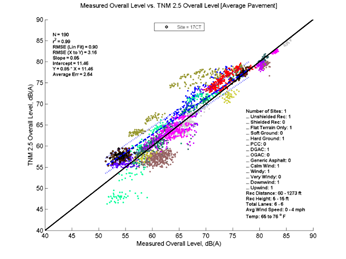
Figure H - 22: TNM 2.5 and 3.0 Predictions vs. Measured Results using Average and Specific Pavements – 17CT
Table H - 22: Summary Statistics for TNM 2.5 and 3.0 Predictions vs. Measured Results using Average and Specific Pavements – 17CT