

Composite Bridge Decking: Phase I Design Report
APPENDIX E: TUBE TESTING REPORT
Description of Tested Specimens
For this study, 10 empty (i.e., no grout) and 16 grouted FRP pultruded tubes were evaluate. The shape of the cross section is shown in figure 15. Overall dimensions and thicknesses were measured in nine specimens; see table 21. It appears that variability of the dimensions is in the order of 0.01 to 0.06 inches.
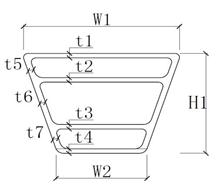
Figure 15. Diagram. FRP tube cross section.
| Tube ID No. | Weight (lb) |
Length (inches) |
t1 (inch) |
t2 (inch) |
t3 (inch) |
t4 (inch) |
t5 (inch) |
t6 (inch) |
t7 (inch) |
W1 (inch) |
W2 (inch) |
H1 (inch) |
|---|---|---|---|---|---|---|---|---|---|---|---|---|
| #30 | 57.86 | 131.94 | 0.200 | 0.190 | 0.222 | 0.206 | 0.253 | 0.260 | 0.241 | 6.516 | 3.608 | 4.477 |
| #31 | 57.86 | 131.91 | 0.200 | 0.195 | 0.230 | 0.208 | 0.251 | 0.252 | 0.248 | 6.519 | 3.620 | 4.478 |
| #32 | 57.86 | 131.88 | 0.201 | 0.196 | 0.223 | 0.210 | 0.246 | 0.254 | 0.248 | 6.518 | 3.607 | 4.478 |
| #33 | 58.08 | 132.09 | 0.201 | 0.201 | 0.224 | 0.207 | 0.252 | 0.253 | 0.241 | 6.521 | 3.594 | 4.482 |
| #34 | 58.08 | 132.06 | 0.200 | 0.196 | 0.227 | 0.208 | 0.252 | 0.256 | 0.244 | 6.521 | 3.597 | 4.483 |
| #35 | 57.75 | 131.84 | 0.200 | 0.196 | 0.231 | 0.210 | 0.245 | 0.256 | 0.245 | 6.515 | 3.599 | 4.477 |
| #36 | 57.75 | 131.91 | 0.204 | 0.198 | 0.226 | 0.208 | 0.248 | 0.255 | 0.248 | 6.516 | 3.600 | 4.480 |
| #37 | 57.86 | 131.91 | 0.203 | 0.195 | 0.223 | 0.207 | 0.248 | 0.254 | 0.250 | 6.518 | 3.604 | 4.482 |
| #38 | 57.75 | 131.88 | 0.200 | 0.193 | 0.224 | 0.211 | 0.245 | 0.256 | 0.247 | 6.518 | 3.612 | 4.479 |
| #00 (unlabeled) |
56.87 | 131.41 | 0.203 | 0.197 | 0.230 | 0.196 | 0.242 | 0.255 | 0.239 | 6.519 | 3.566 | 4.474 |
| Average | 57.77 | 131.88 | 0.201 | 0.196 | 0.226 | 0.207 | 0.248 | 0.255 | 0.245 | 6.518 | 3.601 | 4.479 |
| Max | 58.08 | 132.09 | 0.204 | 0.201 | 0.231 | 0.211 | 0.253 | 0.260 | 0.250 | 6.521 | 3.620 | 4.483 |
| Min | 56.87 | 131.41 | 0.200 | 0.190 | 0.222 | 0.196 | 0.242 | 0.252 | 0.239 | 6.515 | 3.566 | 4.474 |
| Range | 1.210 | 0.68 | 0.004 | 0.012 | 0.009 | 0.016 | 0.012 | 0.008 | 0.012 | 0.006 | 0.054 | 0.008 |
Of the 16 grouted tubes, half were filled with a cementitious grout and the other half filled with an epoxy grout. Two different grouting configurations were explored: “wide” or “narrow” cells filled. Two different cross section positions were also evaluated: wide side up and wide side down. Figure 16 shows all four possible combinations. The specimens were also checked for dimensional stability, weight, and any visible defects. One specimen, #69, had a lower weight than similar specimens; the manufacturer indicated that it was partially filled with epoxy grout. Specimens were received on February 2, 2012.
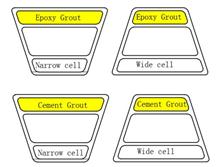
Figure 16. Diagram. Grout configurations.
| Tube ID No. | Grout type | Cell filled | Weight(lbs) | Length(in) | Date filled | cross-section check | |
|---|---|---|---|---|---|---|---|
| Height H1 | Width W1 | ||||||
| #68-EW | Epoxy 2.5 | Wide | 109.6 | 132.06 | 1/31/2012 | ||
| #69-EW | Epoxy 2.5 | Wide | *91.6 | 132.00 | Partially filled | 4.462 | 6.523 |
| #50-EW | Epoxy 2.5 | Wide | 111.4 | 132.25 | 1/31/2012 | 4.470 | 6.522 |
| #51-EW | Epoxy 2.5 | Wide | 111.0 | 132.13 | 1/31/2012 | ||
| #52-EN | Epoxy 2.5 | Narrow | 88.4 | 132.25 | 1/31/2012 | ||
| #53-EN | Epoxy 2.5 | Narrow | 88.0 | 132.13 | 1/31/2012 | ||
| #54-EN | Epoxy 2.5 | Narrow | 88.6 | 132.28 | 1/31/2012 | 4.478 | 6.513 |
| #55-EN | Epoxy 2.5 | Narrow | 89.2 | 132.13 | 1/31/2012 | 4.474 | 6.514 |
| #56-CW | cementitious | Wide | 104.2 | 132.19 | 1/20/2012 | ||
| #57-CW | cementitious | Wide | 104.0 | 132.00 | 1/21/2012 | ||
| #58-CW | cementitious | Wide | 103.8 | 132.00 | 1/22/2012 | 4.476 | 6.520 |
| #59-CW | cementitious | Wide | 104.2 | 132.06 | 1/23/2012 | 4.473 | 6.511 |
| #60–CN | cementitious | Narrow | 84.8 | 132.00 | 1/24/2012 | ||
| #61–CN | cementitious | Narrow | 84.8 | 132.25 | 1/25/2012 | ||
| #62–CN | cementitious | Narrow | 85.0 | 132.13 | 1/26/2012 | 4.476 | 6.522 |
| #63–CN | cementitious | Narrow | 85.0 | 132.19 | 1/27/2012 | 4.471 | 6.516 |
Description of Test Setup
The FRP tubes were tested under three–point loading (hydraulic actuator at midspan). Steel rollers were used for support between a 10–foot span length. Vertical deformation was measured using one linear variable differential transformer (LVDT) and/or string pot. In some specimens, strain measurements were obtained from uniaxial and rosette strain gage configurations. Two load cells were used to collect load data (22–kip or 110–kip capacity). The 22–kip load cell was used in nondestructive tests to better monitor the low–range of load, whereas the 110–kip load cell was used when the tubes were tested up to failure. A steel plate (12 inches by 4 inches by 0.5 inches) was used under the hydraulic actuator to create a 4–inch–wide distributed load over the FRP specimen.
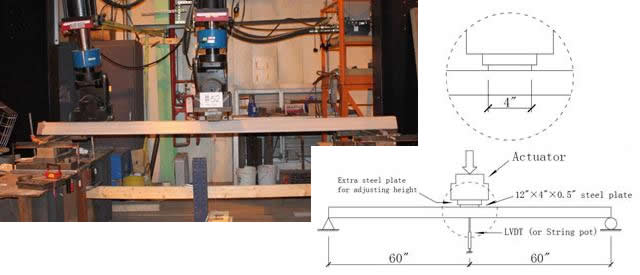
Figure 17. Photo and diagram. Testing setup.
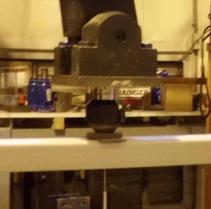
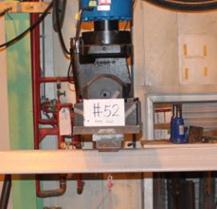
Figure 18. Photos. Load cells used for FRP testing.
Test Program
FRP Tubes with No Grout
All 10 FRP tubes with no grout were tested using the test setup described above. Two of them were tested up to failure, and the remaining eight were loaded and unloaded in the elastic range with two different cross section positions (wide side up, WSU, and wide side down, WSD), to check for any changes in their elastic stiffness response. The FRP tube #38 was initially loaded elastically up to 2.5 kips, and then was loaded up to failure (WSU). Specimen #30 was instrumented with strain gages in three locations: top (SG1) and bottom (SG2) "flange" under point load, and shear span (SG 3–5) at 25.4 inches from point load. This specimen was tested to failure (WSU). Figure 19 shows the strain gages locations. Table 23 provides additional details on this test program.
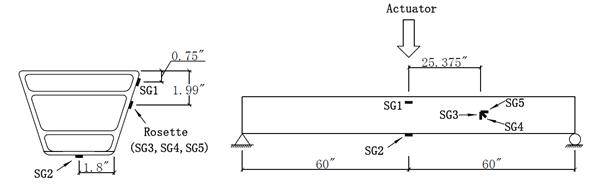
Figure 19. Diagram. Strain gage locations for the FRP tube specimen #30.
| Tube ID No. | Instrumentation used in test | Cross–section position | Max or Failure Load (kips) | Displacement at max or failure load (inch) | Flexural stiffness k (lbs/inch) | Tested date |
|---|---|---|---|---|---|---|
| #00 (unlabeled) | LVDT & 22 kips load cell | WSU | 2 | 1.36 | 1419 | 11/22/2011 |
| WSD | 1.38 | 1418 | 11/22/2011 | |||
| #30 | LVDT & 22 kips load cell & strain_pot & 2 strain gages & 1 strain rosette |
WSU | 5(fail) crushing at top |
3.72 | 1520 | 12/19/2011 |
| #31 | LVDT & 22 kips load cell | WSU | 2.5 | 1.64 | 1527 | 01/04/2012 |
| WSD | 1.65 | 1546 | 02/02/2012 | |||
| #32 | LVDT & 22 kips load cell | WSU | 2.5 | 1.67 | 1525 | 01/04/2012 |
| WSD | 1.67 | 1542 | 02/03/2012 | |||
| #33 | LVDT & 22 kips load cell | WSU | 2.5 | 1.65 | 1541 | 01/05/2012 |
| WSD | 1.66 | 1547 | 02/03/2012 | |||
| #34 | LVDT & 22 kips load cell | WSU | 2.5 | 1.67 | 1528 | 02/03/2012 |
| WSD | 1.64 | 1551 | 01/05/2012 | |||
| #35 | LVDT & 22 kips load cell | WSU | 2.5 | 1.68 | 1518 | 02/03/2012 |
| WSD | 1.65 | 1534 | 01/05/2012 | |||
| #36 | LVDT & 22 kips load cell | WSU | 2.5 | 1.68 | 1522 | 02/03/2012 |
| WSD | 1.64 | 1543 | 01/05/2012 | |||
| #37 | LVDT & 22 kips load cell | WSU | 2.5 | 1.67 | 1519 | 01/06/2012 |
| WSD | 1.65 | 1539 | 01/06/2012 | |||
| #38 | LVDT & 22 kips load cell | WSU | 2.5 | 1.66 | 1529 | 02/03/2012 |
| WSD | 1.66 | 1533 | 02/03/2012 | |||
| LVDT & 110 kips load cell | WSU | 4.5(fail) crushing at top |
3.49 | 1468 | 02/14/2012 |
The load–deflection behavior of FRP empty tubes is shown in figure 20. Results indicate that the flexural stiffness (k; calculated as the slope between 300 and 2,000 lb) of the FRP tubes #31–#38 is very similar: k =1533 lb/inch (on average) with a 1.2 percent variation. The flexural stiffness of the FRP tube #00 empty tube is 7 percent smaller: k=1419 lb/inch, possibly related to the smaller tube thickness (table 21 shows that the thickness of the walls, e.g. t4, t5, t7, of this tube is smaller than the other specimens). Flexural thickness values are tabulated in table 23.
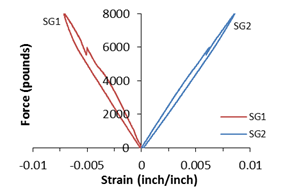
Strain data from the test to failure of FRP tube #30 shows that the strain gage on the bottom “flange” (SG2) ha as a quite linear response up to failure load . By contrast SG1, near the top flange exhibited a nonlinear response beyond 4,000 lb of applied load. The strain gage rossette (SG3–5) displayed a very small magnitude of strain values, as expected.
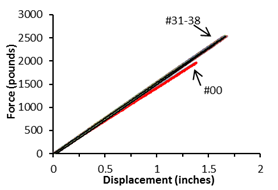
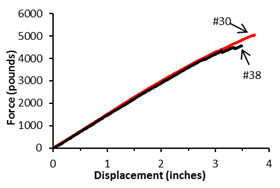
Figure 20. Graphs. Load–deflection elastic response of FRP tubes with no grout (left); Load–deflection response up to failure (tubes #30 and #38) (right).
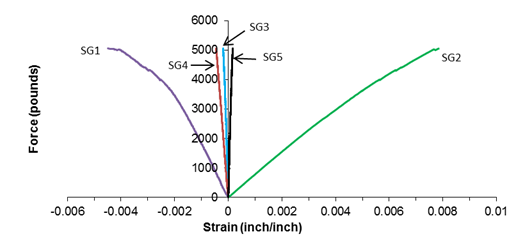
Figure 21. Graph. Load–strain response of FRP tube #30 (no grout, WSU).
The FRP tubes with no grout (#30 and #38, both WSU) failed by crushing of the top flange under the point load. Figure 22 shows photographs of these specimens after failure.
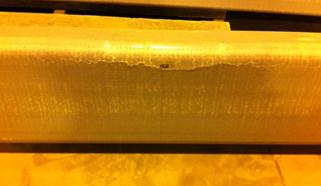 Specimen #30 |
 Specimen #38 |
Figure 22. Photos. Failure modes of FRP tubes with no grout.
Grouted Tubes
Fifteen grouted tubes were tested using the same test setup described above; the FRP tube partially filled with grout (#69) was not tested. The tested specimens had two different grouts and two different grouting configurations. Table 24 shows the details of this test program, including position of the cross section, instrumentation used, failure loads, displacements and modes. Flexural stiffness was calculated between two load levels in the elastic range (prior to first crack). Because each specimen’s load range is different, this information has been included in table 24.
Only four specimens were tested to failure (FRP tubes #50, 52, 57, and 60). The remaining specimens were loaded and unloaded in the elastic range. Figure 23 shows the load-deflection curves of all FRP tubes (with and without grout) tested to failure. It should be noted that the grouted tubes had a higher flexural stiffness than the empty tubes. Epoxy grouted specimens had a higher flexural stiffness than cementitious grouted specimens.
Table 24 shows that the elastic flexural stiffness of epoxy grouted tubes is 34 percent larger, on average, than that of the non–grouted tubes, while the flexural stiffness of cement-based grouted tubes is only 18 percent larger than that of the non–grouted tubes. When the cementitious grout is in compression, the flexural stiffness of the grouted tube is 17 percent larger than that of the grouted tube where the cementitious-based grout is in tension, which in turn has a very small increment of stiffness over the empty tube condition. However, for epoxy grouted tubes, the elastic flexural stiffness has little variation (only 4 percent) whether the grout is subjected to compression or tension. Comparing the effect of grouting either the wide or narrow cell, the epoxy grouted tubes have a 9 percent larger elastic flexural stiffness when the narrow cell is filled (as opposed to the wide cell); the cement-based grouted tubes show little difference.
Specimen #56 had the lowest flexural stiffness (1,600 lb/in.). Analysis of the load-deflection curve indicates that the composite action in this tube vanishes at a very small load, and the specimen behaves as an empty tube. Figure 24 shows a comparison of the load-deflection behavior (in the elastic range) for specimen #56, #57 (similar configuration), and #31 (empty tube).
| Tube ID No. | Instrumentation used | Cross–section position |
Max or failure Load(kips) | Deflection at max or failure load (inches) | Elastic stiffness (lbs/inch) [load range, lbs] | Load and deflection at first crack (kips/inches) | Tested date |
|---|---|---|---|---|---|---|---|
| #68–EW | String pot & 22 kips load cell |
WSD | 3.5 | 2.05 | 1926 [300–2550] |
2.55/1.319 | 03/02/2012 |
| #50–EW | String pot & 110 kips load cell |
WSU | 9(fail) Failure at bottom |
4.92 | 1920 [300–4500] |
No crack sound heard | 02/24/2012 |
| #51–EW | LVDT & 22 kips load cell & 2 strain gages & 1 strain rosette |
WSU | 7.3 | 3.89 | 1993 [300–3500] |
No crack sound heard | 03/03/2012 |
| #52–EN | String pot & 110 kips load cell |
WSD | 9.6(fail) Failure at bottom |
4.77 | 2234 [300–4800] |
No crack sound heard | 02/24/2012 |
| #53–EN | LVDT & 22 kips load cell & 2 strain gages |
WSD | 7.8 | 3.84 | 2182 [300–3900] |
No crack sound heard | 03/03/2012 |
| #54–EN | String pot & 22 kips load cell |
WSU | 3.8 | 2.41 | 2048 [300–1590] |
1.59/0.756 | 03/02/2012 |
| #55–EN | String pot & 22 kips load cell |
WSU | 1.8 | 0.92 | 2045 [300–1750] |
1.75/0.838 | 03/02/2012 |
| #56–CW | LVDT & 22 kips load cell & 2 strain gages & 1 strain rosette |
WSU | 5.9 | 3.89 | 1600 [300–3000] |
No crack sound heard | 03/03/2012 |
| #57–CW | LVDT & 22 kips load cell |
WSU | 2.5 | 1.42 | 1970 [300–2000] |
2/1.015 | 02/03/2012 |
| WSU | 1.68 | 0.4/0.242 | |||||
| LVDT & 110 kips load cell |
WSU | 6.44(fail) Failure at bottom |
4.39 | 02/14/2012 | |||
| #58–CW | String pot & 22 kips load cell |
WSD | 3.8 | 2.58 | 1728 [30–400] |
0.4/0.221 | 03/02/2012 |
| #59–CW | LVDT & 22 kips load cell |
WSD | 1.0 | 0.68 | 1687 [30–420] |
0.42/0.244 | 03/02/2012 |
| #60–CN | String pot & 110 kips load cell |
WSD | 7.5(fail) Failure at bottom |
4.60 | 2103 [300–3000] |
3/1.431 | 02/24/2012 |
| #61–CN | LVDT & 22 kips load cell & 2 strain gages |
WSD | 8.0 | 5.39 | 1850 [300–3000] |
5.98/3.654 | 03/03/2012 |
| #62–CN | String pot & 22 kips load cell |
WSU | 3.8 | 2.63 | 1646 [30–300] |
0.3/0.174 | 03/02/2012 |
| #63–CN | LVDT & 22 kips load cell |
WSU | 1.0 | 0.66 | 1714 [30–360] |
0.36/0.205 | 03/02/2012 |
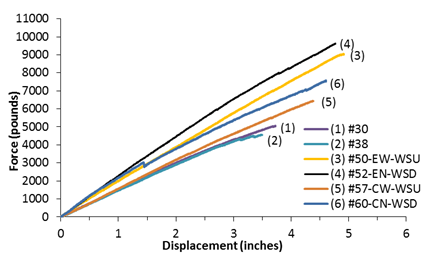
Figure 23. Graph. Load-deflection behavior up to failure for grouted FRP tubes.
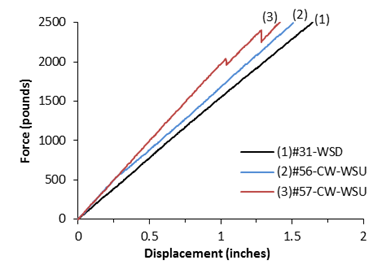
Figure 24. Graph. Load-deflection curve (up to 2,500 lb) of specimens #56, 57, and #31.
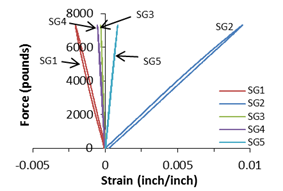
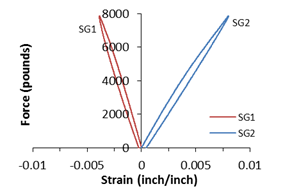
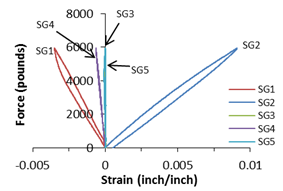
Four specimens were instrumented with strain gages. FRP tubes #53 and #61 had one strain gage at the top (SG1) and one at the bottom (SG2). FRP tubes #51 and #56 had, in addition to SG1 and SG2, a strain gage rosette (SG3-5) at 25.4 inches from the point load. Figure 19 shows locations of all the strain gages. Load-strain plots are show in figure 25. The two strain gage rosettes (FRP tubes #51 and #56) failed during testing, perhaps due to insufficient curing time of the adhesive used prior to test. Strain responses of these specimens confirm the load-deflection behavior, analyzed previously, showing that grouted tubes have a larger section modulus when the narrow cell is filled and subjected to compression. Epoxy grouted tubes have a larger section modulus than cement-based grouted tubes.
 Specimen #51-EW-WSU |
 Specimen #53-EN-WSD |
 Specimen #56-CW-WSU |
 Specimen #61-CN-WSD |
Figure 25. Graphs. Load-strain responses of grouted FRP tubes.
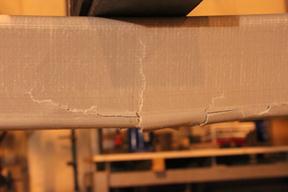
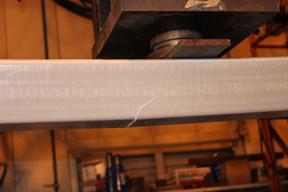
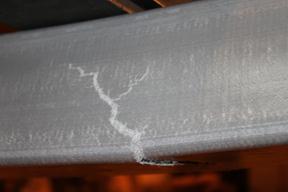
Failure mode for the grouted tubes originated with a tensile rupture of the bottom flange, regardless of the location of the grout (wide or narrow cell in compression). Cracks propagated vertically for all specimens, and also horizontally in specimen #50 (the location of this horizontal crack is 0.5 inches from the bottom, apparently at the splice between wall tube and the bottom horizontal section of the FRP tube). Figure 26 shows photographs of the damage regions for all four tested specimens.
 |
 |
| Specimen #50- EW-WSU | Specimen #52-EN-WSD |
 |
 |
| Specimen #57-CW-WSU | Specimen #60-CN-WSD |
Figure 26. Photos. Photographs of failure modes of grouted FRP tubes.
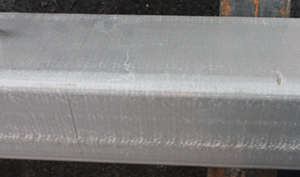
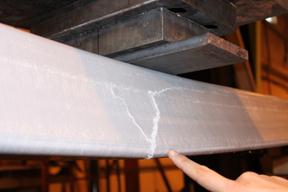
Specimen #60 also showed slip of the cementitious grout (top) during testing at one of the ends of the specimen (the other side was covered by the manufacturer with tape), indicating that the bond between the grout and the FRP tube had failed. The load-deflection curve has a significant load drop around 3,000 lb, probably related to the debonding initiation. Load-strain curves for a cementitious-grouted specimen also registered a significant load drop, in this case around 6,000 lb.
 |
 |
|---|
Figure 27. Photos. Cementitious grout slipping at the end of FRP tube #60.
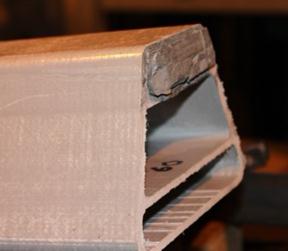
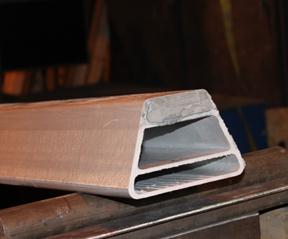
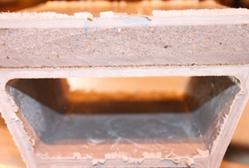
After testing to failure, specimens #50 and #57 were cut using a wet cutting block saw near the damaged region (around the center span) to look in detail at the debonded region. Inspection of the cut surfaces shows that debonding between the epoxy grout and the FRP tube (specimen #50) occurred along the lower interface, whereas cracks between the cementitious grout and the FRP tube (specimen #57) were present along the top interface, as shown in figure 28. Specimen #37 also had a vertical crack inside the cementitious grout, a possible indication of additional damage on this grouted region.
 |
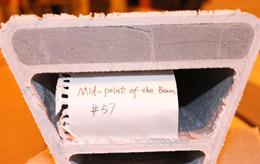 |
| Specimen #50- EW-WSU | Specimen #57-CW-WSU |
Figure 28. Photos. Cross sections of grouted tubes near midspan, after failure.
Conclusions
Based on the experimental program developed, the following conclusions can be drawn:
- Simple load-deflection tests of nine empty tubes show that the empty tubes have similar flexural stiffness (k=1533 lb/inch) with a 1.2 percent variation. Only one tube had a smaller stiffness, probably due to smaller FRP tube thicknesses.
- Test results show that grouted tubes have a larger elastic flexural stiffness than empty tubes. Epoxy grouted tubes have 34 percent greater stiffness, while cement-based grouted tubes have only 18 greater stiffness than empty tubes.
- For cement-based grouted tubes, the increase in the elastic flexural stiffness is only significant when the grout is in compression, whereas for the epoxy grouted tubes, the increase on flexural stiffness is present regardless of the grout being in compression or tension.
- Failure mode of the empty tubes is by FRP crushing at the top flange, while the grouted tubes (grout in compression) fail by tensile rupture of the bottom flange.
- Inspection of the damaged regions of the grouted specimens tested to failure shows that debonding occurred at the interface between the FRP and the grout. This occurred at load levels that ranged from 40 to 80 percent of the maximum load.
- The cementitious grout appears to have a lower tensile and bond strength, which could be easily cracked during field installation.