

Composite Bridge Decking: Phase I Design Report
APPENDIX G: PANEL SHEAR TEST
XC Associates fabricated small panels (42 inches long by 17 inches wide) by joining three FRP pultruded tubes and wrapping them with glass fiber wrap (three layers). These specimens were initially designed to evaluate the bond between two adjacent pultruded tubes; however, the wrap was too stiff to be deformed with the test setup available at Penn State to the load level needed to break the bond between the tubes.
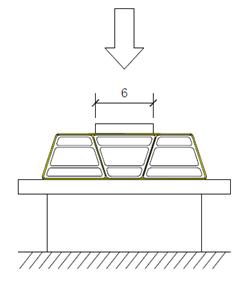
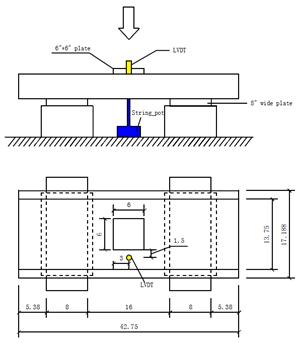
The researchers requested a different type of test to evaluate the deformation of one panel between two steel sections with the same top flange width (8 inches) and spacing (24 inches) as the steel girders in the demonstration bridge. The test setup will evaluate the effect of two different load footprints: 20 inches by 10 inches (AASHTO tire contact area) and 6 inches by 6 inches (simulating the effect of a smaller footprint due to debris on the road). In both tests, the panel was loaded up to 25 kips. Deformation was measured from the actuator, as well as a string pot (midspan under panel) and LVDT (top surface of the panel). The sketches in figure 44 and figure 45 show details of the test setup and transducer location for both tests.
 |
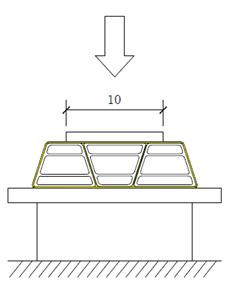 |
| 6-inch by 6-inch plate | 20-inch by 10-inch plate |
Figure 44. Diagrams. Tested load footprints.
 |
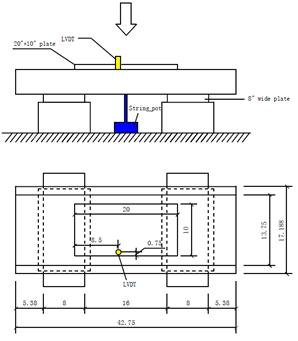 |
| 6-inch by 6-inch footprint test setup | 20-inch by 10-inch footprint test setup |
Figure 45. Diagrams. Test setup used to evaluate footprint effect.
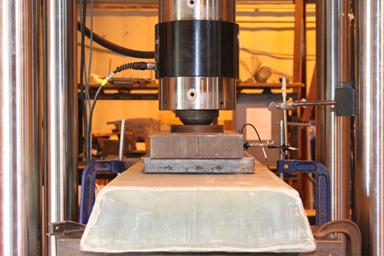
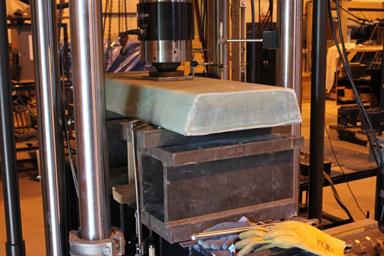
Steel plates were used to create the two different footprints. The photographs of different details of the test setup are shown in figure 46.
 |
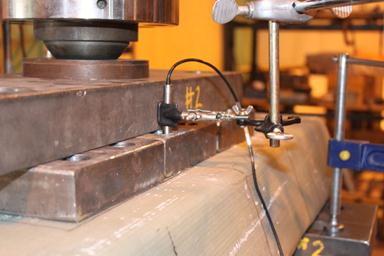 |
| 20-inch by 10-inch footprint- side view | 20-inch by 10-inch footprint – LVDT location |
 |
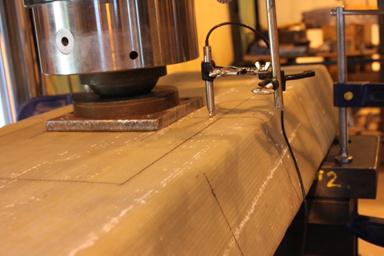 |
| 6-inch by 6-inch footprint-test set-up | 6-inch by 6-inch footprint-LVDT location |
Figure 46. Photos. Test setup details.
During both tests (the same panel was used, first loaded with larger footprint, unloaded, then smaller footprint and unloaded), cracking sounds were heard during the loading phase, but no visible damage or cracks were observed after unloading and removal of the steel plates. The plots in figure 47 show the load-deflection response as captured by the actuator, spring pot (bottom of the panel), and LVDT (top of panel). Results are summarized as follows:
- 6-inch by 6-inch footprint test: Max load is 25.1 kips. Max displacement: 0.146 inch registered by actuator; 0.080 inch by LVDT; 0.092 inch by the string pot.
- 20-inch by 10-inch footprint test: Max load is 25.12 kips. Max displacement: 0.109 inch registered by actuator; 0.074 inch by the LVDT; 0.068 inch by the string pot.
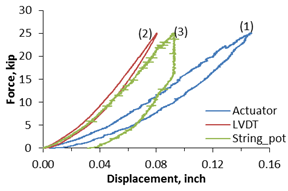 6-inch by 6-inch footprint test |
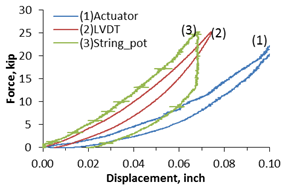 20-inch by 10-inch footprint test |
Figure 47. Graphs. Load-deflection responses of the two footprint tests.