

Composite Bridge Decking: Phase I Design Report
APPENDIX F: STRUCTURAL PANEL TEST REPORT
Description of Tested Specimens
Twelve panels, each composed of seven FRP tubes, were evaluated for this project. Eleven panels were delivered on May 16, 2012, and one additional panel was delivered 2 weeks later.
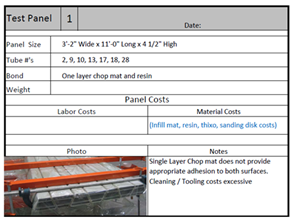
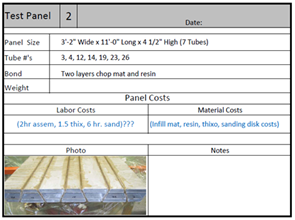
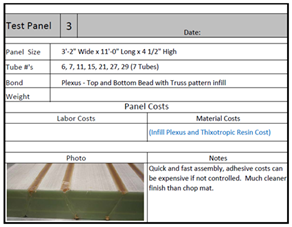
Panels #1 to #4 were empty (i.e., no grout); manufacturing details are listed in figure 29.
 |
 |
 |
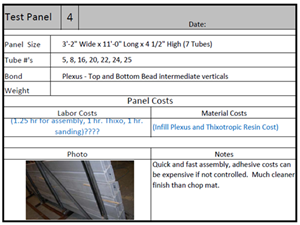 |
Figure 29. Specifications with photos. Manufacturing details of panels without grout.
Panels #5, #6, #9, and #10 were filled with epoxy grout; panels #7, #8, #11, and #12 were filled with cementitious grout. Two different grouting configurations were provided: “alternate” or “narrow side” cells filled. Two different cross section positions were tested: WSU and WSD. Figure 30 shows all four possible combinations. Specimen details are listed in table 25.
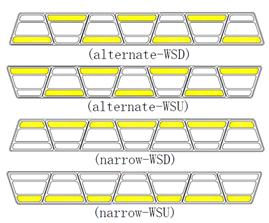
Figure 30. Diagram. Grout configurations.
| Panel ID No. | Grout type | Cell filled | Length (in.) | Width | Height(in.) | Date received | |
|---|---|---|---|---|---|---|---|
| Wide side(in.) | Narrow side(in.) | ||||||
| #1 | No | none | 132.50 | 38.50 | 35.50 | 4.81 | 05/16/2012 |
| #2 | No | none | 132.88 | 38.50 | 35.38 | 4.88 | 05/16/2012 |
| #3 | No | none | 132.13 | 38.31 | 35.25 | 4.75 | 05/16/2012 |
| #4 | No | none | 132.81 | 38.25 | 35.19 | 4.81 | 05/16/2012 |
| #5-EN | Epoxy | Narrow side | 132.81 | 38.00 | 35.13 | 4.88 | 05/24/2012 |
| #6-EA | Epoxy | Alternate | 132.50 | 38.25 | 35.13 | 4.94 | 05/16/2012 |
| #7-CA | Cementitious | Alternate | 132.75 | 38.19 | 35.13 | 4.81 | 05/16/2012 |
| #8-CN | Cementitious | Narrow side | 132.19 | 38.19 | 35.25 | 4.88 | 05/16/2012 |
| #9-EN | Epoxy | Narrow side | 132.69 | 38.13 | 35.19 | 5.00 | 05/16/2012 |
| #10-EA | Epoxy | Alternate | 132.56 | 38.13 | 35.13 | 4.81 | 05/16/2012 |
| #11-CA | Cementitious | Alternate | 132.81 | 38.13 | 35.13 | 4.88 | 05/16/2012 |
| #12-CN | Cementitious | Narrow side | 132.63 | 38.00 | 35.13 | 4.75 | 05/16/2012 |
Description of Test Setup
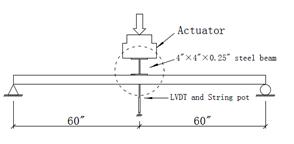
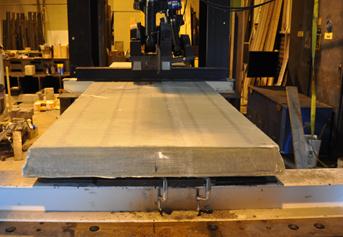
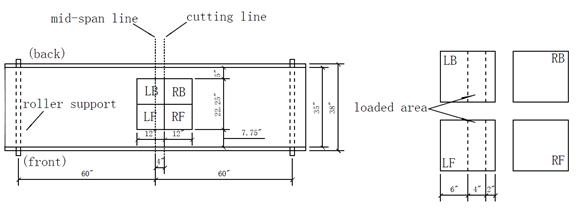
The FRP panels were tested under three-point loading (hydraulic actuator at midspan). Steel rollers were used for support between a 10-foot span length. A 110-kip load cell was used to collect load data. The test setup is shown in figure 31.
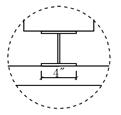
For the empty panels, the vertical deformation was measured using one LVDT and one string pot at the midpoint of the bottom plane. An I-shape steel beam (4-inch by 35-inch contact area) was used under the hydraulic actuator to create a 4-inch-wide distributed load over the FRP specimen.
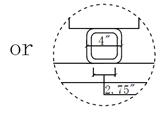
For the grouted panels, the vertical deformation was measured using one string pot at the midpoint of the bottom plane and two LVDTs placed 15 inches from the string pot, as shown in figure 32. A steel tube measuring 4 inches by 4 inches by 0.375 inches was used under the point load. The contact area of this steel tube is 2.75 inches multiplied by the width of the top plane (35 inches for WSD and 38 inches for WSU).
In some specimens, strain measurements were obtained from uniaxial and rosette strain gage configurations.
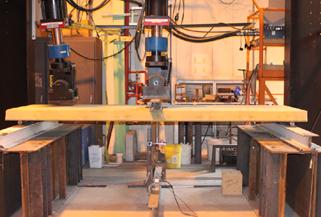
Side view of test setup
Figure 31. Photos and diagrams. FRP panel test setup.
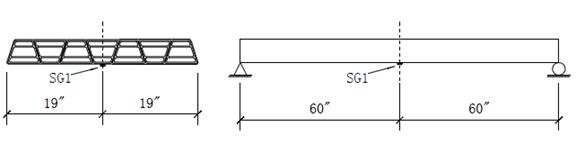 |
Figure 32. Diagrams. Strain gage location for panel #4.
Test Program
FRP Panels with No Grout
The panels with no grout were tested using the test setup described above. They were all loaded and unloaded in an elastic range (up to 20 kips). Panel #1 was tested both WSU and WSD. Panel #2 was tested WSD. Panel #3 was loaded and unloaded (up to 20 kips), then tested to failure. It was instrumented with two strain gages installed at the centerline of the panel width. SG1 was placed at midspan on the bottom surface; SG2 was attached 2.125 inches away from midspan on the top surface; see figure 33. Panel #4 was instrumented with one strain gage at midspan and centerline of the panel width on the bottom surface. Table 26 provides additional details on this test program.
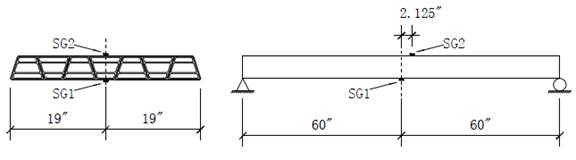
Figure 33. Diagrams. Strain gage location for panel #3 (tested to failure).
| Panel ID No. | Instrument used | Cross-section position | Max or Failure Load(kips) | Displacement at max or failure load (in.) | Flexural stiffness k (kip/in.) | Tested date |
|---|---|---|---|---|---|---|
| #1 | String pot & LVDT & 110 kips load cell |
WSU | 20 | 1.38 | 14.49 | 05/23/2012 |
| WSD | 1.39 | 14.4 | 05/23/2012 | |||
| #2 | String pot & LVDT & 110 kips load cell |
WSD | 20 | 1.37 | 14.72 | 05/22/2012 |
| #3 | String pot & LVDT & 110 kips load cell |
WSD | 20 | 1.44 | 14.32 | 05/22/2012 |
| String pot & 110 kips load cell & 2 strain gages | 61(fail) crush at top |
4.45 | 13.91 | 05/24/2012 | ||
| #4 | String pot & LVDT & 110 kips load cell & 1 strain gage |
WSD | 20 | 1.4 | 14.05 | 05/22/2012 |
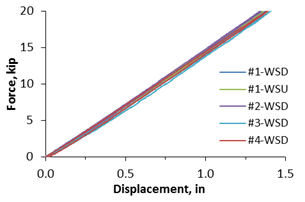
The load-deflection behavior of all FRP empty panels in the elastic range (up to 20 kips) is shown in figure 34 (left). Flexural stiffness, k, was calculated as the slope between 1 and 10 kips (except for panel #3). Results indicate that panels #1 through #4 have a very similar stiffness: average k =14.32 kip/inch, with a 2.9 percent variation. Panel #3 exhibited a change in stiffness around 3 kips of load. This is a very small change, possibly due to very localized damage on the panel, though this was not observed visually. Flexural stiffness was calculated between 5 and 15 kips (k = 14.32 kip/inch, as shown in table 26).
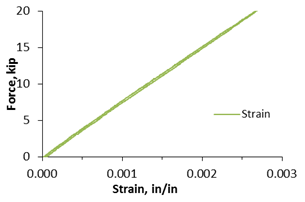
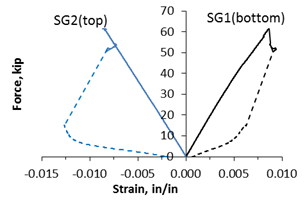
Strain data from the test of panel #4 has a linear response up to 20 kips of load; see figure 35 (left). Strain data from panel #3 are is illustrated in the graph on the right in figure 35. This shows that the strain gage on the top (SG2) behaves quite linearly, whereas SG1, located at the centerline and mid-width of the panel (bottom), exhibited a nonlinear response beyond 40 kips of applied load. Strain behavior during unloading of the specimen after failure is shown with dotted lines.
 |
 |
| a ) elastic response of all FRP panel-no grout | b) response to failure of panel #3 |
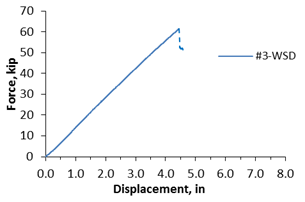
Figure 34. Graphs. Load-deflection response of FRP panels with no grout.
 |
 |
| a ) Load-strain response of panel #4 | b) Load-strain response of panel #3 |
Figure 35. Graphs. Load-strain response of FRP panels with no grout.
Panel #3 was loaded manually under displacement control. The first crack was heard around 32 kips. Additional cracking noises were heard with incremental loading, and they seemed to come from localized damage regions. At around 62 kips and 4.5 inches of deflection, a significant cracking noise was heard. It appears that one or more of the FRP tubes failed (compression at the top layer), and additional sounds were heard (the load dropped to around 52 kips). At this point, it was observed that the top of the outer wrap buckled in the vicinity of the steel tube. The test continued under increasing displacement, and after just few more major cracking sounds, the load dropped to around 15 kips (perhaps all the FRP tubes had failed at this point). The outer wrap showed a region of damage near the point load. The specimen was unloaded at this point. It was observed that very small permanent deformation (0.5 inches) remained after the specimen was fully unloaded. Residual strain values were also determined: SG1 (bottom) registered 0.07 percent, and SG2 (top) registered 0.18 percent of permanent deformation. Figure 36 shows the sequence of events.
 |
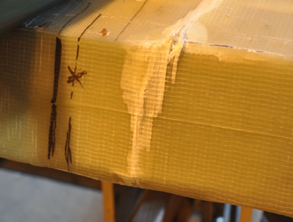 |
| Failure at midspan: buckling of outer wrap | Top surface of the damaged outer wrap |
Figure 36. Photos. Failure sequence of FRP panel #3 (no grout).
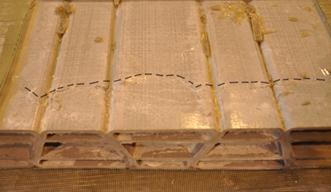
Figure 37 shows photographs of the cross section of panel #3 after failure. The failed panel was cut into two pieces along the width using a mansory blade, close to the damaged region. It appears that where the outer wrap buckled, the bond between the FRP tubes and the outer wrap was not strong. This may indicate that the tube surfaces may need better surface preparation, such as sanding. By contrast, visual inspection could not detect cracks betweeen the individual FRP tubes. In the future, nondestructive evaluation methods, such as acoustical emmission, could be used to investigate the possibility of damage. The top surface of the FRP plates was then exposed, and the compression cracks along the top section of the FRP tubes were photographed.
Four pieces of the outer wrap were obtained by additional cuts along the top surface of the FRP panel and were sent to a laboratory to determine “as-built” properties of the laminate. The laminate was tested in tension, compression, and shear to compare with previous test results. Fiber fraction was also determined.
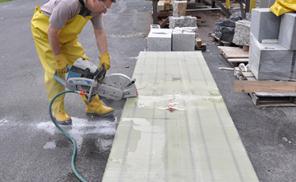 Cutting of the FRP panel #3 |
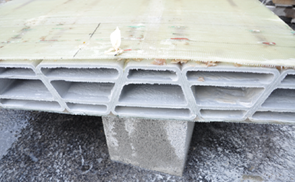 Cross section of panel #3 near damage region |
 Compression cracks on top of FRP tubes |
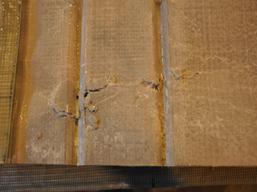 Craking detail-top surface FRP tubes |
 FRP panel #3- cut lines |
|
Figure 37. Photos and diagrams. Details of cut sections from panel #3.
Grouted Panels
Eight FRP grouted panels were tested using the same test setup as used for the non-grouted panels. The tested specimens had two different grouts and two different grouting configurations. Table 27 shows the details of this test program, including the position of the cross section, instrumentation used, and maximum loads and displacements. Flexural stiffness was calculated between two load levels in the elastic range (prior to first crack). Because each specimen’s elastic range is different, this information has been included in table 27. Panels #5, #8, #9, and #12 were loaded and unloaded to 20 or 22 kips and then to 38 kips; panels #6, #7, #10, and #11 were loaded and unloaded to 24 kips and then to 40 kips. Deformation of the FRP panel was recorded using two LVDTs and one string pot. No significant difference (in the order of 3.2 percent) was found between the deflections at the centerline vs. the edge.
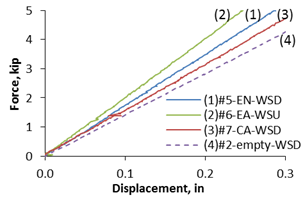
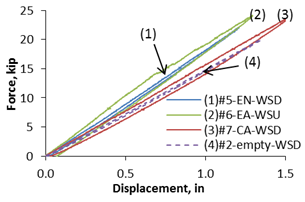
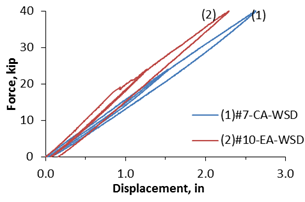
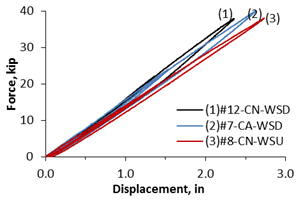
Table 27 shows that the elastic flexural stiffness of the cementitious grouted panels is very similar—k= 15.24 kip/inch, on average—regardless of the location of the filled cells and tested position. This k value is only 6.4 percent higher than for the panels without grout. The flexural stiffness of the epoxy grouted panels (filled in alternate cells) is 45 percent larger, on average, than that of the non-grouted panels; the flexural stiffness of the epoxy grouted panels (narrow side cells filled) is 26 percent larger than that of the non-grouted panels. Thus, the epoxy grouted panels with alternate cell filled are the most efficient panels with respect to flexural stiffness in the elastic range. Figure 38 shows the different load-deflection response of the grouted panels in the elastic range and overall response between epoxy grouted panels (filled with alternate cells and narrow side cells) and a cementitious grouted panel. Non-grouted (empty) panel response is also included for completeness.
The residual deformation data (after the last unloading cycle) is shown in table 27. The average residual deformation of the cementitious grouted panels was found to be 0.06 inches, while the average residual deformation of the epoxy grouted panels is 0.125 inches. It was noted that for panel #5 (epoxy grouted-EN), no cracking was heard during the loading portion of the test; this panel exhibited the smallest permanent deformation of all epoxy grouted panels.
| Panel ID No. | Instrument used | Cross-section position | Max Load(kips) | Displacement at max loads (inch) | Flexural stiffness (kip/in.) [load range, kip] |
Load and deflection at first crack (kips/in.) | Average residual deformation (inch) |
Date tested |
|---|---|---|---|---|---|---|---|---|
| #5-EN | String pot & 2 LVDT & 110 kips load cell | WSD | 20&38 | 1.21&2.09 | 17.94 [1-10] |
No crack sound heard | 0.05 | 05/31/2012 |
| #6-EA | String pot & 2 LVDT & 110 kips load cell | WSU | 24&40 | 1.29&2.28 | 20.91 [1-10] |
10.8/0.529 | 0.129 | 06/05/2012 |
| #7-CA | String pot & 2 LVDT & 110 kips load cell & 2 strain gage & 2 strain rosette | WSD | 24&40 | 1.53&2.63 | 15.58 [1-6.5] |
6.7/0.429 | 0.061 | 06/04/2012 |
| #8-CN | String pot & 2 LVDT & 110 kips load cell | WSU | 20&38 | 1.42&2.73 | 15.07 [0.5-3] |
3.2/0.219 | 0.074 | 05/30/2012 |
| #9-EN | String pot & 2 LVDT & 110 kips load cell | WSU | 22&38 | 1.34&2.60 | 18.09 [1-10] |
13.9/0.786 | 0.171 | 05/31/2012 |
| #10-EA | String pot & LVDT & 110 kips load cell & 2 strain gages & 2 strain rosette | WSD | 24&40 | 1.27&2.29 | 20.72 [1-10] |
19/0.931 | 0.151 | 06/04/2012 |
| #11-CA | String pot & 2 LVDT & 110 kips load cell | WSU | 24&40 | 1.50&2.57 | 15.02 [1-5] |
5.3/0.337 | 0.056 | 06/04/2012 |
| #12-CN | String pot & LVDT & 110 kips load cell | WSD | 22&38 | 1.36&2.36 | 15.29 [1-4] |
4.2/0.274 | 0.047 | 05/30/2012 |
 |
 |
| a) Elastic response of FRP panels | b) Overall response up to 20 kips of FRP panels |
 |
 |
| c) Grout effect on alternate filled cell configuration | d) cementitious grout effect on FRP panels |
Figure 38. Graphs. Load-deflection response of FRP grouted panels.
The elastic flexural stiffness of the epoxy grouted panel is 36 percent larger than that of the cementitious grouted panel. However, cracking of the epoxy grout beyond 20 kips of applied load significantly affect the stiffness of the panel, as shown in the graph at the bottom left in figure 38. With increasing loading, the flexural stiffness drops to 16 kip/inch at the load range of 25 to 35 kips, which is only 7 percent larger than the cementitious grouted panel (k=14.9 kip/inch) measured at the same load range. The graph at the bottom right of figure 38 shows that even thought the position of the cementitious grout does not affect the flexural stiffness of the FRP panels on the elastic range (before first cracking), it does affect the load-deformation behavior in the cracked region.
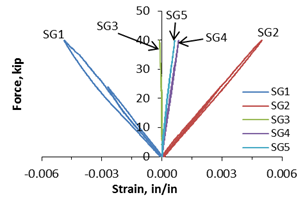
Two grouted panels (#7 and #10) were instrumented with strain gages (uniaxial and rosette configuration). Panel #7 has one strain gage at the top (SG1), one strain gage at the bottom (SG2), and two strain gage rosettes on each side (SG3-5, SG6-8). Panel #10 has one strain gage at the top (SG1), one strain gage at the bottom (SG2), and one strain rosette on the front side (SG3-5). Strain gage positions are shown in figures 39 and 40.
Figures 41 through 43 show load-strain plots. Figure 43 shows a comparison of the strain behavior at the top and bottom of the FRP panels #7-CA and #10-EA. Up to a load of 20 kips, the strain-load curves for SG1 (top) and SG2 (bottom) look quite symmetrical for both panels. Beyond 20 kips, the epoxy grouted panel (#10-EA) cracks in tension (SG2); in contrast, SG1 doesn’t show any disturbance. SG2 in panel #10 has a similar response as SG2 for panel #7 (cementitious grout-CA).
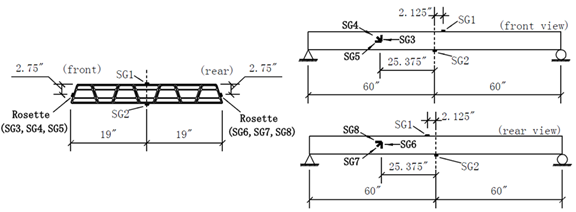
Figure 39. Diagrams. Strain gage location for panel #7.
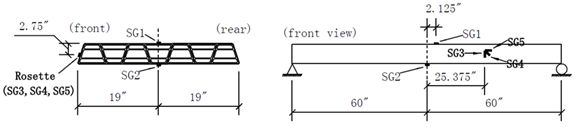
Figure 40. Diagrams. Strain gage location for panel #10.
 |
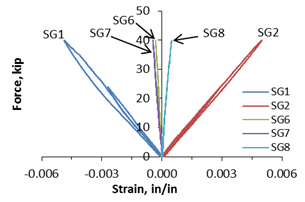 |
Figure 41. Graphs. Load-strain response of FRP panel #7-CA.
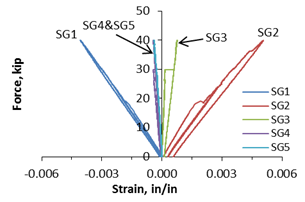
Figure 42. Graph. Load-strain plot of FRP panel #10-EA.
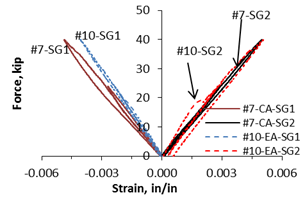
Figure 43. Graph. Load-strain (top & bottom) FRP panels.
Conclusions
Based on the experimental program developed, the following conclusions can be drawn:
- Load-deflection test of four FRP panels without grout shows that they have similar flexural stiffness (k=14.32kip/inch, with a 2.9 percent variation).
- The flexural stiffness of the epoxy grouted panels (filled in alternate cells) is 45 percent larger, on average, than that of the non-grouted panels, whereas the epoxy grouted panels with cells filled on the narrow side only have a 26 percent increase.
- The cementitious grouted FRP panels only showed an increase of 6.4 percent of flexural stiffness when compared to the empty panels. Very little effect was observed from changes in the location of the filled cells and/or tested position.
- The higher flexural stiffness of the epoxy grouted panels significantly decreases when the grout (or bond between grout and FRP tube) cracks, around 20 kips. Post-cracking stiffness value approaches that of the cementitious panels.
- Even thought the position of the cementitious grout does not affect the flexural stiffness of the FRP panels on the elastic range (before first cracking), it does affect the load-deformation behavior in the cracked region.
- Strain data show that the epoxy grouted FRP panel with alternate cells filled has grout cracking (or bond failure) in the tension region at a 20-kip load level.
- Although both grouts achieved fairly highly strength within a short time, the epoxy grout is preferred because of the apparent better bond between it and the FRP surface. Further information about the grouts can be found in Appendix D.