

Composite Bridge Decking: Phase I Design Report
APPENDIX H: PANEL FATIGUE TEST REPORT
Description of the Tested Specimen
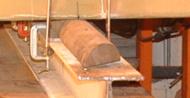
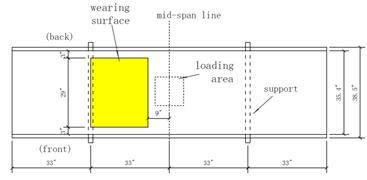
This appendix reports the details of testing a panel composed of seven FRP tubes with no grout. Manufacturing details are listed in figure 48. The panel was positioned WSD, as shown in figure 49. The length of panel is 11 feet; the cross section dimensions are shown in figure 50.
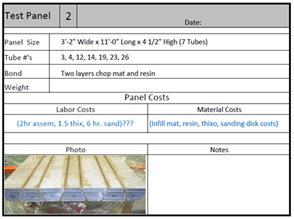
Figure 48. Specifications with photo. Manufacturing details of tested panel.
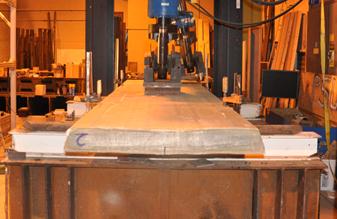
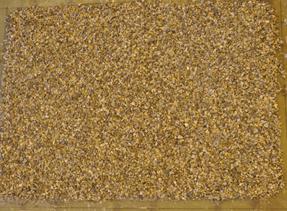
Figure 49. Photo. FRP panel (WSD).
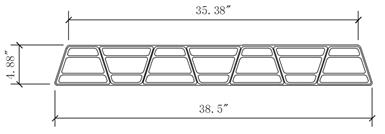
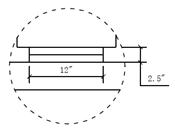
Figure 50. Diagram. Cross section dimensions of the FRP panel tested in fatigue.
Description of Test Setup
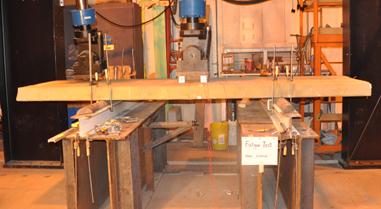
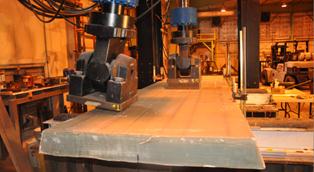
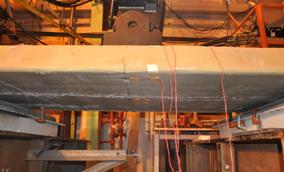
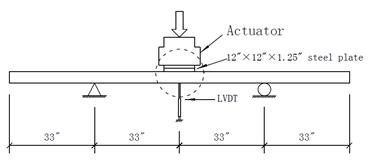
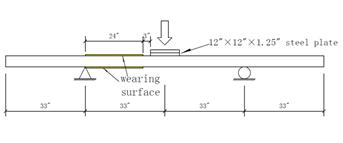
Figure 51 shows the fatigue test setup. The FRP panel was tested under three-point loading (hydraulic actuator at midspan). Half-round steel sections were used as support between a 5.5-foot span. A 110-kip load cell was used to collect the load data. To prevent possible "pounding" effects between the FRP deck panel and the supports during testing, two clamps were used at each side. Two steel plates (12 inches by 12 inches by 1.25 inches) were used under the hydraulic actuator to create a 144 in2 distributed load over the FRP specimen. One LVDT was placed at the midpoint of bottom face of the panel to measure the deflection during the static load tests; it was used to measure flexure stiffness.
 |
 |
 |
|
 |
 |
  |
|
Figure 51. Photos and diagram. Fatigue test setup.
Test Program
Load was applied on a range of 1 to 14 kips in flexure (compression on top face of panel) using a hydraulic actuator. A command sinusoidal wave with a 1.5 Hz frequency was used. Testing started at 7:00 am every day and ended at 10:00 pm. This cyclic testing was interrupted one time during the day (at 1:00 pm) to conduct a monotonic test (under displacement control). The specimen was loaded up to 14 kips and unloaded; 14 kips is considered equivalent to the effect of the design truck (16 kips) times the dynamic allowance (1.15) times the load factor assuming a finite life check (0.75). Load, displacement (from LVDT and actuator), and strains at various locations were recorded. Cyclic testing resumed after that. From each monotonic test, flexure stiffness as a function of the number of cycles was calculated (load range of 2 to 12 kips). Table 28 provides this information, as well as the ratio of each stiffness value with respect to that at zero cycles. Figure 52 shows the stiffness ratios as a function of the fatigue load cycles.
Date |
Time | Cycle done | LVDT | Actuator | ||
|---|---|---|---|---|---|---|
| Stiffness, kip/in (from 2 kip to 12 kip) |
Stiffness/initial stiffness | Stiffness, kip/in (from 2 kip to 12 kip) |
Stiffness/initial stiffness | |||
| 06/18/2012 | 10:00am. | 0 | 69.11 | 1.000 | 51.16 | 1.000 |
| 06/18/2012 | 3:30pm. | 14722 | 70.44 | 1.019 | 53.19 | 1.040 |
| 06/20/2012 | 1:00pm. | 149542 | 70.49 | 1.020 | 53.84 | 1.052 |
| 06/22/2012 | 1:00pm. | 290100 | 69.59 | 1.007 | 53.78 | 1.051 |
| 06/24/2012 | 1:00pm. | 436342 | 70.02 | 1.013 | 53.73 | 1.050 |
| 06/25/2012 | 1:00pm. | 507044 | 68.84 | 0.996 | 53.30 | 1.042 |
| 07/03/2012 | 1:30pm. | 655021 | 68.36 | 0.989 | 53.44 | 1.045 |
| 07/05/2012 | 1:00pm. | 793782 | 69.01 | 0.999 | 55.13 | 1.078 |
| 07/08/2012 | 1:00pm. | 980990 | 69.07 | 0.999 | 55.80 | 1.091 |
| 07/08/2012 | 9:50pm. | 1025326 | 69.78 | 1.010 | 55.46 | 1.084 |
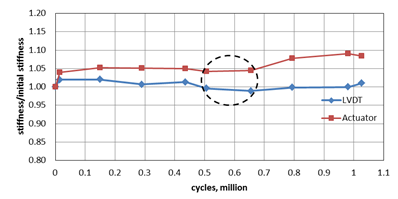
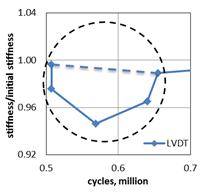
Figure 52. Graphs. Stiffness ratios as function of the number of fatigue load cycles (left); temporary change in stiffness between 500,000 and 650,000 cycles (right).
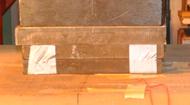
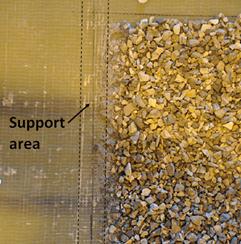
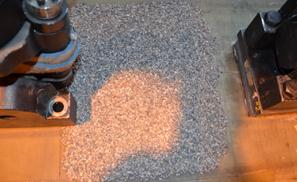
The graph at the left of figure 52 shows that the stiffness ratios measured at different cycles did not vary more than 3 percent from the original stiffness. It can be concluded that after 1 million cycles there is no evidence of stiffness degradation. At 500,000 cycles, the test was temporarily stopped so a wearing surface could be applied to the bottom face of the FRP panel deck; see figure 53. After the cyclic testing resumed, a drop on the stiffness ratio was experienced for about 130,000 cycles, as shown in the graph at the right of figure 52. The maximum value corresponded to a 6 percent drop at 570,000 cycles; however, it vanished after that (650,000 cycles). It is hypothesized that because the wearing surface was applied quite close to the support area (see the photograph in figure 53), it might have produced a gap between the support and the panel, which caused the stiffness to temporarily drop.
  |
 Wearing surface on bottom side (which is subjected to tension) after 1 million cycles fatigue load |
Figure 53. Diagrams and photo. Location of wearing surfaces: applied to top and bottom of deck panel to assess performance in compression and tension.
Figure 54 shows the load-deflection behavior at different fatigue cycles. The load-deflection curve is not quite linear; see for comparison the tangential line drawn in figure 54. The panel becomes "stiffer" after the load reaches 6 kips. The initial load-deflection curve matches well with the curve after 1 million cycles of fatigue loading. The slope of the load-deflection curve at 570,000 fatigue cycles is slightly smaller than the slope of the initial curve, which is indicated as a stiffness drop in figure 52.
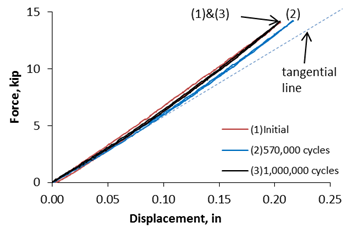
Figure 54. Graph. Load-deflection behavior at different fatigue cycles.
To evaluate the sensitivity of the stiffness measurements to the time of the day when they are taken, the flexure stiffness was measured three times a day from June 22 to June 24, 2012 (at 7:00 am, 1:00 pm, and 10:00 pm.) Results are shown in figure 55. Although these results show that the stiffness measurements change within the day (changes in the order of 2 percent were found), no clear pattern was determined, although it appears that there is a drop of stiffness overnight.
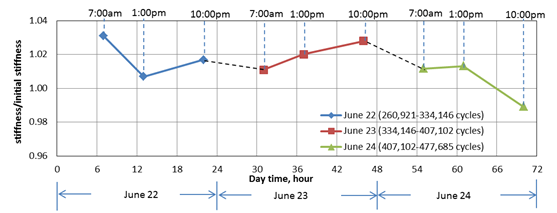
Figure 55. Graph. Stiffness change during daytime.
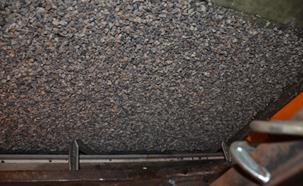
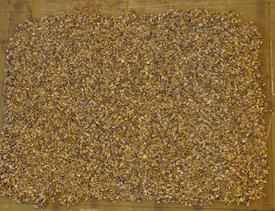
As indicated before, a wearing surface composed of epoxy compound and exposed aggregate was applied at the bottom of the FRP panel (subjected to tension) at 500,000 fatigue cycles. In addition, the same type of wearing surface was installed at the top of the panel (subjected to compression) at 650,000 fatigue cycles. Both were applied over an area of 29 inches by 24 inches. After 1 million cycles fatigue load, neither the top nor the bottom wearing surfaces showed any visible damage or cracks. Figures 56 and 57 show photographs of the wearing surfaces before and after their respective exposure to cyclic loading.
Figure 58 shows the position of five strain gages (SG1-SG5) installed on the FRP panel surface. SG1 and SG2 were placed on the top face beside the loading steel plate. SG3 (top) and SG4 (bottom) were placed at midspan toward the edge of the panel. SG5 was installed at the midpoint of the bottom face of the panel.
 Bottom-Initial |
 Bottom-Final |
 Top-Initial |
 Top-Final |
| Figure 56. Photos. Bottom wearing surface before and after 500,000 cycles fatigue load. | Figure 57. Photos. Top wearing surface before and after 350,000 cycles fatigue load |
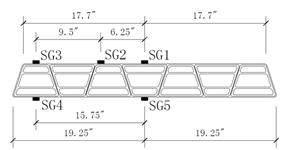
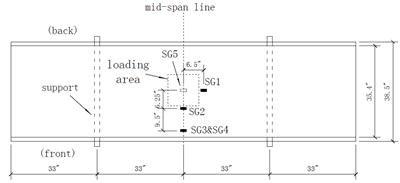
Figure 58. Diagrams. Strain gage position.
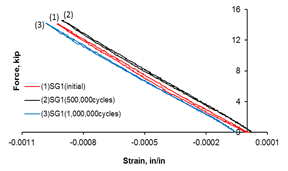
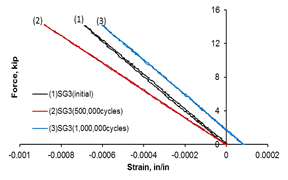
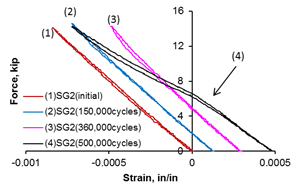
Figures 59 through 62 show load-strain behavior for the five strain gages at different fatigue cycles. Despite the presence of small residual strains, load-strain curves for SG1 and SG4 showed little change during the fatigue test (see figures 59 and 60). In figure 61, the slope of the curve for SG3 at 1,000,000 fatigue cycles is almost the same as the initial one. However, the slope at 500,000 fatigue cycles is 21 percent smaller. Figure 62 shows that the slope of the curve for SG5 at 500,000 fatigue cycles is smaller (15 percent) than the initial slope and remains similar at 1,000,000 fatigue cycles. Load-strain behavior of SG2 in figure 63 shows a large residual strain at this location. At 500,000 fatigue cycles, there is a sudden change of slope at 6.5 kips; this may due to the local damage of the FRP deck (or strain gage) at this location. Unfortunately, SG2 was broken due to the slight movement of the loading steel plate at around 600,000 fatigue cycles, so no more data were collected beyond that point.
 |
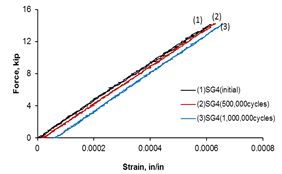 |
| Figure 59. Graph. Load-strain behavior (SG1). | Figure 60. Graph. Load-strain behavior (SG4). |
 |
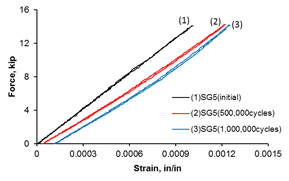 |
| Figure 61. Graph. Load-strain behavior (SG3). | Figure 62. Graph. Load-strain behavior (SG5). |
 |
|
| Figure 63. Graph. Load-strain behavior (SG2). | |
Conclusions
Based on the experimental program developed, the following conclusions can be drawn:
- The fatigue test shows that there is no stiffness degradation of the FRP panel after 1 million cycles fatigue load (1 to 14 kips of midspan loading).
- Load-deflection plots show a slightly nonlinear behavior of the FRP panel. The panel becomes "stiffer" after the load reaches 6 kips.
- The wearing surface subjected to tension stresses shows no visible damage or cracking after 500,000 cycles fatigue load; the wearing surface subjected to compression shows no visible damage or cracks after 350,000 cycles fatigue load.
- Load-strain behavior of SG2, located on the top surface near the applied loading plate, indicates the possibility of localized damage of the FRP deck (or strain gage) area at that location at 360,000 fatigue cycles.