

Composite Bridge Decking: Phase I Design Report
APPENDIX K: WEARING SURFACE TEST
Description of the Test Specimen
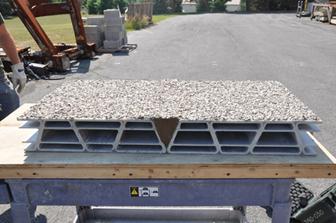
A section of an FRP panel, similar to the specimen used for the end panel connection test (see Appendix I), and with a wearing surface composed of adhesively bonded flint aggregate, was tested following ASTM D 7522 guidelines. The stone was identified as R65-8. The gradation was such that 65 percent is retained on a #8 sieve and 20 to 30 percent is retained on a #6 sieve. Test results provide the pull-off strength of the adhesive bonded to the FRP surface, as well as the pull-off strength of the aggregate embedded into the adhesive. Figure 89 shows photographs of the specimen and the wearing surface.
 |
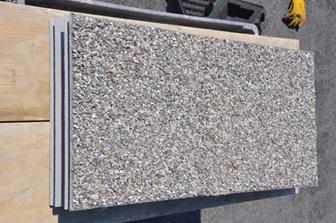 |
Figure 89. Photos. FRP specimen used for pull-off tests.
Description of Test Setup
Two test areas were prepared for the two different interfaces (see figure 90). To test the adhesive-FRP pull-off strength, the layer of aggregate was removed with a hand grinder. Special attention was given not to remove the adhesive layer. The area was cleaned, and dollies 1, 2, 3, 7, 8, and 9 were bonded with a two-part epoxy. After 24 hours of curing, the areas around the dollies were scored through the layer of adhesive and into the FRP. To test the pull-off strength of the aggregate to the adhesive, the second test area was cleaned and loose aggregate removed. Zones with an even amount of aggregate were chosen (to minimize bonding of the epoxy and the adhesive). Dollies 4, 5, and 6 were not scored because it was feared the drill would rip the aggregate out as opposed to grinding it.
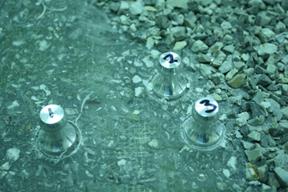 (a) Adhesive-FRP test |
 (b) Aggregate-adhesive test |
Figure 90. Photos. Dollies mounted to two test areas.
Test Program
Using a pull-off adhesion tester, all the dollies were removed. Due to incorrect calibration, data from dollies 1, 2, and 3 were rendered invalid. Results from testing the remaining dollies are presented in table 31.
| Specimen | Recorded Stress (psi) | Area Corrected Stress (psi) | |
|---|---|---|---|
| Adhesive to Aggregate | 4 | 621 | 292 |
| 5 | 886 | 380 | |
| 6 | 767 | 372 | |
| Adhesive to FRP | 7 | 850 | 850 |
| 8 | 900 | 900 | |
| 9 | 726 | 726 |
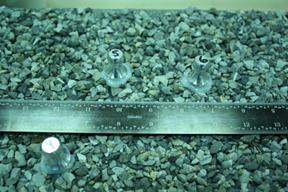
Figure 91 shows the failure surface for dollies 4, 5, and 6. Since failure did not occur along the dolly perimeter, as the apparatus assumed, the stress was calculated over the area within the aggregate perimeter. The average "area corrected" stress, reported in table 31, was only 348 psi, which reflects how easily individual pieces could be removed by hand on the original specimen prior to testing.
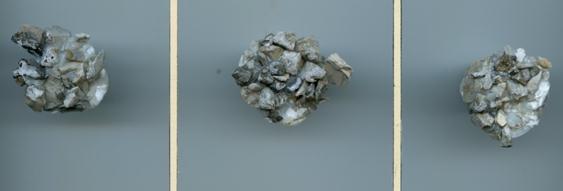
Figure 91. Photos. Failure surfaces of aggregate to adhesive pull-off tests (dollies 4, 5, and 6).
Dollies 7, 8, and 9, shown in figure 92, had higher pull-off strength, with an average of 825 psi. The failure occurred along the adhesive-epoxy interface, so no area correction was required. Some small pieces of aggregate that were too close to the FRP layer to be removed when grinding was done, appeared in the failure surface, thus indicating that the bond strength between the aggregate and the adhesive will always be the weakest layer and that the bond strength between the adhesive and the FRP surface is stronger than 825 psi.
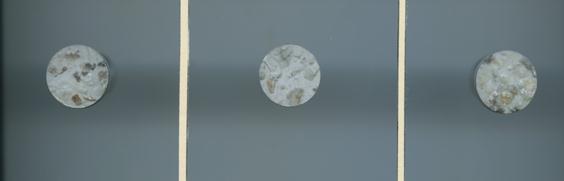
Figure 92. Photos. Failure surfaces of adhesive to FRP pull-off tests (dollies 7, 8, and 9).