

chapter 6
Historical Expenditure and Funding Trends
Capital Outlays on Federal-Aid Highways
Capital Outlays on the National Highway System
Capital Outlays on the Interstate System
Level and Composition of Transit Funding
Funding in Current and Constant Dollars
Capital Funding and Expenditures
Operating Expenditures by Transit Mode
Operating Expenditures by Type of Cost
Operating Expenditures per Vehicle Revenue Mile
Operating Expenditures per Passenger Mile
Highway Finance
This chapter presents data and analyses for finance trends for highways and transit across all levels of government and sources of funding. The revenue sources for investments in highways and bridges are discussed first, followed by the details of total highway expenditures and, more specifically, capital outlays. A separate section presents data on transit system funding, highlighting trends in revenues, capital, and operating expenditures.
The classification of the revenue and expenditure items in this section is based on definitions contained in A Guide to Reporting Highway Statistics (http://www.fhwa.dot.gov/policyinformation/hss/guide/guide.pdf), which is the instructional manual for States providing financial data for the Highway Statistics (http://www.fhwa.dot.gov/policyinformation/statistics.cfm) publication.
Revenue Sources for Highways
The revenue collected in 2012 from all levels of government for highways and bridges was $216.6 billion, as illustrated in Exhibit 6-1. Of the total revenues generated, the Federal government contributed $42.8 billion; State governments, $106.3 billion; and local governments, $67.5 billion.
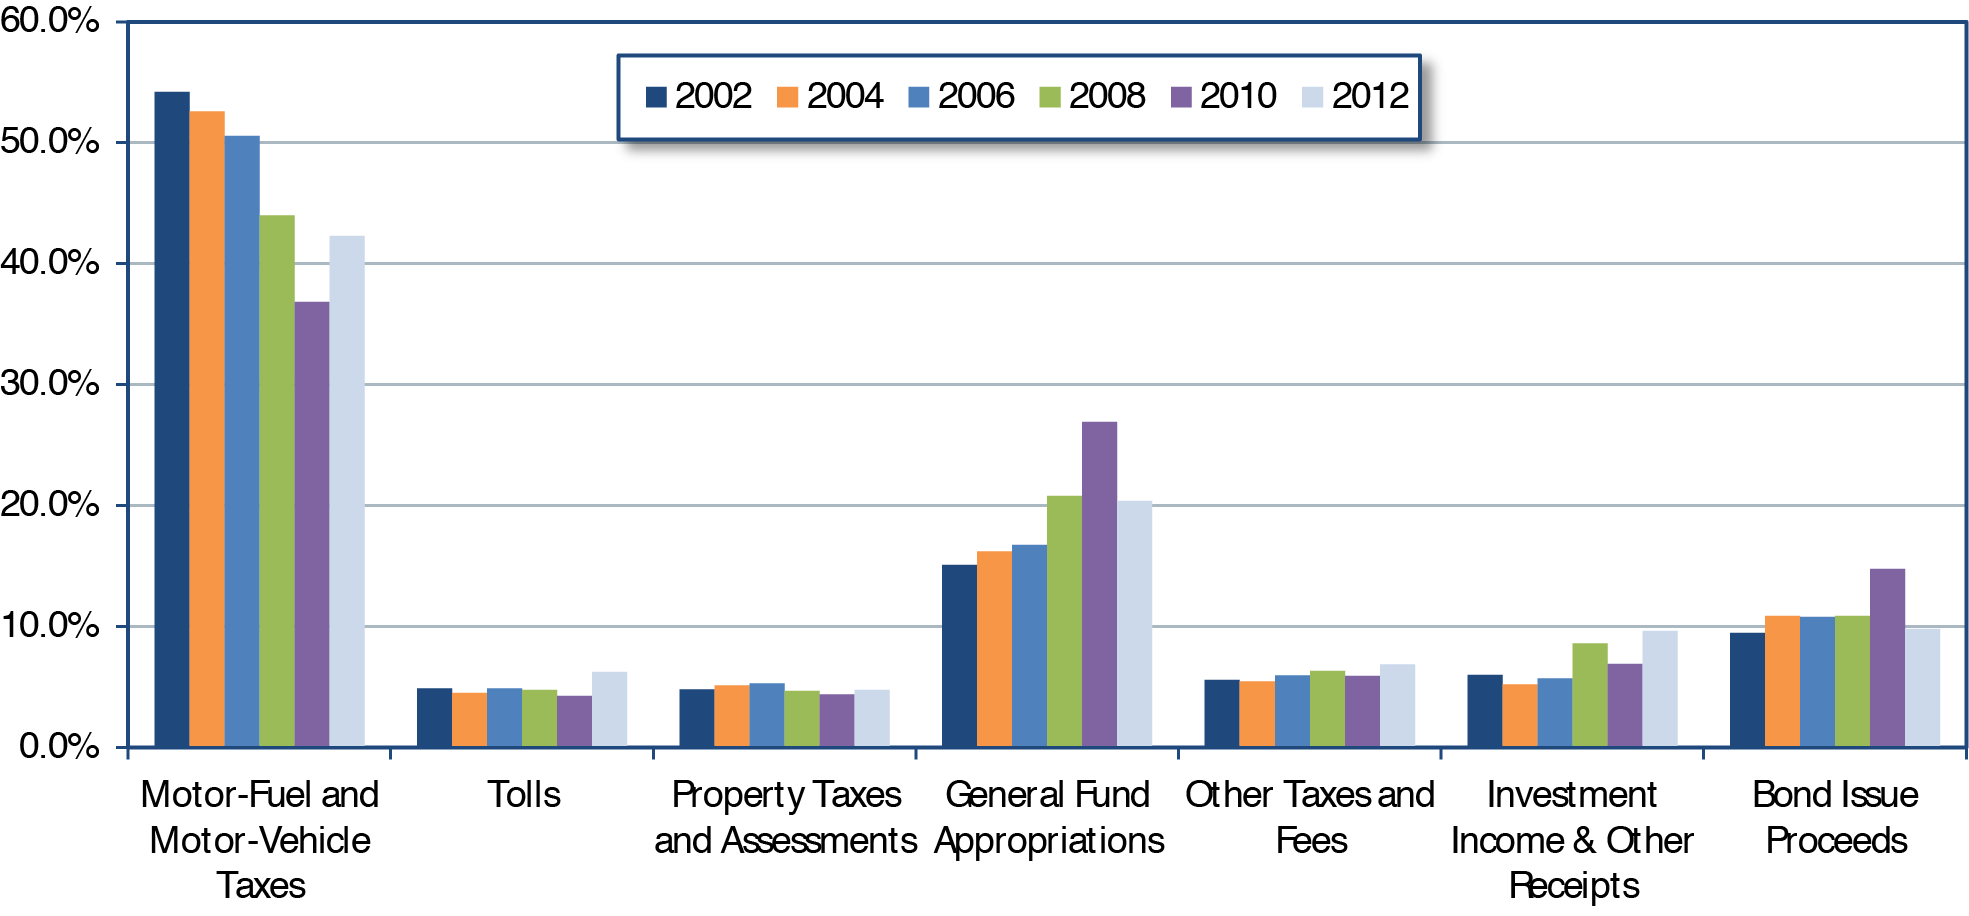
These revenues were raised from user charges (motor-fuel tax, motor-vehicle taxes and fees, and tolls) and several other sources (General Fund appropriations, other taxes, investment income, and debt financing). In 2012, the overall split between user charges and other sources was about even, at 48.6 percent versus 51.4 percent . The reliance on different sources, however, differs significantly by level of government.
User charges, in particular motor-fuel taxes, account for most of the Federal revenues raised for highways-80 percent in 2012. User charges also account for most of the revenues that State governments raise. In 2012, State governments raised $106.3 billion of highway funding, of which $66.7 billion (about two-thirds), derived from State-imposed fees on highway users. Funding from other sources ($39.5 billion) included $12.4 billion from bond sale proceeds. In contrast, the revenues that local governments raise for highways derive mainly from sources other than user charges. This difference is partly because many States prohibit local governments from imposing taxes on motor fuel or motor vehicles and, where allowed, these taxes are often capped at low rates. The source on which local governments rely most heavily is general fund appropriations, which in 2012 accounted for nearly half, or $31.4 billion, of the total $67.5 billion in revenue raised. The next largest sources were property taxes and bond sale proceeds, at $10.3 billion and $8.9 billion. User charges generated only $4.6 billion of revenue.

No. The $105.2 billion identified as highway-user charges in Exhibit 6-1 represents only 78.7 percent of total highway-user revenue, defined as all revenue generated by motor-fuel taxes, motor-vehicle taxes, and tolls. Exhibit 6-2 shows that combined highway-user revenue collected in 2012 by all levels of government totaled $133.6 billion.
Exhibit 6-2 Disposition of Highway-User Revenue by Level of Government, 2012 |
||||
|---|---|---|---|---|
| Revenue, Billions of Dollars | ||||
| Federal | State | Local | Total | |
| Highways | $33.8 | $66.7 | $4.6 | $105.2 |
| Transit | $6.1 | $10.6 | $1.1 | $17.9 |
| Other | $0.3 | $10.2 | $0.1 | $10.6 |
| Total Collected | $40.3 | $87.6 | $5.7 | $133.6 |
| Source: Highway Statistics 2012, Table HF-10, (revised). | ||||
In 2012, $17.9 billion of highway-user revenue was used for transit, and $10.6 billion was used for other purposes, such as ports, schools, collection costs, and general government activities. The $0.3 billion shown as Federal highway-user revenue used for other purposes reflects the difference between total collections in 2012 and the amounts deposited into the Highway Trust Fund during Fiscal Year 2012. Much of this difference is attributable to the proceeds from the deposits of the 0.1-cent portion of the Federal motor-fuel tax into the Leaking Underground Storage Tank trust fund.
The $6.1 billion shown as Federal highway-user revenue used for transit includes deposits into the Transit Account of the Highway Trust Fund and deposits into the Highway Account of the Highway Trust Fund that States elected to use for transit purposes.
As shown in Exhibit 6-1, all levels of government combined spent $221.3 billion for highways in 2012. The net difference of $4.8 billion between the total revenues generated during the year and the expenditures during the year reduced reserves available for use in future years. For example, the $4.6-billion difference between total Federal revenues and expenditures represents the decrease in the cash balance of the Highway Account of the Highway Trust Fund (HTF) in 2012. Although individual State and local governments might have increased or decreased their cash balances, the net national balance was an increase in reserves for State governments of $0.4 billion and a decrease for local governments of $0.6 billion.
The total proceeds to the Highway Account of the HTF from dedicated excise taxes and other receipts have been less than expenditures for many years. Funds were transferred from the Federal General Fund to the Highway Account in 2008, 2009, and 2010 to keep the account solvent. In 2012, $2.4 billion was transferred from the balance of the Leaking Underground Storage Tank Fund to the Highway Account; these are identified as "Investment Income and Other Receipts" in Exhibit 6-1, although the original source of these funds was revenues generated in prior years from a 0.1-cent tax on motor fuels.
The last time that annual net receipts credited to the Highway Account of the Highway Trust Fund exceeded annual expenditures from the Highway Account was in 2000. As shown in Exhibit 6-3, for each year since 2000, total annual receipts to the Highway Account from excise taxes and other income (such as interest income and motor-carrier safety fines and penalties) have been lower than the annual expenditures from the Highway Account (including amounts transferred to the Transit Account).
Exhibit 6-3 Highway Trust Fund Highway Account Receipts and Outlays, Fiscal Years 2000—2014
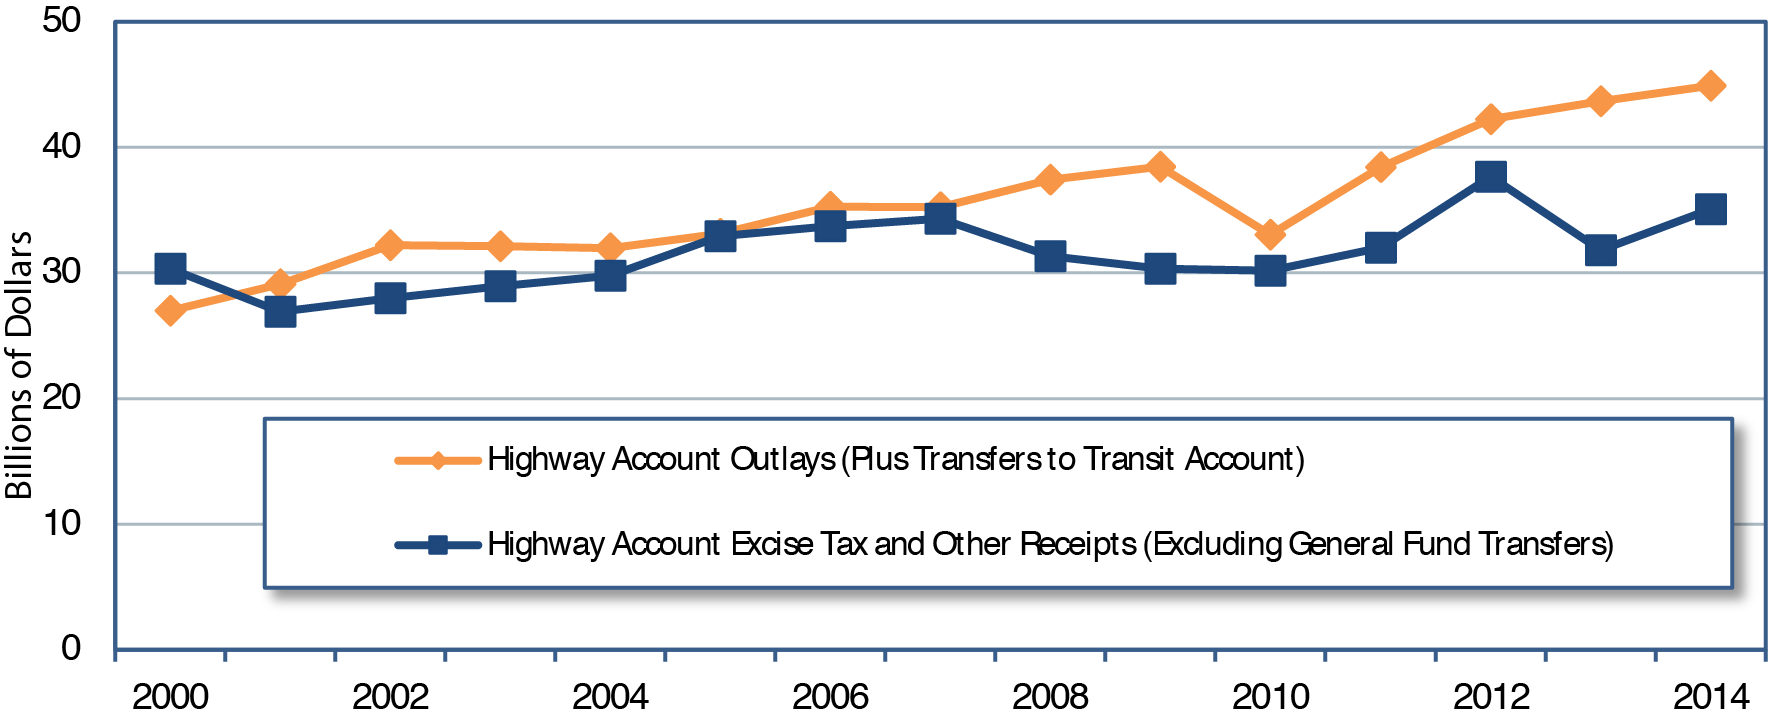
Source: Highway Statistics, various years, Tables FE-210 and FE-10.
To help maintain a positive cash balance in the Highway Trust Fund, transfers from the General Fund to the Highway Trust Fund were legislatively mandated in Fiscal Years 2008, 2009, 2010, 2013, and 2014. In Fiscal Years 2012 and 2014, funds were transferred from the balance of the Leaking Underground Storage Tank Fund to the Highway Trust Fund; the original source of these funds was revenues generated in previous years from a 0.1-cent portion of the Federal tax on motor fuels.
The Investment Income and Other Receipts category in Exhibit 6-1 includes development fees and special district assessments and private-sector investment in highways to the extent that such investment is captured in State and local accounting systems.
Financing for highways comes from both public and private sectors. The private sector has increasingly been instrumental in the delivery of highway infrastructure, but the public sector still provides the vast majority of funding. The financial statistics presented in this chapter are drawn predominantly from State reports based on State and local accounting systems. Figures in these systems can include some private-sector investment; where so, these amounts are generally classified as "Other Receipts." For additional information on private-sector investment in highways, see http://www.fhwa.dot.gov/ipd/p3.
Revenue Trends
Since passage of the Federal-Aid Highway Act of 1956 and establishment of the HTF, user charges such as motor-fuel and motor-vehicle tax receipts have consistently provided most of the combined revenues raised for highway and bridge programs by all levels of government. After 2006, when user revenues flattened and transfers were made to keep the HTF solvent, the share of user revenues, excluding tolls, fell below 50 percent .
Exhibit 6-4 shows the trends in revenues used for highways by source for all levels of government from 2002 to 2012. From 2010 to 2012, total revenues generated for highways declined from $228.3 billion to $216.6 billion. This decrease was driven by reductions in General Fund appropriations and bond issue proceeds; all other sources of revenue increased between these 2 years. The 2010 funding levels for both General Fund appropriations and bond issue proceeds were atypically high and could reflect the actions of governments to fund transportation to support jobs and to take advantage of low construction prices and interest rates during a period of recession. Some decrease in General Fund appropriations between 2010 and 2012 reflects the phasedown of the American Recovery and Reinvestment Act, which was enacted in February 2009 and provided additional funds for transportation and other programs. Of the funds authorized under the Recovery Act, $11.9 billion was expended for highway purposes in 2010, which dropped to $3.0 billion in 2012.
The revenues generated by user charges increased from 2010 to 2012; combined motor-fuel and motor-vehicle tax revenues rose by $7.5 billion, while toll revenues rose by $3.8 billion after many years of little growth.
From 2002 to 2012, total revenues for highways have increased at an annual rate of 4.9 percent . The increase in motor-fuel and motor-vehicle revenues was 2.3 percent , the lowest among the funding sources, even though these revenues increased by 9.0 percent from 2010 to 2012. The increase in General Fund appropriations averaged 8.1 percent per year, despite the decline between 2010 and 2012 of 28.2 percent . Investment income and other receipts increased at an average annual rate of 10.0 percent over the 10-year period, with a 2010-to-2012 increase of 32.5 percent.
Source: Highway Statistics, various years, Tables HF-10A and HF-10.
The graph at the bottom of Exhibit 6-4 shows the percentage share of each funding source by year for 2002—2012. Until 2012, the share of revenues from user charges, excluding tolls, had declined from more than 50 percent to less than 40 percent . This trend changed in 2012, when the share of these user charges increased to more than 40 percent .
Exhibit 6-5 shows the change in the share of highway revenue derived from user charges by level of government. The share declined for all levels of government combined from 2002 to 2010, and then rebounded slightly from 2010 to 2012. At the Federal level, the decline from 2007 to 2010 can be attributed in part to General Fund transfers to the HTF and to General Funds provided through the Recovery Act. Since 2010, the percentage of Federal highway revenue derived from user charges has increased from 49.1 percent to 79.1 percent . The State user revenue share also increased from 55.3 percent to 62.8 percent from 2010 to 2012. User charges have continued to decline as a share of local government revenue between these 2 years.
Exhibit 6-5 Percentages of Highway Revenue Derived from User Charges, Each Level of Government, 2002—2012
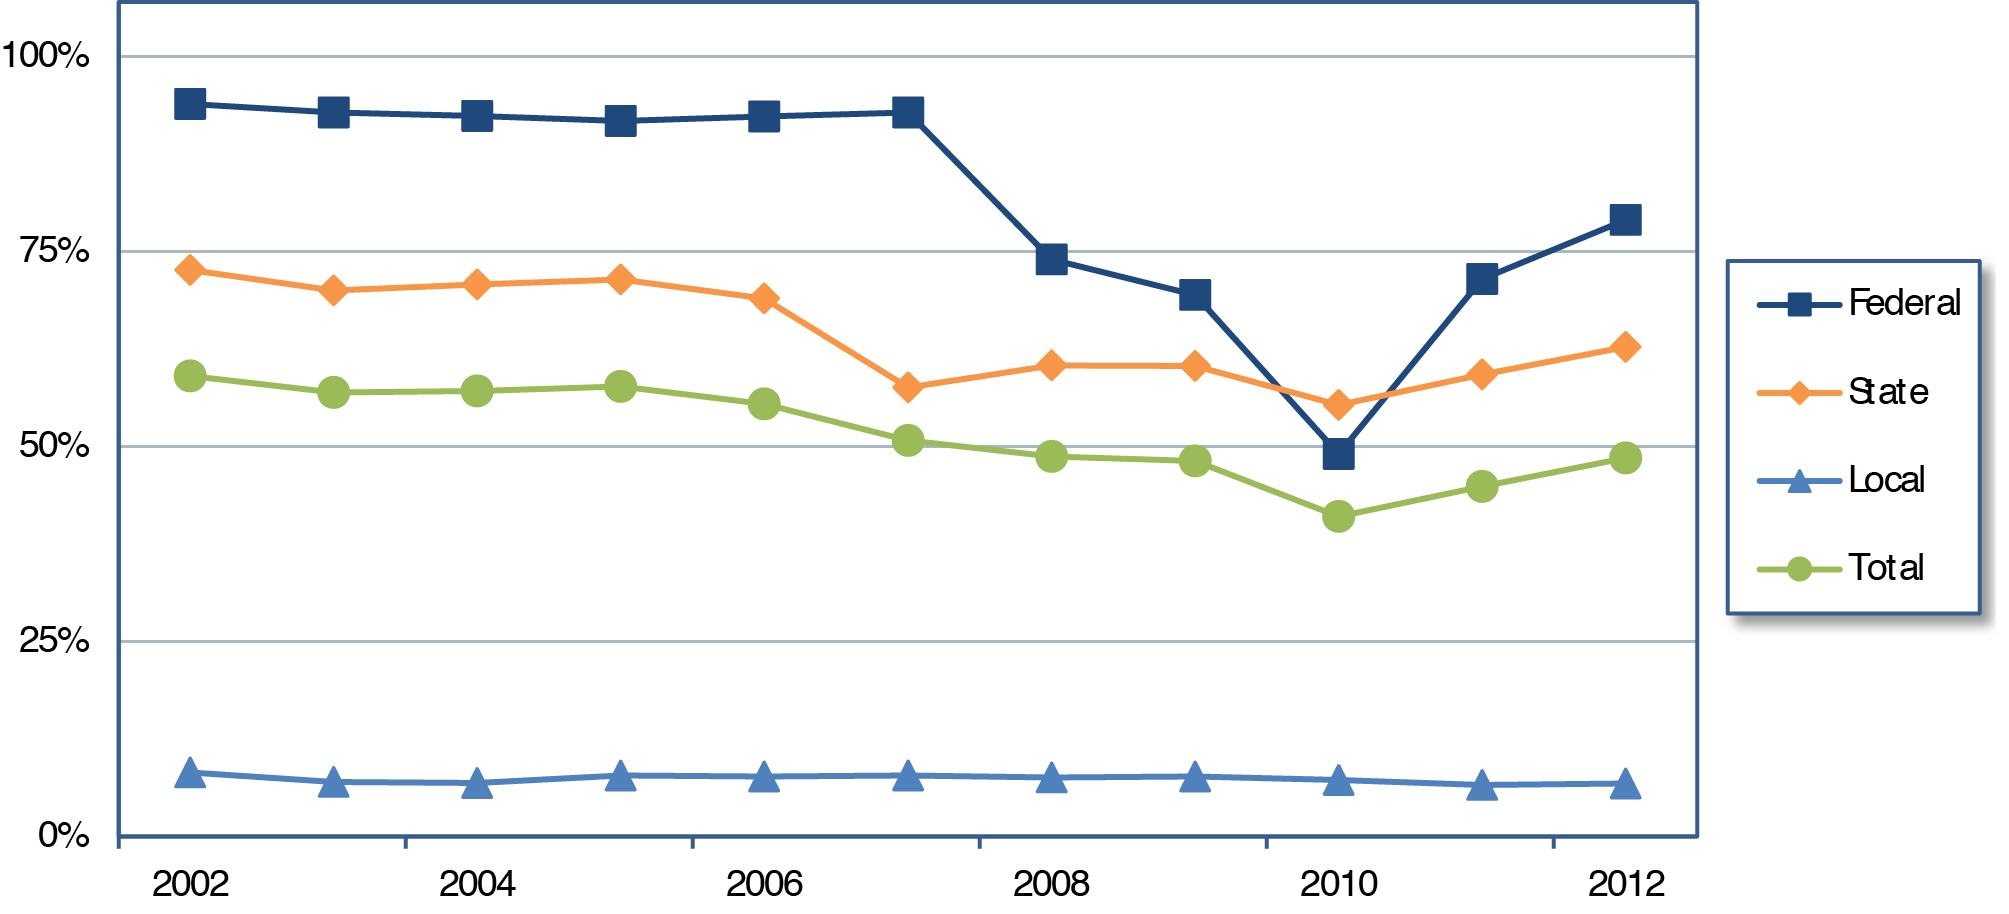
Source: Highway Statistics, various years, Tables HF-10A and HF-10.
Revenue Trend Details
Federal Motor-Fuel and Vehicle Taxes: The $7.5-billion increase in motor-fuel and vehicle-tax revenue for highways from 2010 to 2012 was largely driven by a $5.4-billion increase at the Federal level. Between these 2 years, gross revenues from all categories of receipts for the Highway Account of the Highway Trust Fund increased: gasoline tax revenue by 2.8 percent , diesel and special motor-fuel tax revenue by percent ,tire tax revenue by 32.0 percent , truck and trailers tax revenue by 146.8 percent , and use tax revenue by 93.9 percentState Motor-Fuel Tax: State motor-fuel tax revenue from 2002 to 2012 increased about 18 percent , from $27.8 billion to $32.8 billion. This increase occurred every year except from 2007 to 2008, when it decreased 14 percent from $34.8 billion to $29.9 billion and from 2009 to 2010, when it decreased 1 percent . The first, larger reduction in revenue appears to have come in the midst of the decade's second recession. This reduction is the case for many of the revenue sources discussed.
Toll Revenue: Although imposing tolls is not a new idea, States are revisiting their use due in part to technological advances that make toll deployment and operation easier. About 29 States have some type of toll road covering about 5,100 miles of road (FHWA, Toll Facilities in the United States, 2013).
State General Funds: Another source of revenue is money taken from State General Funds, which increased 43 percent from $4.7 billion in 2002 to $6.7 billion in 2012. States received a respite from using General Funds with the passage of the American Recovery and Reinvestment Act starting in Fiscal Year 2010. Since its passage, States have received about $39 billion in total transportation assistance, with about $26 billion going toward highway infrastructure (www.recovery.gov).
Local General Funds: After State motor-fuel and vehicle taxes, local General Funds are the next largest source of non-Federal highway transportation dollars for the States. Local governments-including counties, townships and municipalities-provide about 30 percent of total surface transportation funding (National Conference of State Legislatures, Transportation Governance and Finance, 2011).
Highway Expenditures
Highway expenditures by all levels of government combined totaled $221.3 billion in 2012, as shown in Exhibit 6-1. Exhibit 6-6 breaks down the Federal, State, and local expenditures by type. The rows "Funding Sources for Capital Outlay" and "Funding Sources for Total Expenditures" indicate the level of government that provided the funding for those expenditures. These expenditures represent cash outlays, not authorizations or obligations of funds. (The terms "expenditures," "spending," and "outlays" are used interchangeably in this report).
Even though the Federal government funded $47.4 billion of highway expenditures in 2012, direct Federal spending on capital outlay, maintenance, administration, and research was only $3.2 billion (1.5 percent of all highway expenditures). The remaining $44.2 billion was in the form of transfers to State and local governments.
State governments combined $43.4 billion of Federal funds, $86.2 billion of State funds, and $3.0 billion of local funds to support direct expenditures of $132.6 billion (59.9 percent of all highway expenditures). Local governments directly spent $0.8 billion of Federal funds, $19.6 billion of State funds, and $65.0 billion of local funds on highways, totaling $85.4 billion (38.6 percent of all highway expenditures).
Types of Highway Expenditures
Definitions for selected expenditure category types referenced in this section are as follows:
- Capital outlay: highway improvements such as land acquisition and other right-of-way costs; preliminary and construction engineering; new construction, reconstruction, resurfacing, rehabilitation, and restoration; and installation of guardrails, fencing, signs, and signals.
- Maintenance: routine and regular expenditures required to keep the highway surface, shoulders, roadsides, structures, and traffic control devices in usable condition. These efforts include completing spot patching and crack sealing of roadways and bridge decks and maintaining and repairing highway utilities and safety devices, such as route markers, signs, guardrails, fence, signals, and highway lighting.
- Highway and traffic services: activities designed to improve the operation and appearance of the roadway, including items such as the operation of traffic control systems, snow and ice removal, highway beautification, litter pickup, mowing, toll collection, and air quality monitoring.
- Current expenditures: all highway expenditures except for bond retirement.
- Noncapital expenditures: all current expenditures except for capital outlay. (Includes interest payments on bonds).
As shown in Exhibit 6-6, $105.2 billion, or 47.5 percent , of spending by all levels of government on highways in 2012, was for capital outlays. Additional information on types of capital outlay and the distribution of capital outlay by type of highway facility is presented later in this chapter. Combined spending on maintenance and traffic services of $48.0 billion represented 21.7 percent on total highway expenditures.
Most Federal funding for highways is for capital outlay rather than noncapital expenditures, which State and local governments primarily fund. The Federal government funded 43.1 percent of capital outlay in 2012, but only 21.4 percent of total highway expenditures.
In terms of direct highway expenditures by expending agency, State expenditures represent a majority of total spending for most expenditure types. The exception is in the maintenance category; local governments spent $19.5 billion on maintenance in 2012, which is 53.9 percent of total maintenance spending by all levels of government combined. Local governments also spent $8.6 billion on highway patrol and safety expenditures, representing 48.3 percent of combined spending on these activities by all levels of government.
Historical Expenditure and Funding Trends
Exhibit 6-7 breaks out expenditures since 2002 by type. The largest percentage increases are related to debt service, as bond retirement expenditures grew at an average annual rate of 12.8 percent from 2002 to 2012, while interest on debt grew an average annual rate of 7.9 percent. Total highway expenditures grew by 5.0 percent per year over this period in nominal dollar terms, while capital outlay rose at an average annual rate of 4.4 percent with capital expenditures becoming a smaller share of total expenditures.
Exhibit 6-8 shows that Federal funding for highways grew more slowly from 2002 to 2012 than did State or local funding. The Federal portion of total highway expenditures declined from 24.1 percent to 21.4 percent over this period, while the federally funded share of highway capital outlay declined from 46.1 percent to 43.1 percent.
The Federal expenditure figures for 2010 include $11.9 billion funded by the Recovery Act. By 2012, this figure had dropped to $3.0 billion as most Recovery Act projects had been completed. Federally funded highway expenditures grew by $1.3 billion from 2010 to 2012 (from $46.1 billion to $47.4 billion), indicating that cash-basis expenditures funded from other Federal sources increased by more than the decline in Recovery Act-funded expenditures over this period.
State funding for highways increased from $98.7 billion in 2010 to $105.8 billion in 2012. The 7.2 percent average annual increase in local government funding exceeded the growth rates for both Federal and State funding.
Constant Dollar Expenditures
The federally funded share of highway capital outlay exceeded 50 percent each year from 1976 to 1986. Since then, this share has typically varied from 41 to 46 percent. In 1998, 1999, and 2007, however, it fell below 40 percent .
Over the 10-year period from 2003 through 2012, the average of the federally funded shares for each year was 43.1 percent . This average matches the federally funded share in 2012.
The types of inputs of materials and labor associated with various types of highway expenditures significantly differ; for example, on a dollar-per-dollar basis, highway maintenance activities are generally more labor intensive than highway construction activities. This report uses different indices for converting nominal dollar highway spending to constant dollars for capital and noncapital expenditures. For constant-dollar conversions for highway capital expenditures, the Federal Highway Administration (FHWA) Composite Bid Price Index is used through 2006, the last year for which this index was produced. Capital expenditure conversions for subsequent years rely on a successor index, the FHWA National Highway Construction Cost Index. Constant-dollar conversions for other types of highway expenditures are based on the Bureau of Labor Statistics' Consumer Price Index.
Exhibit 6-9 illustrates the trends in cost indices used in the report, converted to a common base year of 2002. Over the 10-year period from 2002 to 2012, the Consumer Price Index increased by 27.6 percent, similar to the 25.0-percent rise in the combination of the Bid Price Index and Construction Cost Index. Within this 10-year period, however, the indices differed significantly;
Exhibit 6-9 Comparison of Inflation Indices (Converted to a 2002 Base Year), 2002—20121
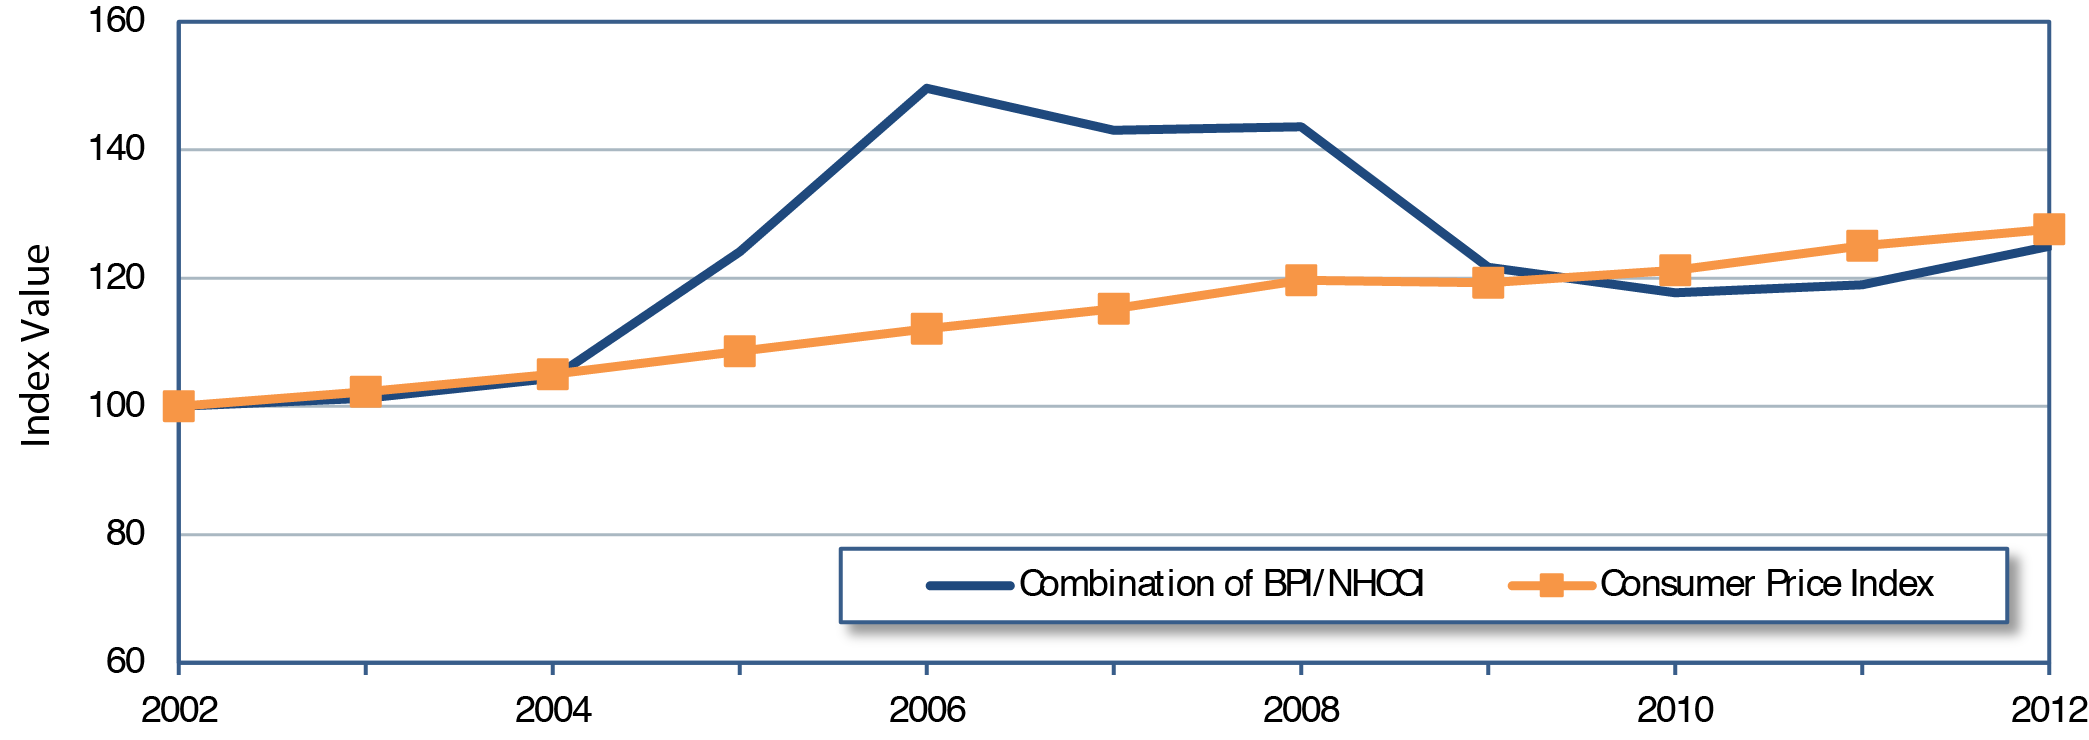
1In order to facilitate comparisons of trends, each index was mathematically converted so that its value for the year 2002 would be equal to 100.
Sources: FHWA Highway Statistics, various years, Table PT-1; http://www.bls.gov/cpi/
for example, in the period between 2004 and 2006, sharp increases in the prices of materials such as steel, asphalt, and cement caused the Bid Price Index to increase by 43.3 percent , compared with a 6.7-percent increase in the Consumer Price Index. Although highway construction prices as measured by the Bid Price Index and the Construction Cost Index subsequently declined, the purchasing power of highway capital spending in 2006—2008 was significantly less than in 2009—2012. In other words, each dollar of highway capital outlay from 2009 to 2012 had the potential to have a bigger impact on system performance than was the case for each dollar spent from 2006 to 2008.
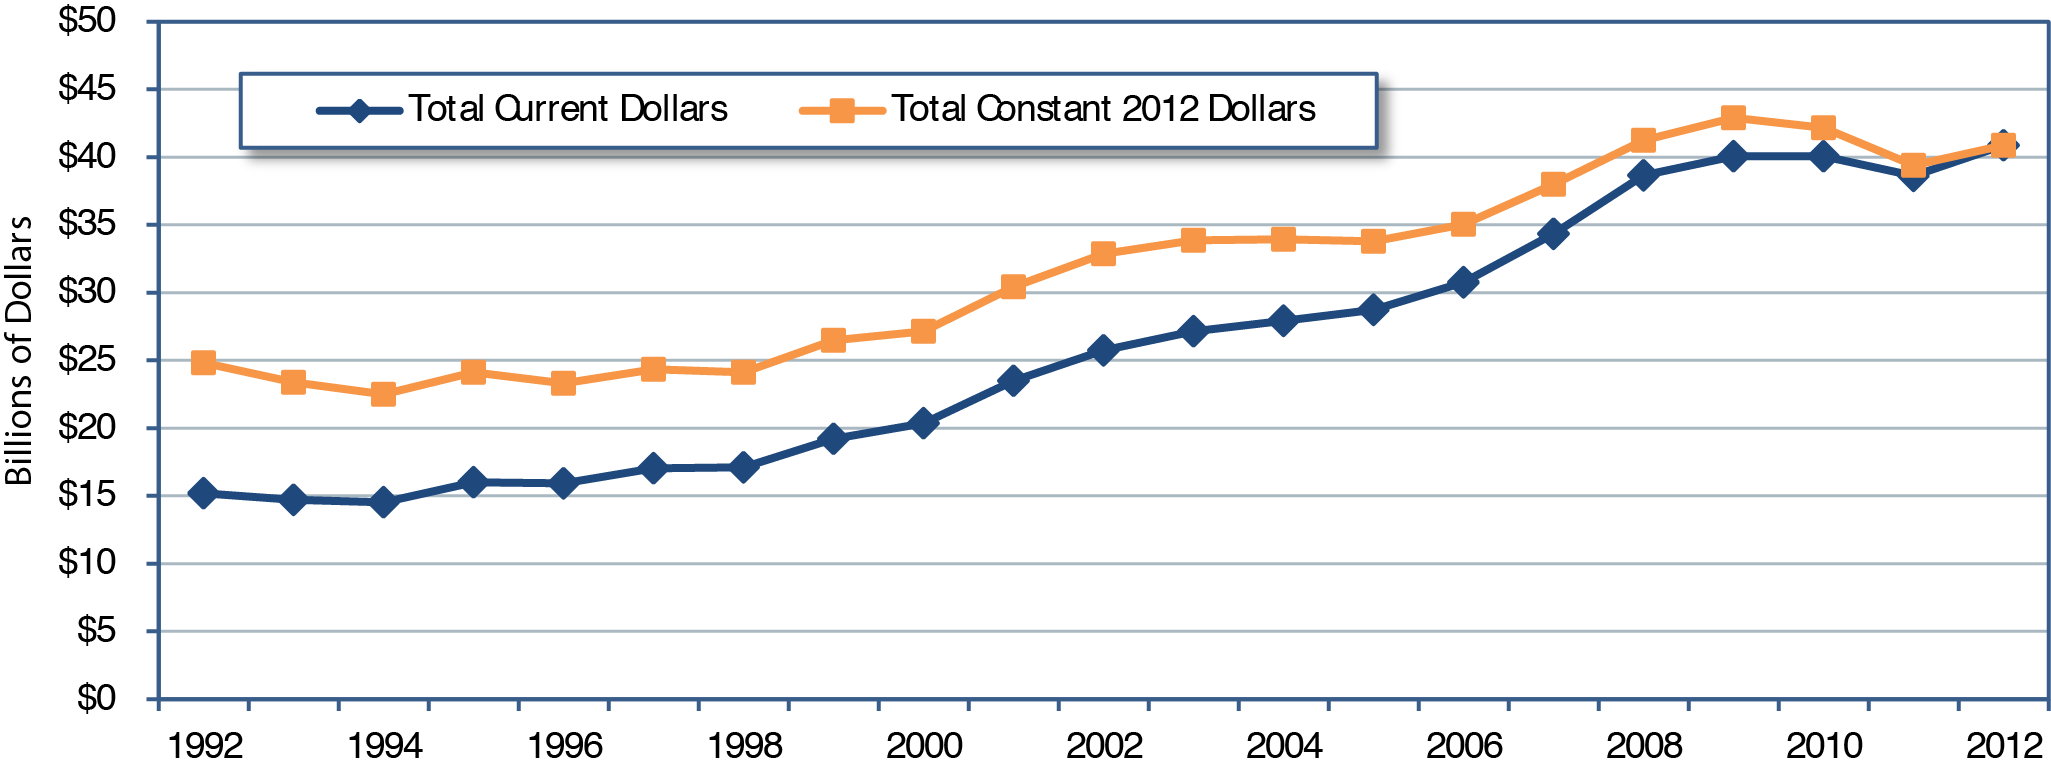
Exhibits 6-10 and 6-11 display time-series data on highway expenditures in both current (nominal) and constant (real) 2012 dollars. Although constant dollars for total highway expenditures have decreased periodically, they reached an all-time high in 2012. The same was not true for highway capital expenditures, which reached an all-time high in 2011, but dipped slightly in 2012.
Exhibit 6-10 Highway Capital, Noncapital, and Total Expenditures in Current and Constant 2012 Dollars, All Units of Government, 1992—20121
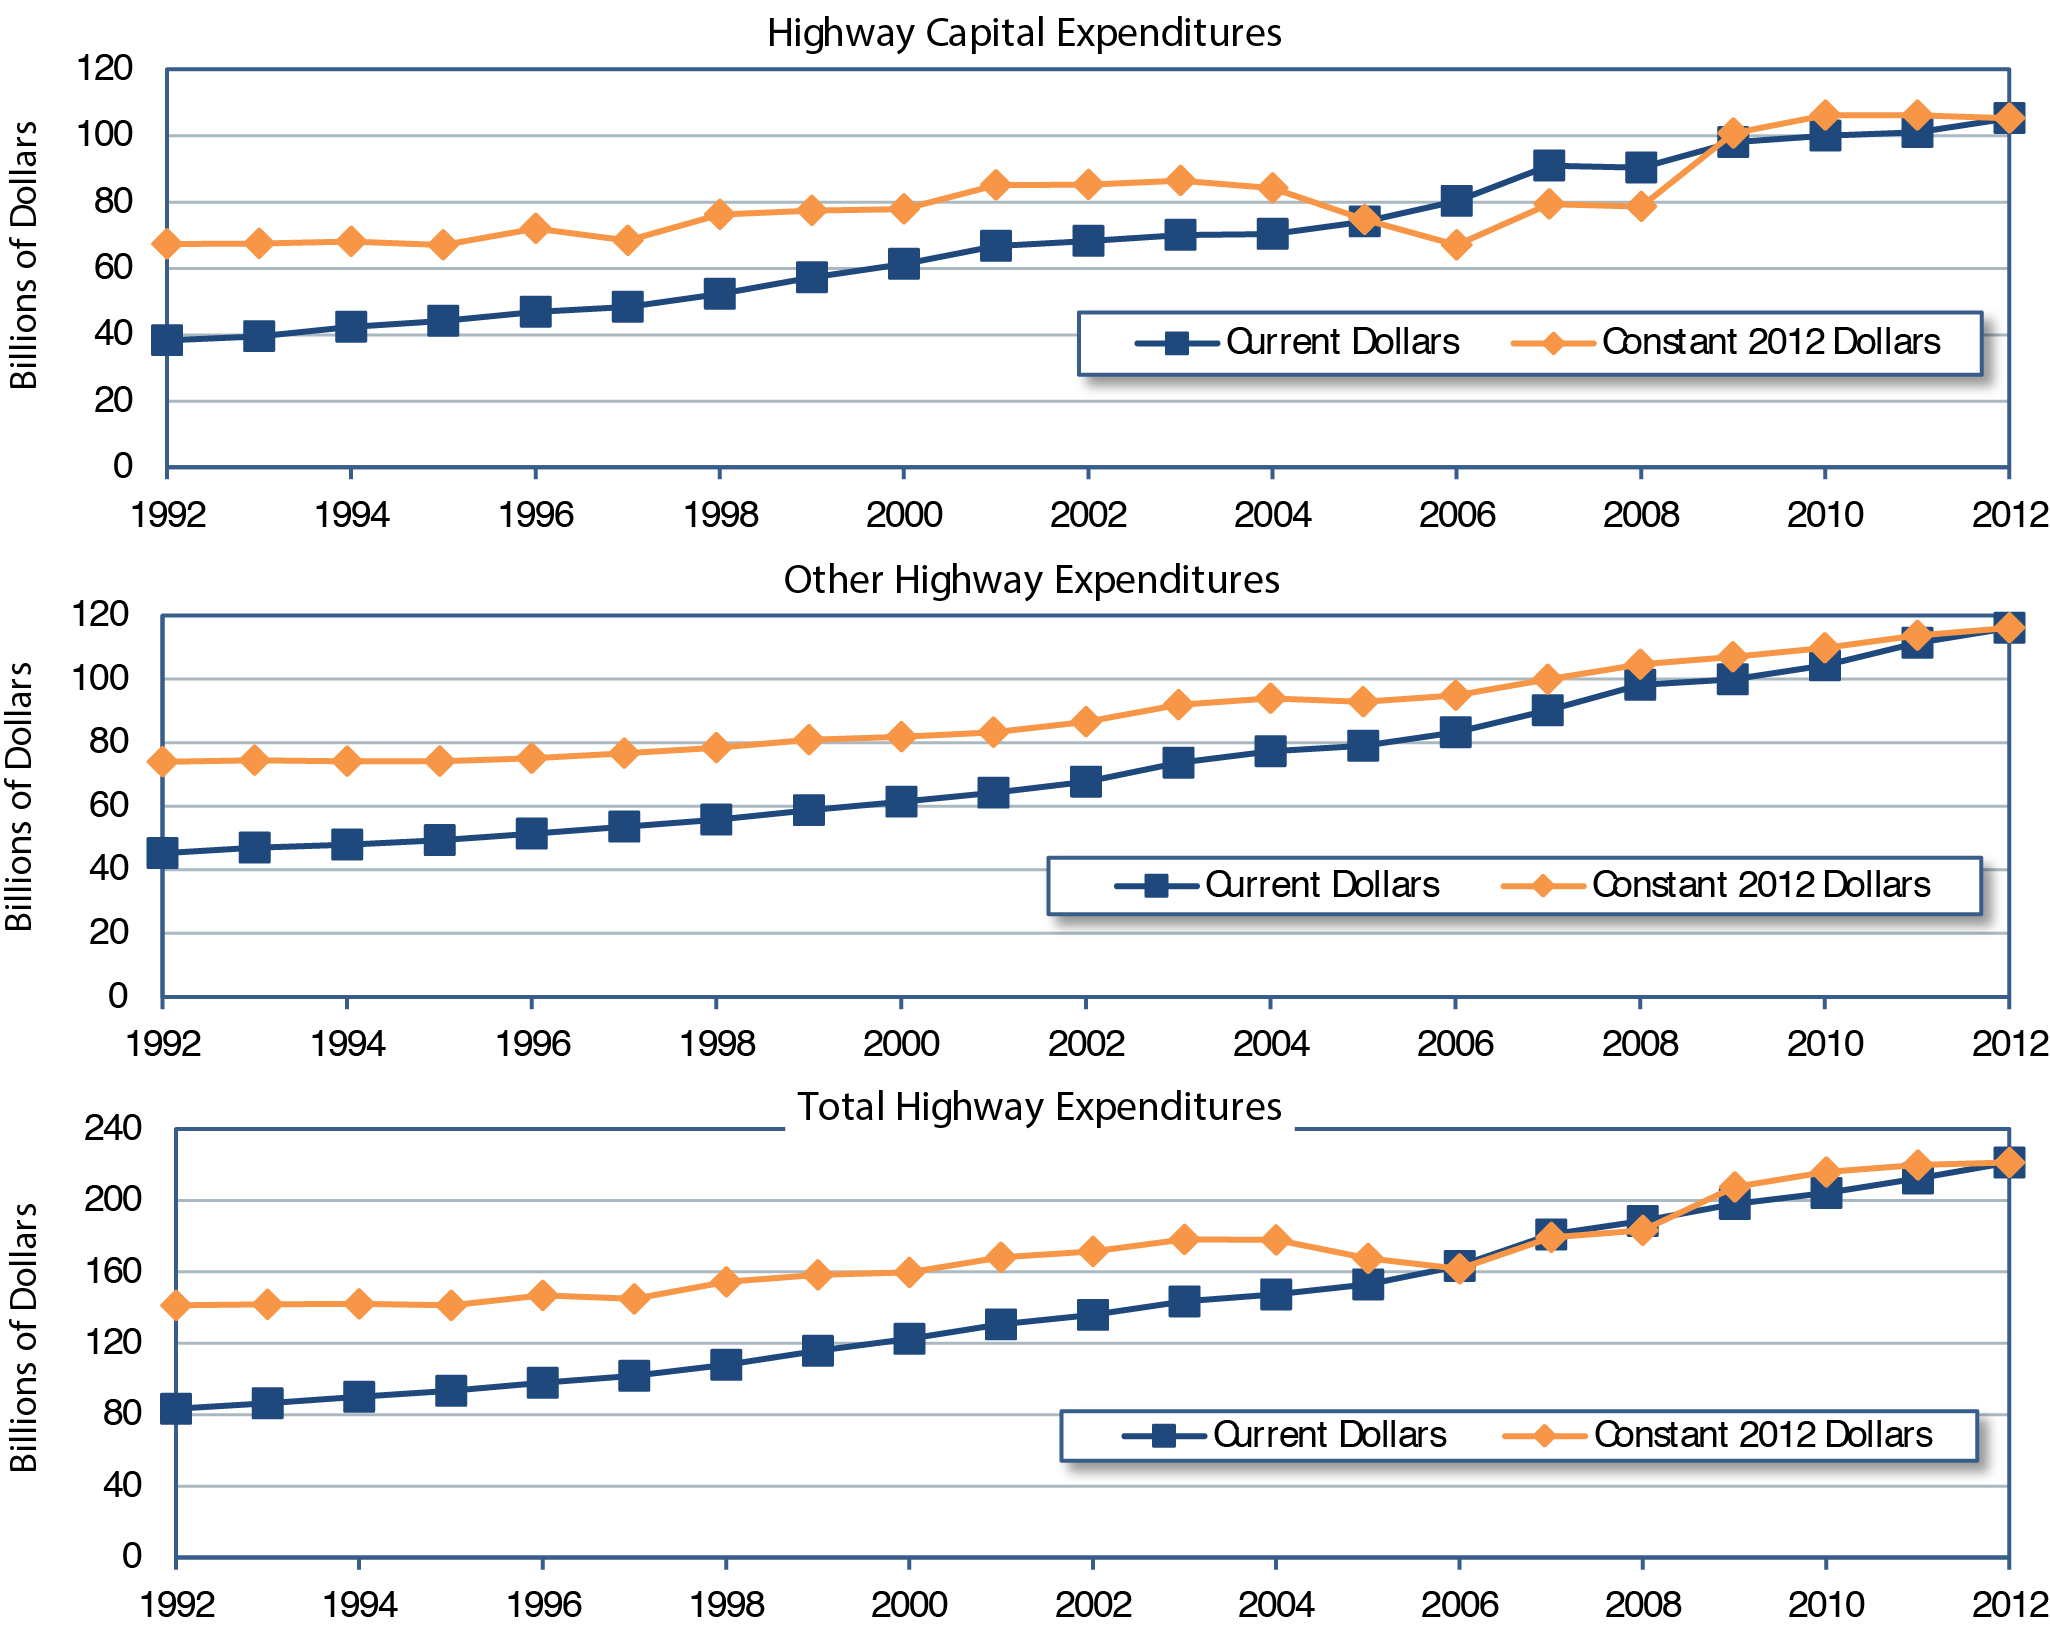
1 Constant dollar conversions for highway capital expenditures were made using the FHWA BPI through the year 2006 and the FHWA NHCCI in subsequent years. Constant dollar conversions for other types of highway spending were made using the Bureau of Labor Statistics CPI.
Sources: Highway Statistics, various years, Tables HF-10A, HF-10, PT-1; http://www.bls.gov/cpi/.
For the 10-year period ending in 2012, highway capital spending increased at an average annual rate of 2.1 percent in constant-dollar terms, slightly below the 2.6-percent annual constant-dollar growth rate for total highway expenditures. From 2002 to 2012, federally funded highway expenditures increased at an average annual rate of 1.4 percent in constant-dollar terms; State and local constant-dollar expenditures grew much faster, rising by 2.9 percent per year on average.
The relative trends differ over the 20 years from 1992 to 2012. Over this period, highway capital expenditures and total highway expenditures both grew by 2.3 percent in constant-dollar terms. Federally funded highway capital spending increased by 2.4 percent annually in constant-dollar terms, increasing more quickly than combined State and local constant-dollar expenditures, which grew by only 2.2 percent per year.
Exhibit 6-11 Highway Expenditures Funded by Federal and Non-Federal Sources in Current and Constant 2012 Dollars, 1992—20121
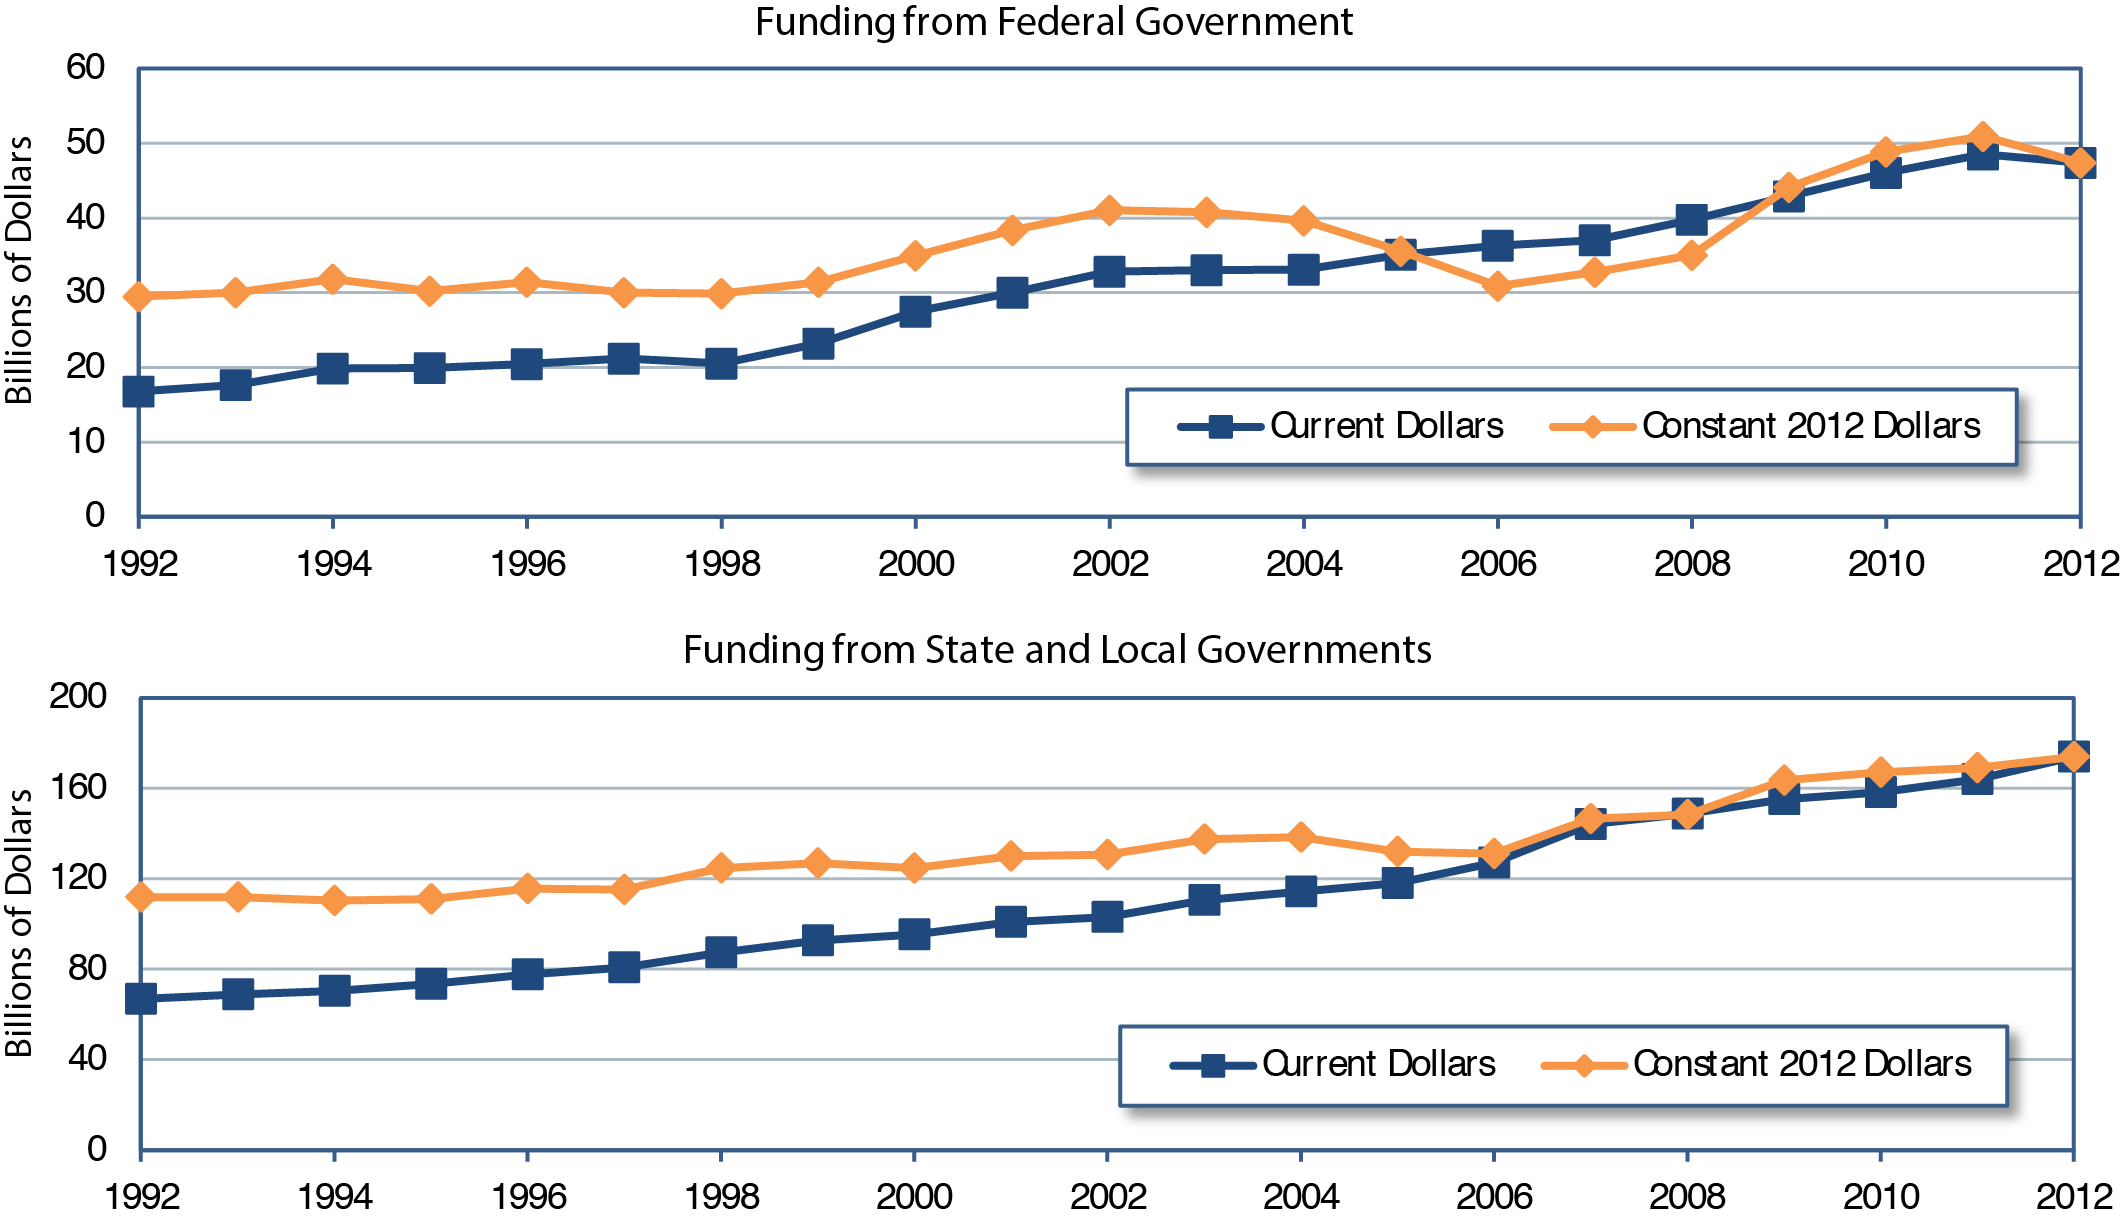
1Constant dollar conversions for highway capital expenditures were made using the FHWA BPI through the year 2006 and the FHWA NHCCI in subsequent years. Constant dollar conversions for other types of highway spending were made using the Bureau of Labor Statistics CPI.
Sources: Highway Statistics, various years, Tables HF-10A, HF-10, PT-1; http://www.bls.gov/cpi/.
The impact of the relatively high construction costs in 2006 to 2008 noted above in reference to Exhibit 6-9 is evident in Exhibits 6-10 and 6-11, as the constant-dollar lines dip below the current dollar line in several of the line charts for those years. The difference is most pronounced in the highway capital expenditures chart in Exhibit 6-10 and the funding from Federal government chart in Exhibit 6-11, as most Federal funds are used to support highway capital expenditures.
Highway Capital Outlay
States provide FHWA with detailed data on what they spend on arterials and collectors, classifying capital outlay on each functional system into 17 improvement types. Direct State expenditures on arterials and collectors totaled $65.8 billion in 2012, drawing on a combination of State revenues, transfers from the Federal government, and transfers from local governments. Exhibit 6-12 illustrates the distribution of these expenditures by improvement type and shows how these
improvement types have been allocated among three broad categories: system rehabilitation, system expansion, and system enhancement. These broad categories are also used in Chapter 7 to discuss the components of future capital investment scenarios. These categories are defined as follows:
- System rehabilitation: capital improvements on existing roads and bridges intended to preserve the existing pavement and bridge infrastructure. These activities include reconstruction, resurfacing, pavement restoration or rehabilitation, widening of narrow lanes or shoulders, bridge replacement, and bridge rehabilitation. Also included is the portion of widening (lane addition) projects estimated for reconstructing or improving existing lanes. System rehabilitation does not include routine maintenance costs.
- System expansion: construction of new roads and new bridges and addition of new lanes to existing roads. Expansion includes all new construction, new bridge, and major widening, and most of the costs associated with reconstruction-added capacity, except for the portion of these expenditures estimated for improving existing lanes of a facility.
- System enhancement: safety enhancements, traffic operation improvements such as the installation of intelligent transportation systems, and environmental enhancements.
Exhibit 6-12 presents an estimated distribution of total highway capital outlay by all levels of government on all roads. Of the $105.2 billion in total highway capital outlay, an estimated $62.1 billion (59.0 percent ) was used for system rehabilitation, $27.2 billion (25.9 percent ) was used for system expansion, and $15.9 billion (15.1 percent ) was used for system enhancement. These estimates are based primarily on State expenditure patterns on arterials and collectors, along with limited data from other sources. As shown in Exhibit 6-12, most types of highway capital improvement reported by States are assigned to one of these three broad categories; however, engineering is split among the three categories and reconstruction-added capacity is divided between system rehabilitation and system expansion.
Exhibit 6-13 shows the distribution of capital expenditures by type and functional system. In 2012, $30.1 billion was invested on rural arterials and collectors, with 64.5 percent directed to system rehabilitation and 25.3 percent to expansion; the remainder was directed to system enhancement. Capital outlays on urban arterials and collectors were $50.9 billion, of which 56.0 percent was for system rehabilitation and 30.6 percent was for system expansion. Among the individual functional systems, rural major collectors had the highest percentage of highway capital outlay directed to system rehabilitation (72.8 percent ), while urban other freeways and expressways had the lowest percentage directed for that purpose (45.2 percent ).
Exhibit 6-13 Distribution of Capital Outlay by Improvement Type and Functional System, 2012
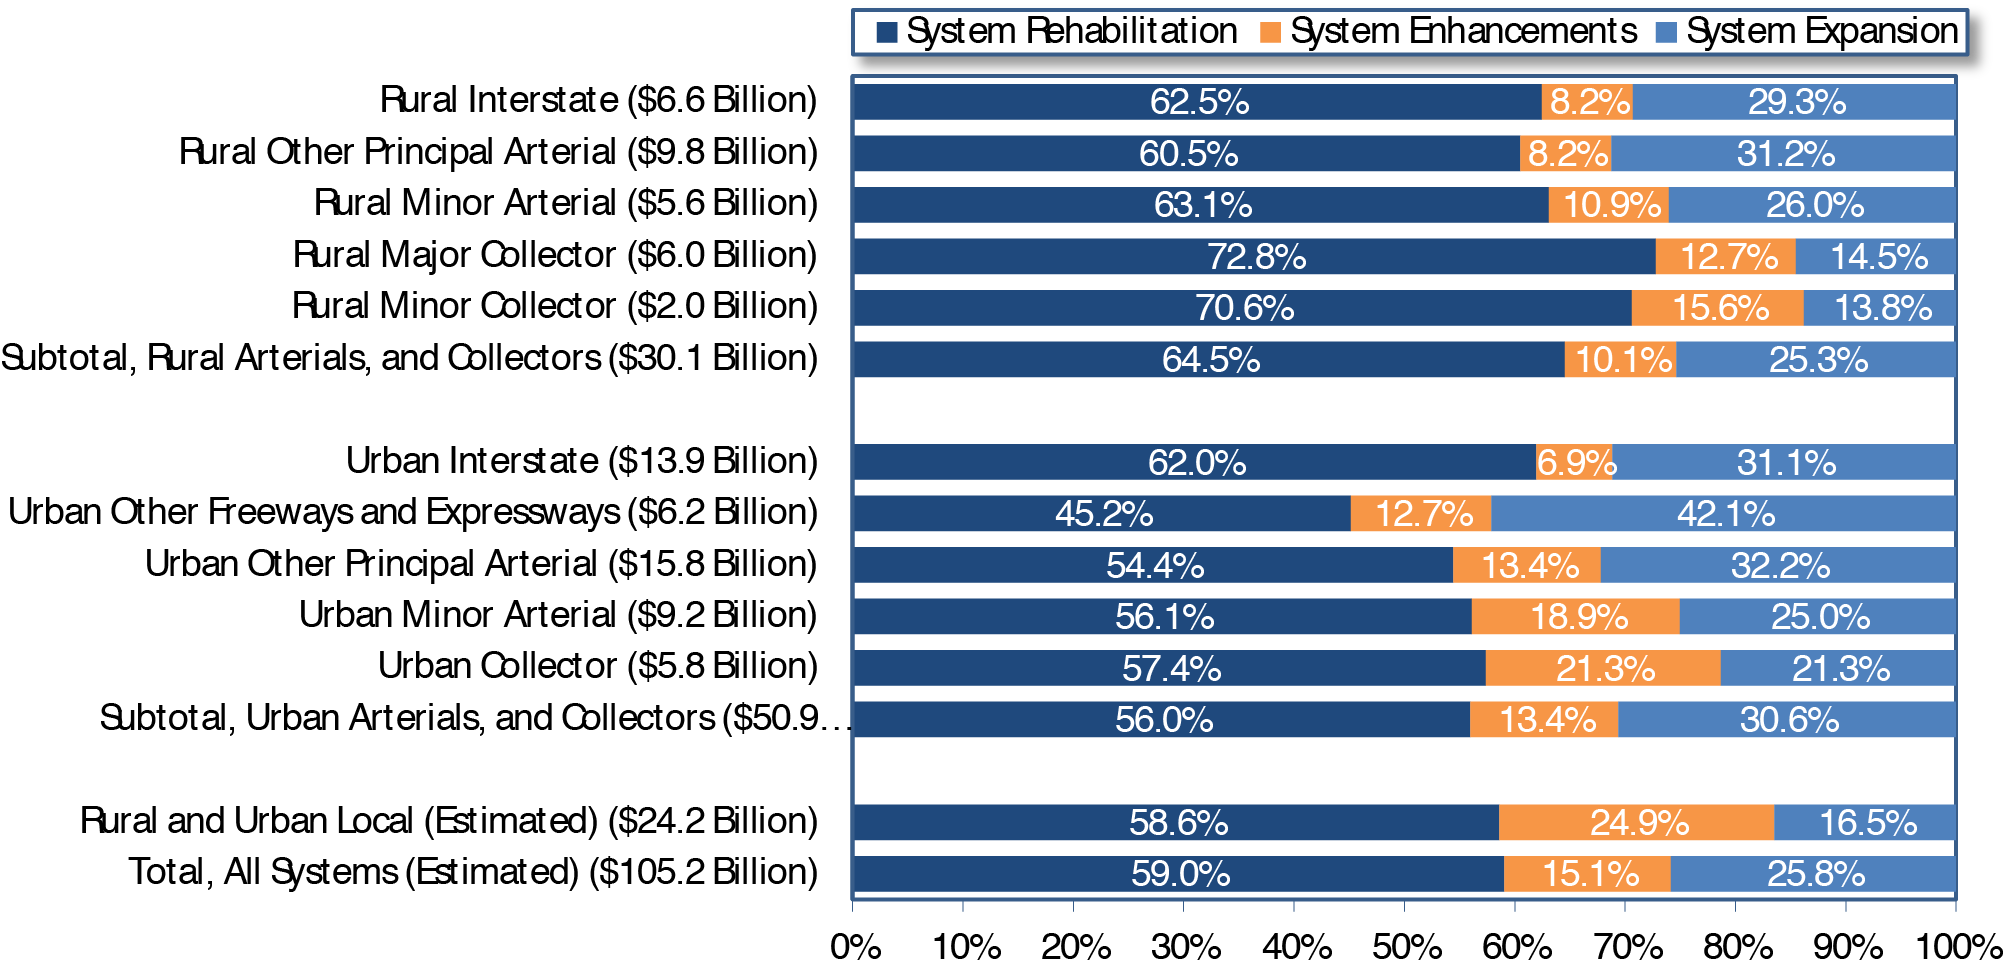
Sources: Highway Statistics 2012, Table SF-12A, and unpublished FHWA data.
Exhibit 6-14, shows trends in capital outlays by improvement type from 2002 to 2012. Each year, a majority of capital outlays was directed to rehabilitation, reflecting the need to preserve the aging system. The share of total capital spending for system rehabilitation, however, rose dramatically between 2008 and 2010, from 51.1 percent to 60.5 percent. System rehabilitation expenditures increased from $46.2 billion to $60.5 billion, nearly 31 percent over the 2 years. This dramatic increase was partly driven by the Recovery Act; one of the Recovery Act's stated goals is to support jobs through construction expenditures, an aim best achieved by selecting projects that could be initiated and completed relatively quickly. This strategy led many States to direct a larger portion of their Recovery Act funding toward pavement improvement projects than they usually finance from regular Federal-aid funds in a typical year. Although most Recovery Act-funded projects had been completed before 2012, the overall share of highway capital spending directed to system preservation declined to just 59.0 percent , somewhat below the share in 2010, but still well above the share in 2008. This finding suggests that the shift toward system preservation beginning in 2008 could have been driven by factors in addition to the Recovery Act, and thus might represent the start of a long-term trend.
From 2002 to 2012, system rehabilitation expenditures grew at an average annual rate of 5.6 percent. System expansion expenditures have increased more slowly-at an average annual rate of 1.1 percent. This slower expansion growth resulted in a decline in share of total capital outlays from 35.8 percent in 2002 to 25.8 percent in 2012. System enhancement expenditures have grown more quickly, rising from 11.1 percent of total capital outlays in 2002 to 15.1 percent in 2012.
Total capital outlay by all levels of government grew at an average annual rate of 2.1 percent from 2002 to 2012 in constant-dollar terms. Constant-dollar system rehabilitation expenditures rose by 3.2 percent per year over this period, while system expansion expenditures declined by 1.2 percent annually when adjusted for inflation. Expenditures for system enhancements grew by 5.3 percent per year in constant-dollar terms from 2002 to 2012.
Capital Outlays on Federal-Aid Highways
As discussed in Chapter 2, "Federal-aid highways" includes all roads except those in functional classes that are generally ineligible for federal funding: rural minor, rural local, or urban local. Exhibit 6-15 shows that total capital outlays on Federal-aid highways increased at an average annual rate of 3.9 percent from 2002 to 2012, rising to $79.0 billion in 2012.
The share of capital outlay on Federal-aid highways directed to system rehabilitation in 2012 was 58.9 percent , just below the comparable percentage for all roads of 59.0 percent . This pattern is consistent with that from 2002 to 2010 as well; in each year, the portion of Federal-aid highway capital outlay directed toward system rehabilitation and system enhancements was lower than the comparable shares for all roads, whereas the portion directed toward system expansion was higher than for all roads.
Capital Outlays on the National Highway System
The National Highway System (NHS) comprises roads essential to the Nation's economy, defense, and mobility, as described in Chapter 2. Exhibit 6-16 shows that capital outlays for the NHS amounted to $44.6 billion in 2012, having grown at an average annual rate of 3.2 percent since 2002.
Between 2010 and 2012, system rehabilitation expenditures on the NHS declined from $27.3 billion to $26.4 billion, whereas system rehabilitation for all roads and for Federal-aid highways increased. Over the 10-year period beginning in 2002, system rehabilitation spending grew at an average annual rate of 5.7 percent , faster than the comparable growth rates for all roads (5.6 percent) or for Federal-aid highways (5.2 percent ). System expansion expenditures on the NHS grew from $13.7 billion in 2010 to $14.1 billion in 2012, although from 2002 to 2012, NHS system expansion expenditures declined.
Capital Outlays on the Interstate System
Exhibit 6-17 shows that from 2010 to 2012, capital outlay increased by only 1.4 percent on the Interstate System, to $20.5 billion, well below the 5.2-percent increase observed for all roads. This increase is also much lower than the average annual increase in capital outlay for the Interstate System of 3.0 percent observed from 2002 and 2012.
The share of Interstate capital outlay directed to system rehabilitation in 2012 was 52.1 percent, higher than the comparable percentages for the NHS, Federal-aid highways, and all roads. This pattern is largely consistent with that from 2002 to 2010; the share of Interstate capital outlay directed to system rehabilitation was higher in each year from 2002 to 2010 than comparable percentages for the NHS or Federal-aid highways, although in some years it was lower than the comparable percentage for all roads. The share of Interstate capital outlay directed toward system enhancements was lower in each year from 2002 to 2012 than comparable percentages for all roads.
Project Finance
In recent years, State and local transportation agencies have adopted new ways of financing and delivering transportation projects. In the face of stagnating public revenues and demanding fiscal requirements, many jurisdictions are relying on innovative options such as public-private partnerships, Federal credit assistance, and other debt-financing tools. These strategies could enable financially strapped public agencies to deliver costly and complex infrastructure projects much earlier than would be possible through traditional mechanisms.
Public-Private Partnerships
Public-Private Partnerships (P3s) are contractual agreements between a public agency and a private entity that allow for greater private-sector participation in the delivery and financing of transportation projects. Typically, this participation involves the private sector's assuming additional project risks, such as design, finance, long-term operation, maintenance, or traffic and revenue. P3s are undertaken for a variety of purposes, including monetizing the value of existing assets, developing new transportation facilities, or rehabilitating or expanding existing facilities. Although P3s offer certain advantages, such as increased financing capacity and reduced upfront costs, the public sector still must identify a source of revenue for the project to provide a return to the private partner's investment and must ensure that the goals and interests of the public are adequately secured. Additional information on P3s is available at http://www.fhwa.dot.gov/ipd/p3/index.htm.
Public-Private Partnership Project: 1-95 HOV/HOT Lanes
The I-95 Express Lanes are the second major step in creating a regional network of tolled managed lanes in Northern Virginia. The project consists of the development, design, finance, construction, maintenance, and operation of 29.4 miles of high occupancy vehicle (HOV)/high occupancy toll (HOT) lanes along the I-95 and I395 corridor in Northern Virginia.
The project was divided into four segments:
- 8.3 miles of new construction — two-lane reversible (includes 7 new bridges),
- 7.0 miles of two-lane HOV conversion — two-lane reversible,
- 11.9 miles of two-lane HOV conversion — three-lane reversible, and
- 2.2 miles of two-lane HOV conversion — three-lane reversible (including connection to 495 Express Lanes at the Springfield Interchange).
The $922.6-million project was financed primarily through a Transportation Infrastructure and Finance Innovation Act loan, private activity bonds, and private equity. The concession agreement was finalized in 2012 between the Virginia Department of Transportation and 95 Express Lanes LLC, and the facility opened to traffic in late 2014.
Federal Credit Assistance
Federal credit assistance for highway improvements can take one of two forms: (1) loans, where project sponsors borrow Federal highway funds directly from a State DOT or the Federal government; and (2) credit enhancements, where a State DOT or the Federal government makes Federal funds available on a contingent (or standby) basis. Loans can provide the capital necessary to proceed with a project and reduce the amount of capital borrowed from other sources. Credit enhancement helps reduce risk to investors and thus allows project sponsors to borrow at lower interest rates. Loans also might serve a credit enhancement function by reducing the risk borne by other investors. Federal tools currently available to project sponsors include the Transportation Infrastructure and Finance Innovation Act (TIFIA) program, State Infrastructure Bank programs, and Section 129 loans.
The TIFIA Credit Program provides Federal credit assistance in the form of direct loans, loan guarantees, and standby lines of credit to finance surface transportation projects of national and regional significance. A TIFIA project must pledge repayment in whole or in part with dedicated revenue sources, such as tolls, user fees, special assessments (taxes), or other non-Federal sources. State Infrastructure Banks are State-run revolving funds that provide loans, credit enhancements, and other forms of nongrant assistance to surface transportation projects. State Infrastructure Banks can be capitalized with regularly apportioned Federal-aid funds. Section 129 loans allow States to lend apportioned Federal-aid highway funds to toll and nontoll projects generating dedicated revenue streams. Additional information on credit assistance tools is available at http://www.fhwa.dot.gov/ipd/finance/tools_programs/federal_credit_assistance/index.htm.
Debt Financing Tools
Some transportation projects are so large that their cost exceeds available current grant funding and tax receipts or would consume so much of these current funding sources as to delay many other planned projects. For this reason, State and local governments often seek financing for large projects through borrowing, which provides an immediate influx of cash to fund project construction costs. The borrower then retires the debt by making principal and interest payments over time. Tax-exempt municipal bonds, backed by future government revenues, are the most common method of borrowing by government agencies for transportation projects.
Two innovative debt instrument tools-GARVEES (Grant Anticipation Revenue Vehicles) and PABs (Private Activity Bonds) provide additional borrowing opportunities. A GARVEE is a debt-financing instrument-such as a bond, note, certificate, mortgage, lease, or other debt financing technique-that has a pledge of future Federal-aid funding. PABs are debt instruments issued by State or local governments on behalf of a private entity for highway and freight transfer projects, allowing a private project sponsor to benefit from the lower financing costs of tax-exempt municipal bonds. Additional information on Federal debt financing tools is available at http://www.fhwa.dot.gov/ipd/finance/tools_programs/federal_debt_financing/index.htm.
Washington State Route 520 Bridge
State Route (SR) 520 is one of two major east-west roadways crossing Lake Washington, located within the Seattle metropolitan area. It connects major population and employment centers between Seattle and the region's eastern suburbs.
The SR 520 Floating Bridge and Eastside plus West Approach Bridge Project included:
- Pontoon Construction Project — Construction of 33 bridge pontoons and a 55-acre site. Pontoon construction includes 21 longitudinal pontoons, 10 supplementary stability pontoons, and 2 cross pontoons;
- Floating Bridge and Landings Project — Construction of a new six-lane floating bridge across Lake Washington and removal of the existing floating bridge;
- Eastside Project — Widening of SR 520 and other corridor-wide improvements to complete a transit/high occupancy vehicle lane in each direction; and
- West Approach Bridge Project — Construction of a permanent west approach bridge structure to connect traffic from the bridge to an interchange on land and to complete the bicycle/pedestrian path from the east side to Seattle.
Financing for the bridge project included a $300-million Transportation Infrastructure and Finance Innovation Act loan and the use of $923 million from Grant Anticipation Revenue Vehicles.
Transit Finance
Transit funding comes from two major sources: public funds allocated by Federal, State, and local governments, and system-generated revenues earned from providing transit services. As shown in Exhibit 6-18, $58 billion was available for urban transit financing in 2012. Federal funding for transit includes fuel taxes dedicated to transit from the Mass Transit Account (MTA) of the Highway Trust Fund and undedicated taxes allocated from Federal general fund appropriations. State and local governments also provide funding for transit from their general fund appropriations and from fuel, income, sales, property, and other unspecified taxes, specific percentages of which can be dedicated to transit. These percentages vary considerably among taxing jurisdictions and by type of tax. Other public funds from toll revenues, general transportation funds, and other sources also might be used to fund transit. Passenger fares principally comprise system-generated revenues, although transit systems earn additional revenues from advertising and concessions, park-and-ride lots, investment income, and rental of excess property and equipment.
Transit Finance
In 2012, the amount of funding available for urban transit financing was $58 billion. Transit funding comes from two major sources: (1) public funds that Federal, State, and local governments allocate and (2) revenues that transit systems generate by providing transit services. Federal funding for transit includes fuel taxes dedicated to transit from the Mass Transit Account of the Highway Trust Fund and undedicated taxes allocated from Federal general fund appropriations. Fuel taxes accounted for 77.3 percent of all Fund revenues for Fiscal Year 2012, which is similar to the share reported in the National Transit Database (80 percent ). State and local governments also provide funding for transit from their general fund appropriations and from fuel, income, sales, property, and other unspecified taxes, specific percentages of which can be dedicated to transit. The percentages vary considerably among taxing jurisdictions and by type of tax. Other public funds from sources such as tolls and general transportation funds also can be used to fund transit. Passenger fares principally comprise system-generated revenues, although transit systems derive additional revenues from advertising and concessions, park-and-ride lots, investment income, and rental of excess property and equipment.
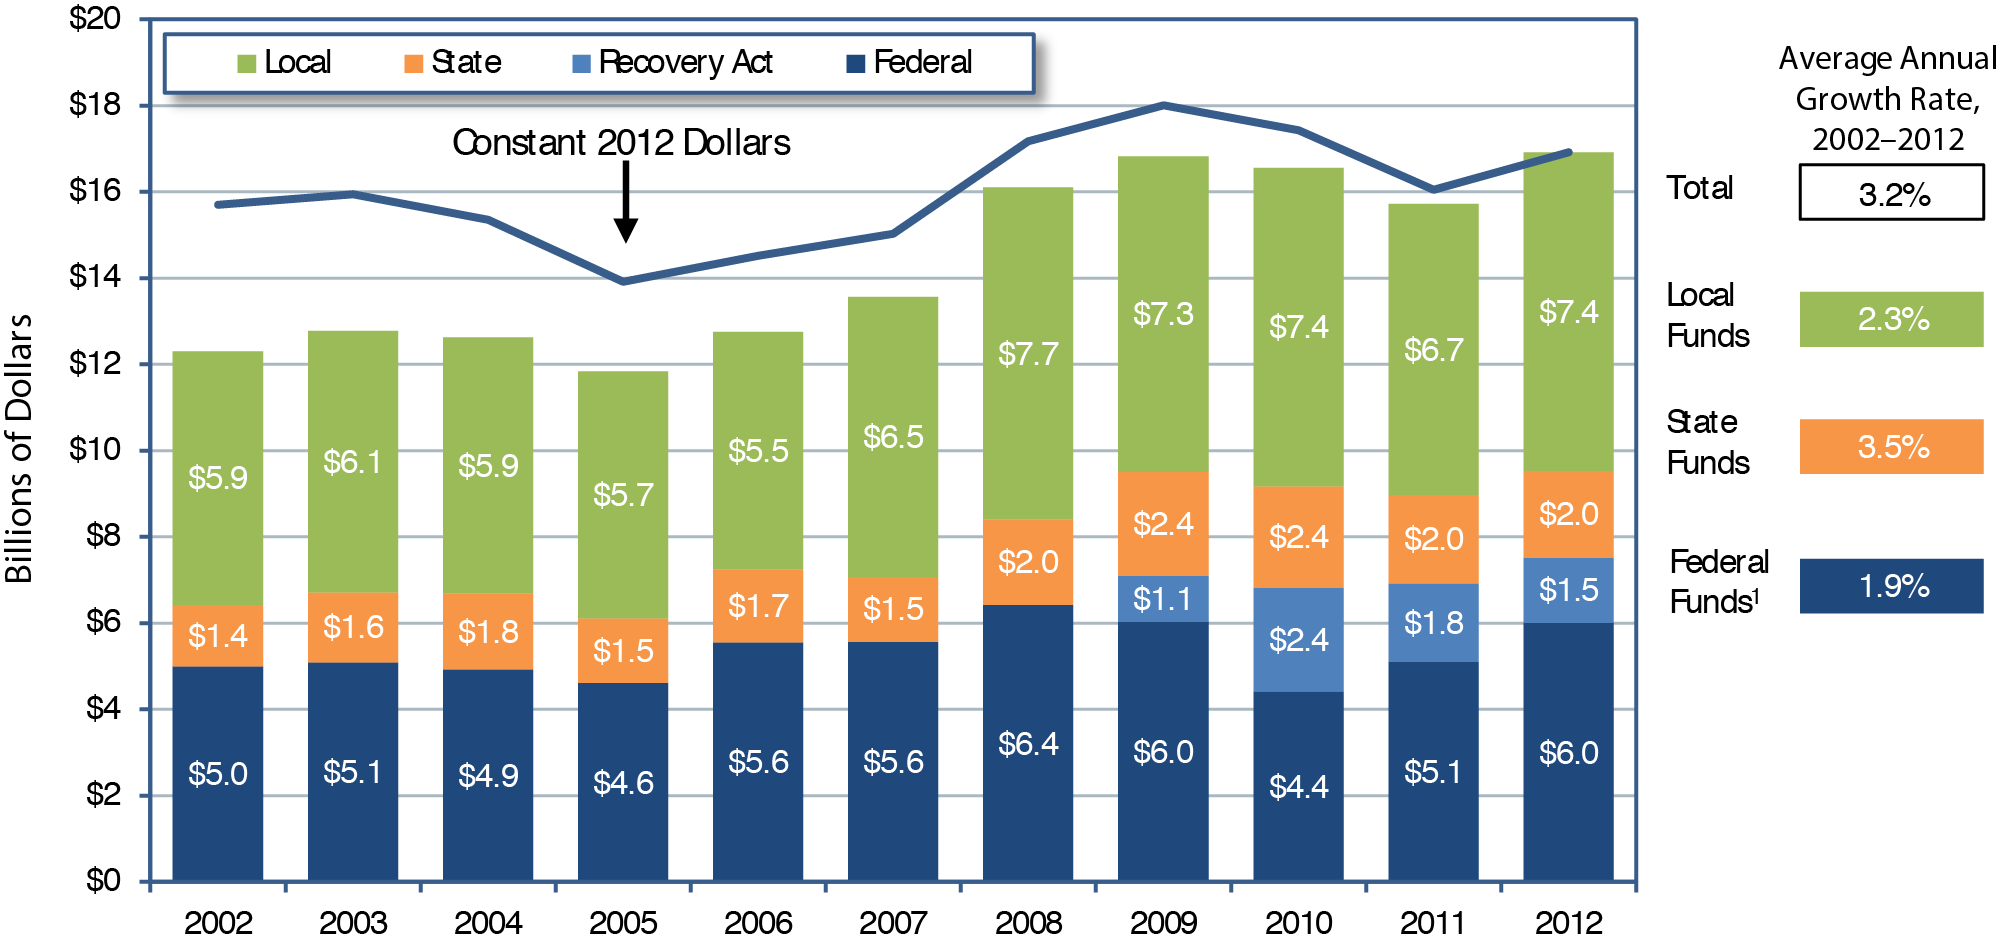
Level and Composition of Transit Funding
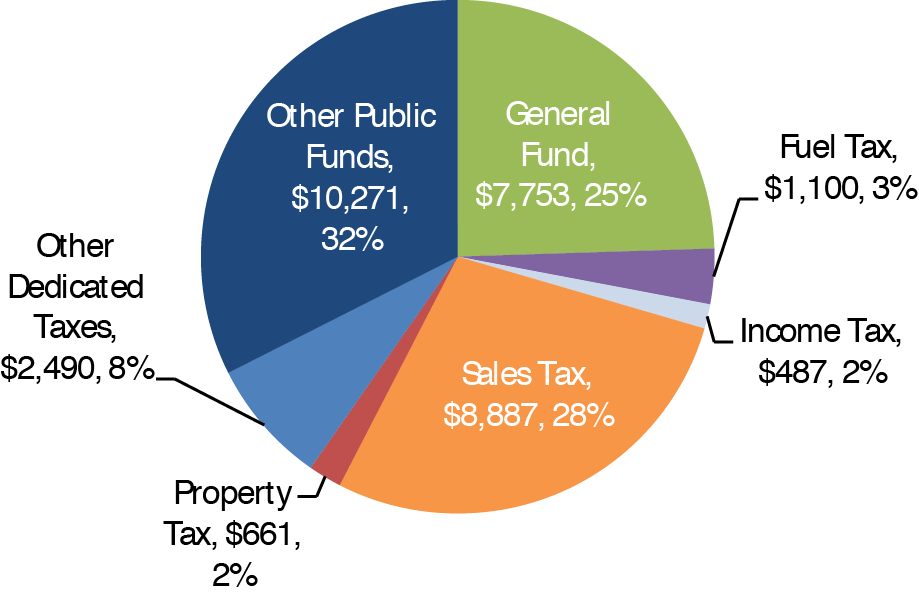
Exhibit 6-19 2012 Urban Transit Revenue Sources (Billions of Dollars)
Source: National Transit Database.
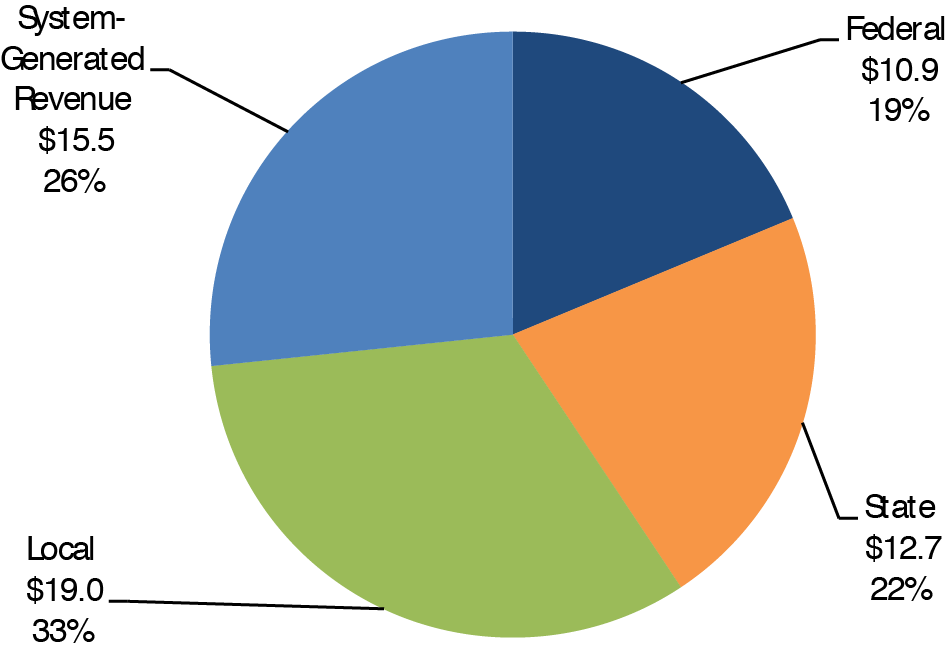
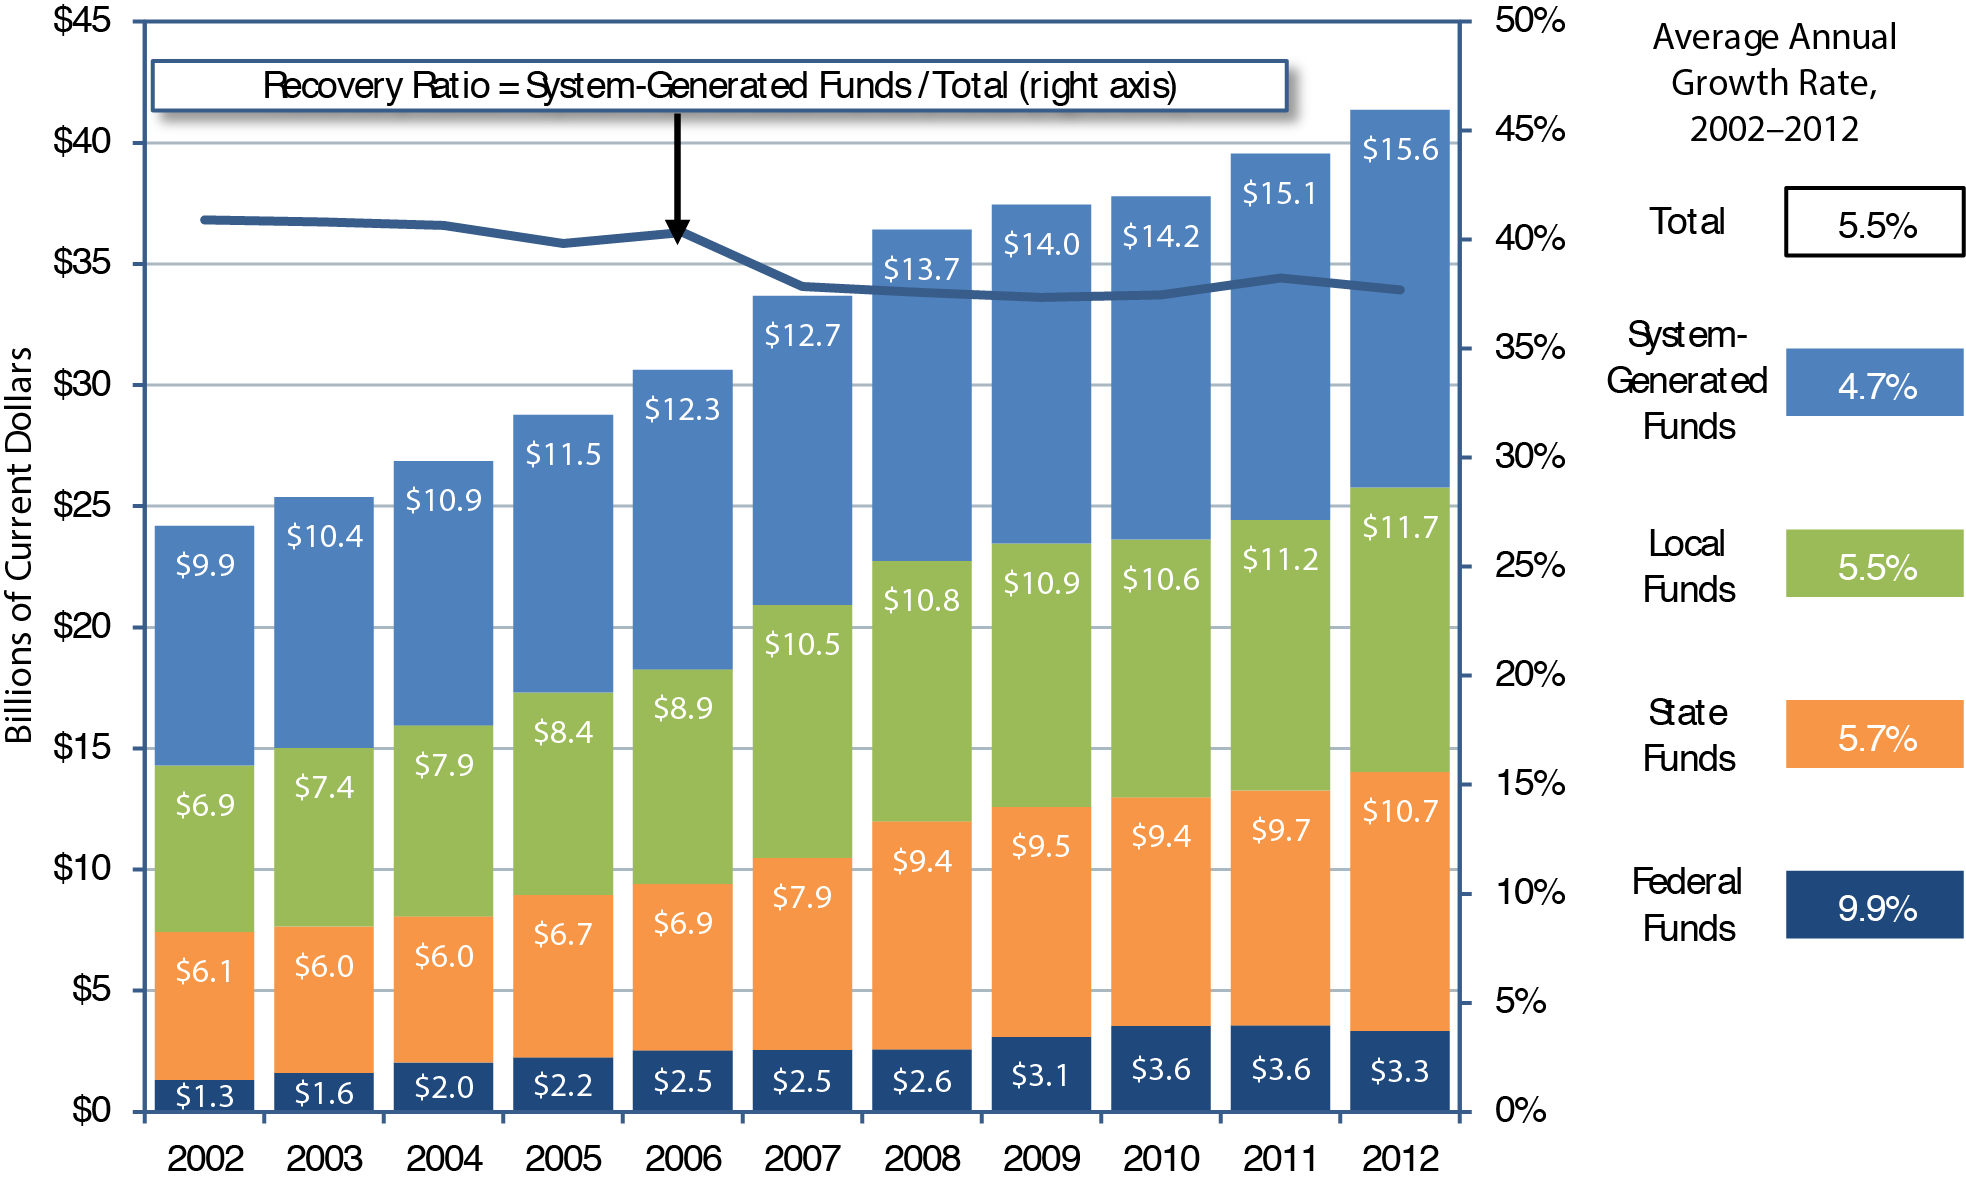
Exhibit 6-19 breaks down the sources of total urban transit funding. In 2012, public funds of $42.5 billion were available for urban transit, accounting for 73.3 percent of total transit funding. Of this amount, Federal funding was $10.9 billion or 25.5 percent of total public funding and 18.7 percent of all funding from both public and nonpublic sources. State funding was $12.7 billion, accounting for 29.9 percent of total public funds and 21.9 percent of all funding. Local jurisdictions provided the bulk of transit funds, $19 billion in 2012 or 44.6 percent of total public funds and 32.7 percent of all funding. System-generated revenues were $15.5 billion or 26.7 percent of all funding. During the American Recovery and Reinvestment Act (Recovery Act) years, 2009—2011, transit agencies reported annual expenditures averaging $17.0 billion. The infusion of $5.3 billion in Recovery Act funds during that period enabled the industry to maintain investment levels near the record 2008 funding level of $17.1 billion.
The last time annual net receipts credited to the Mass Transit Account (MTA) of the Highway Trust Fund exceeded annual expenditures from the Highway Account was 2007. As shown in Exhibit 6-20, for 9 of the 11 years since 2002, total annual receipts to the MTA from excise taxes and other income (including amounts transferred from the Highway Account) have been lower than the annual expenditures from the MTA. The gap between MTA outlays and receipts increased by 40.5 percent from 2011 to 2012.
Exhibit 6-20 Mass Transit Account Receipts and Outlays, Fiscal Years 2002—2012
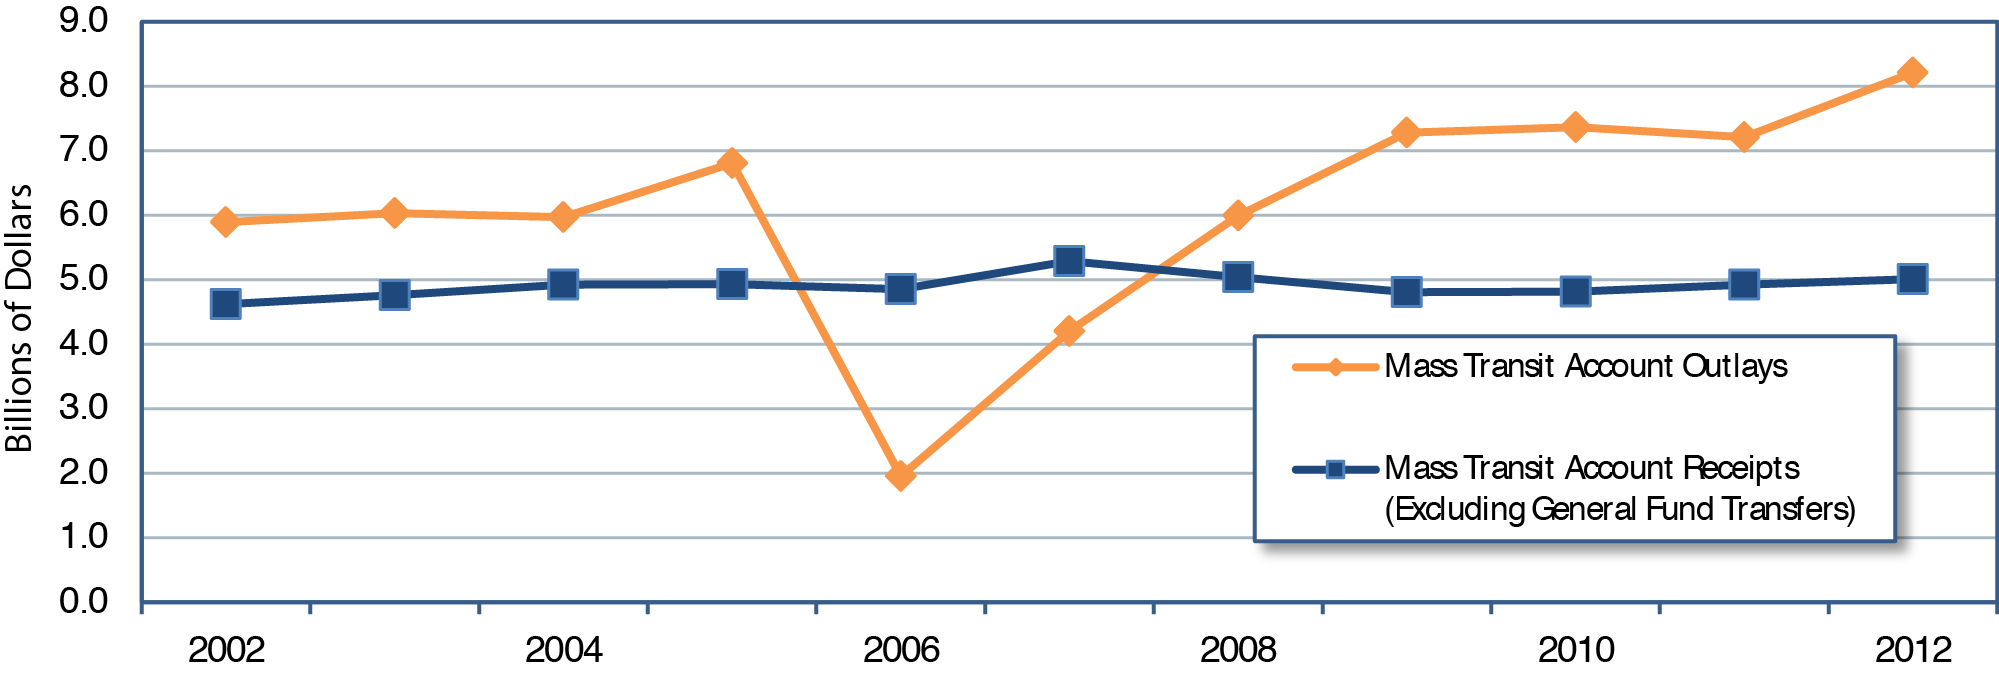
Sources: Highway Statistics, various years, Tables FE-210 and FE-10.
Federal Funding
Federal funding for transit comes from two sources: the general revenues of the U.S. government, and revenues generated from fuel taxes credited to the Highway Trust Fund's MTA. The largest part of the funding from the Highway Trust Fund is distributed by formula funding, which is legislatively defined. A smaller part is distributed competitively or at agency discretion.
General revenue sources include income taxes, corporate taxes, tariffs, fees, and other government income not required by statute to be accounted for in a separate fund. MTA, a trust fund for capital projects in transit, is generally the largest source of Federal funding for transit, although in 2009 Recovery Act funds from the general account surpassed the MTA contribution. Exhibit 6-21 shows how Recovery Act funds were awarded in 2009, 2010, and 2011 compared to other Federal funding from the MTA and the General Fund. Of the funds authorized for transit grants in FTA's 2010 budget, 79.0 percent were derived from the MTA. Funding from the MTA in nominal dollars increased from $0.5 billion in 1983 to $8.3 billion in 2010.
Exhibit 6-21 Urban Recovery Act Funding Awards Compared to Other FTA Fund Awards
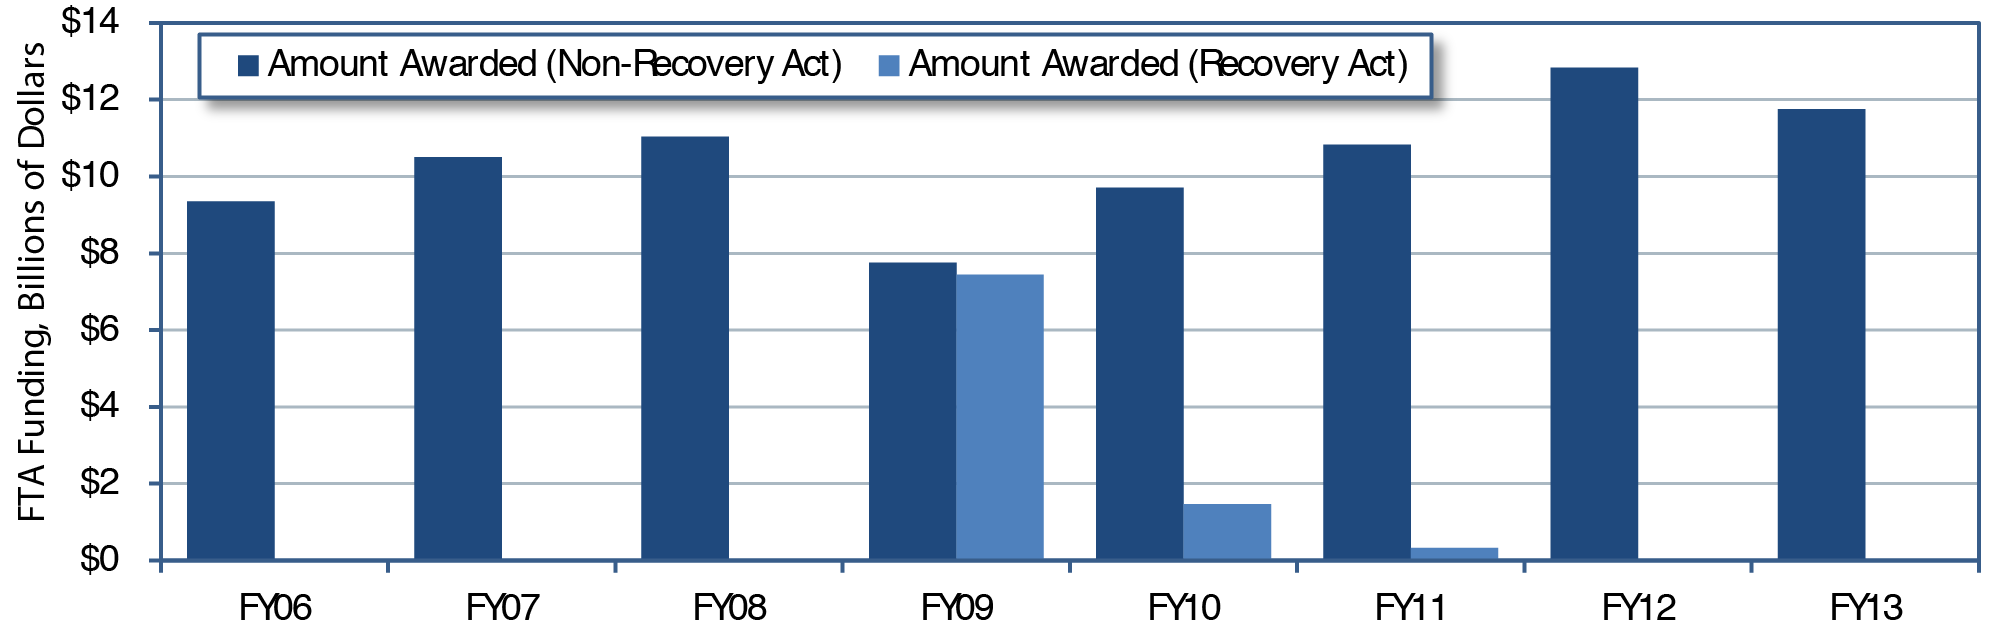
Source: Federal Transit Administration, Grants Data.
For the past 6 years, starting in 2008, the Highway Trust Fund has experienced shortfalls as authorized spending levels exceeded revenues. Revenues decreased due to several factors, including a reduction in fuel tax revenues caused by technological improvements in the manufacture of cars and other vehicles, which led to greater fuel efficiency, a drop in employment until early 2010 that led to reduced highway travel.
The Department of Homeland Security funds projects aimed at improving transit security. In 2012, the Department provided $87.5 million to transit service providers.
Since 1973, Federal statutes authorizing surface transportation have contained flexible funding provisions that enable transfers from certain highway funds to transit programs and vice versa. Transfers are subject to State and regional/local discretion, and priorities are established through statewide transportation planning processes. Forty-three States and the District of Columbia participate in the flexible funding program. Flexible funding transferred from highways to transit fluctuates from year to year and is drawn from several different sources.
The Surface Transportation Program is also the primary source of Federal Highway Administration (FHWA) funds that are "flexed" to the Federal Transit Administration (FTA) to pay for transit projects. Funding is at 80 percent of the Federal share and may be used for all capital and maintenance projects eligible for funds under current FTA programs. These funds may not be used for operating assistance.
FHWA's Congestion Mitigation and Air Quality (CMAQ) Improvement Program funds are another source of flexed funds used to support transit projects in air quality nonattainment areas. A CMAQ project must contribute to the attainment of the National Ambient Air Quality Standards by reducing air pollutant emissions from transportation sources. Public transportation projects can be funded through CMAQ, which also includes some provisions for transit operating assistance during project startup.
State and Local Funding
Exhibit 6-22 2012 Urban State and Local Sources of Transit Funding, Millions of Dollars
Source: National Transit Database.
General funds and other dedicated public funds (such as vehicle licensing and registration fees, communications access fees, surcharges and taxes, lottery and casino receipts, and proceeds from property and asset sales) are important sources of funding for transit at both the State and local levels. State and local funding sources for transit are shown in Exhibit 6-22. Taxes, including fuel, sales, income, property, and other dedicated taxes, provide 43 percent of public funds for State and local sources. General funds provide 25 percent of transit funding, and other public funds provide the remaining 32 percent.
System-Generated Funds
In 2012, system-generated funds were $15.5 billion and provided 26 percent of total transit funding. Passenger fares contributed $13.6 billion, accounting for 23.5 percent of total transit funds. These passenger fare figures do not include payments by State entities to transit systems that offset reduced transit fares for certain segments of the population, such as students and the elderly. These payments are included in the "other revenue" category.
Trends in Funding
Between 2002 and 2012, public funding for transit increased at an average annual rate of 3.5 percent, Federal funding increased at an average annual rate of 3.1 percent , and State and local funding increased at an average annual rate of 1.9 percent after adjusting for inflation (constant dollars). These data are presented in Exhibit 6-23.
Exhibit 6-23 Urban Funding for Transit by Government Jurisdiction, 2002—2012 (Constant Dollars)
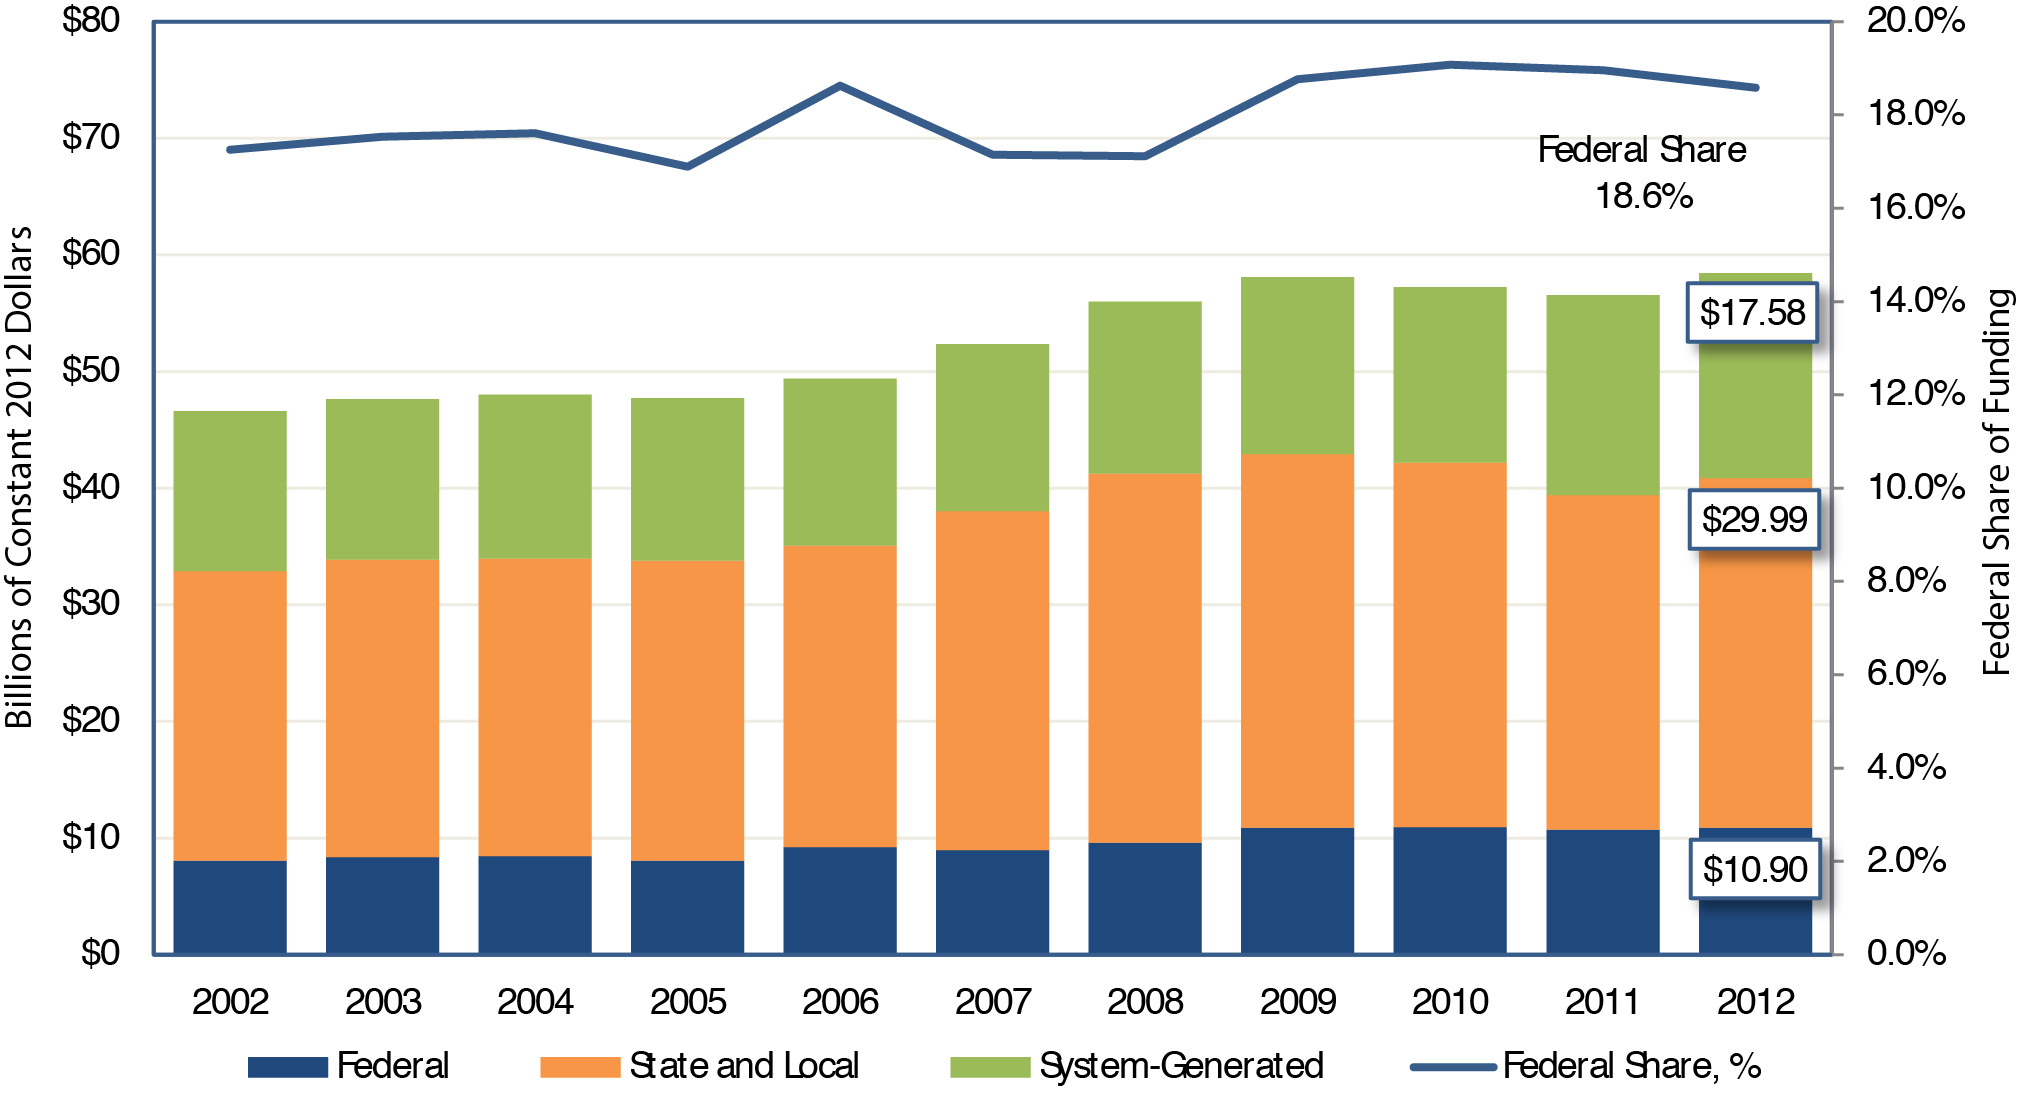
Source: National Transit Database.
Federal funding for transit, as a percentage of total funding for transit from Federal, State, and local sources combined, reached a peak of 42.9 percent in the late 1970s, and declined to near its present value by the early 1990s. State and local funding increased during this same period. Exhibit 6-23 shows that, since 2002, the Federal government has provided between 16.9 and 19.5 percent of total funding for transit (including system-generated funds). In 2012, it provided 18.6 percent .
Funding in Current and Constant Dollars
Public funding for transit in current dollars and constant (adjusted for inflation) dollars since 1992 is presented in Exhibit 624. Total public funding for transit was $42.5 billion in 2012. In constant dollar terms, this amount was 3.2 percent lower than in 2010. Between 2010 and 2012, Federal funding increased from nearly $10.4 billion to $10.9 billion (4.8 percent ) in current dollars. In constant dollars, however, this represents a 0.5-percent decrease in funding. From 2010 to 2012, in current dollars, State and local funding increased from $29.8 billion to $31.7 billion (6.4 percent). In constant dollars, this represents a 4.0-percent decrease in funding.
Federal funds directed to capital expenditures have increased 4.2 percent from 2002 to 2012, while capital funds applied to operating expenditures have increased 9.9 percent during the same period (current dollars). As indicated in Exhibit 6-25, $3.4 billion was applied to operating expenditures and $7.5 billion was applied to capital expenditures in 2012. More than half the operating expenditures were for preventive maintenance, which is reimbursed as a capital expense under FTA's 5307 grant program.
Exhibit 6-24 Urban Current and Constant Dollar Funding for Public Transportation, 1992—2012 (All Sources)1
1 Constant dollar conversions were made using the U.S. Bureau of Labor Statistics CPI.
Source: National Transit Database.
Exhibit 6-25 Urban Applications of Federal Funds for Transit Operating and Capital Expenditures, 2002—2012

Source: National Transit Database.
Capital Funding and Expenditures
Funding for capital investments by transit operators in the United States comes primarily from public sources. A relatively small amount of private-sector funds for capital investment in transit projects is generated through innovative finance programs.
Capital investments include the design and construction of new transit systems, extensions of existing systems, and the modernization or replacement of existing assets. Capital investment expenditures can be for the acquisition, renovation, and repair of vehicles (e.g., buses, railcars, locomotives, and service vehicles) or fixed assets (e.g., fixed-guideway systems, terminals, stations, and maintenance and administrative facilities).
As shown in Exhibit 6-26, total public transit agency expenditures for capital investment were $16.9 billion in 2012. This expenditure accounted for 39.8 percent of total available funds for transit. Federal funds were $6.0 billion in 2012, 35.5 percent of total transit agency capital expenditures. State funds provided 11.9 percent and local funds provided 43.7 percent of total transit funding. Recovery Act funds provided the remaining 8.9 percent of revenues for agency capital expenditures.
Exhibit 6-26 Urban Sources of Funds for Transit Capital Expenditures, 2002—2012
1 Growth rate shown for Federal Funds includes Recovery Act funds as well as other types of Federal funds.
Source: National Transit Database.
From 2009 to 2011, substantial amounts of Recovery Act funds were expended, and non-Recovery Act Federal funds decreased compared to previous years. This decrease is not surprising, given the strict 2-year obligation limit specified for Recovery Act funds-these funds had to be used first due to their short availability period. In 2012, as most of the Recovery Act funds had been expended, expenditures using non-Recovery Act Federal funds reverted to pre-2009 levels.
As shown in Exhibit 6-27, rail modes require a higher percentage of total transit capital investment than fixed-route bus modes for two reasons: (1) the higher cost of building fixed guideways and rail stations and (2) fixed-route bus systems typically do not pay to build or maintain the roads on which they run. In 2012, $12.1 billion, or 72.1 percent of total transit capital expenditures, were invested in rail modes of transportation, compared with $4.7 billion, or 27.9 percent of the total, which was invested in nonrail modes. This investment distribution has been consistent over the past decade.
Fluctuations in the levels of capital investment in different types of transit assets reflect normal rehabilitation and replacement cycles and new investment. Capital investment expenditures have been reported to the National Transit Database only at the level of detail in Exhibit 6-27 since 2002.
Total guideway investment was $6.1 billion in 2012, and total investment in systems was $1.5 billion. Guideway includes at-grade rail, elevated and subway structures, tunnels, bridges, track and power systems for all rail modes, and paved highway lanes dedicated to fixed-route buses. Investment in systems by transit operators includes groups of devices or objects forming a network, most notably for train control, signaling, and communications.
FTA provides funding for the design and construction of light rail, heavy rail, commuter rail, streetcar, bus rapid transit, and ferry projects through a competitive, discretionary grant program known as Capital Investment Grants. Title 49 U.S.C. Section 5309 provides funds for new transit systems and extensions to current systems and for capacity expansion projects on existing transit lines currently at or over capacity. These types of projects are known more commonly as "New Starts," "Small Starts," and "Core Capacity" projects.
To receive funds from the Capital Investment Grant program, the proposed project must emerge from the metropolitan or statewide planning process and proceed through a multiyear, multistep process outlined in law, which includes a detailed evaluation and rating of the project by FTA. FTA evaluates proposed projects based on financial criteria and project justification criteria as prescribed by statute.
Under current law, Capital Investment Grant funding may not exceed 80 percent of a project's total capital cost. Generally, however, the Capital Investment Grant program share of such projects averages about 50 percent due to the overwhelming demand for funds nationwide. Funds are typically provided over a multiyear period rather than all at once, due to the size of the projects and the size of the overall annual program funding level.
Most, but not all, major transit capital projects are constructed using Capital Investment Grant program funds. Some project sponsors choose to use other sources instead, such as FTA Urbanized Area Formula funds, FTA discretionary Ferry Program funds, and Transportation Investments Generating Economic Recovery funds from the Department of Transportation.
In 2012, total investment in vehicles, stations, and maintenance facilities was $3.7 billion, $3.2 billion, and $1.3 billion, respectively. Vehicles include the bodies and chassis of transit vehicles and their attached fixtures and appliances but do not include fare collection equipment and movement control equipment for revenue vehicles, such as radios. Stations include station buildings, platforms, shelters, parking and other forms of access, and crime prevention and security equipment at stations. Facilities include the purchase, construction, and rehabilitation of administrative and maintenance facilities. Facilities also include investment in building structures, climate control, parking, yard track, vehicle and facilities maintenance equipment, furniture, office equipment, and computer systems.
Other capital costs include those associated with general administration facilities, furniture, equipment that is not an integral part of buildings and structures, data processing equipment, and shelters located at on-street bus stops. Data processing equipment includes computers and peripheral devices for which the sole use is in data processing operations.
Exhibit 6-28 shows yearly capital expenditures for rehabilitation or expansion by mode. Rehabilitation expenses are those dollars used to replace service directly or to maintain existing service. Expansion expenses are those used to increase service. Example expansion expenses include procuring additional buses to create a new route, building a new rail line, or constructing an additional rail station on an existing rail line.
After adjusting for inflation (constant dollars), total capital expenditures from 2003 to 2012 have increased by an annual average of 5.7 percent . Although rehabilitation expenses over this period have increased modestly, service expansion investment, particularly in rail modes, has increased considerably. Average annual expenses for heavy rail expansion had the largest increase over this time, with an average annual expansion expense of 13.6 percent .
Operating Expenditures
Transit operating expenditures include wages, salaries, fuel, spare parts, preventive maintenance, support services, and certain leases used in providing transit service. As indicated in Exhibit 6-29, $41.4 billion was available for operating expenses in 2012, the Federal share of which decreased from the 2010 level of 9.4 percent to 8.1 percent . The largest share of Federal funds applied to operating expenditures comes from the Urbanized Area Formula Program (Title 49 U.S.C. Section 5307), which contributed 77 percent of all Federal funds. This program includes operating assistance for urbanized areas with populations less than 200,000 and capital funds eligible for operating assistance, such as preventive maintenance. Funds from the Recovery Act contributed 4 percent of Federal funds. The remaining 19 percent included FTA, Department of Transportation, and other Federal funds. The share generated from system revenues remained relatively stable, 37.5 percent in 2010 compared to 37.7 percent in 2012. The State share increased marginally from 25.0 percent in 2010 to 25.8 percent in 2012. The local share of operating expenditures was essentially unchanged from 28.2 percent in 2010 to 28.4 percent in 2012.
Operating Expenditures by Transit Mode
As shown in Exhibit 6-30, total transit operating expenditures were $37.6 billion in 2012. These expenditures increased at an average annual rate of 5.1 percent between 2002 and 2012 (in current dollars). Light rail and demand-response modes experienced the largest percentage increase in operating expenditures during this period. This increase is due to relatively greater investment in new light rail and demand-response capacity over the past 10 years.
Exhibit 6-29 Urban Sources of Funds for Transit Operating Expenditures, 2002—20121
1 This chart includes reconciled funds that eliminate double counting and incorporates funds (fares and revenues accrued through a purchased transportation agreement) reported by sellers under contract to public agencies that are also reported by the buyers.
Source: National Transit Database.
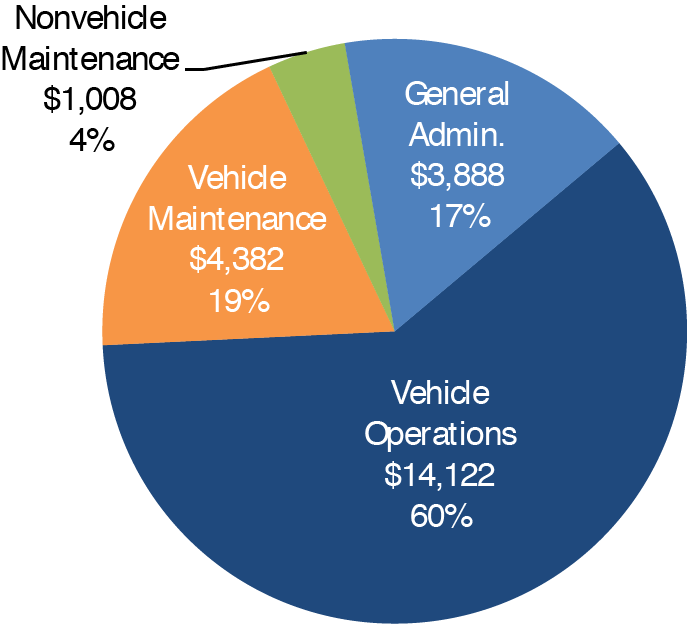
Operating Expenditures by Type of Cost
In 2012, $19.9 billion, or 53.0 percent of total transit operating expenditures, went toward vehicle operations. Smaller amounts were expended on maintenance and administration; these expenses, which have virtually been unchanged for the past several years, are broken down across cost categories in Exhibit 6-31.
Exhibits 6-32 and 6-33 illustrate how road and rail operations have inherently different cost structures because, in most cases, roads are not paid for by the transit provider, but tracks are. A significantly higher percentage of expenditures for rail modes of transportation is classified as nonvehicle maintenance, corresponding to the repair and maintenance costs of fixed guideway systems.
Operating Expenditures per Vehicle Revenue Mile
Operating expenditures per vehicle revenue mile (VRM) is one measure of financial or cost efficiency. It shows the expense of operating a transit vehicle in revenue service. As shown in Exhibit 6-34, operating expenditures per VRM for all transit modes combined was $9.48 in 2012. The average annual increase in operating expenditures per VRM for all modes combined between 2002 and 2012 was 1.1 percent in constant dollars.
Exhibit 6-32 2012 Urban Rail Operating Expenditures by Type of Cost, Millions of Dollars

Source: National Transit Database.
Exhibit 6-33 2012 Urban Nonrail Operating Expenditures by Type of Cost, Millions of Dollars
Source: National Transit Database.
Exhibit 6-35 shows average per-mile fares and costs for the Nation's 10 largest transit agencies since 2002. After adjusting for inflation (constant dollars), fares per mile over this period increased 6.6 percent , while the average cost per mile increased 6.3 percent . These increases resulted in a 0.3-percent increase in the "fare recovery ratio," which is the percentage of operating costs covered by passenger fares. The 2012 fare recovery ratio for these 10 agencies was 38.0 percent. These 10 agencies are all rail agencies, and rail systems tend to have lower operating costs per mile. Therefore, this fare recovery ratio is higher than would be found for most fixed-route bus or demand-response operations.
Exhibit 6-35 Urban Average Fares and Operating Costs per Mile-Top 10 Transit Agencies, 2002—2012 (Constant Dollars) |
|||||||||||||
|---|---|---|---|---|---|---|---|---|---|---|---|---|---|
| Top 10 Systems1 | 2002 | 2003 | 2004 | 2005 | 2006 | 2007 | 2008 | 2009 | 2010 | 2011 | 2012 | % Increase | |
| 2002—2012 | Average Annual | ||||||||||||
| Average Fare per Mile | $2.57 | $2.63 | $2.88 | $3.08 | $3.38 | $3.58 | $3.81 | $3.80 | $4.10 | $4.67 | $4.90 | 90% | 6.6% |
| Average Operating Cost per Mile | $6.99 | $7.34 | $7.85 | $8.53 | $9.23 | $10.11 | $10.48 | $10.72 | $11.38 | $12.27 | $12.90 | 85% | 6.3% |
| Average Recovery Ratio | 36.8% | 35.9% | 36.6% | 36.1% | 36.6% | 35.4% | 36.4% | 35.4% | 36.1% | 38.1% | 38.0% | 3% | 0.3% |
1 Includes Metropolitan Transit Authority New York City, Chicago Transit Authority, Los Angeles County Metropolitan Transportation Authority, Washington Metropolitan Area Transit Authority, Massachusetts Bay Transportation Authority, Southeastern Pennsylvania Transportation Authority, New Jersey Transit Corporation, San Francisco Municipal Railway, Metropolitan Atlanta Rapid Transit Authority, and Maryland Transit Administration. Source: National Transit Database. |
|||||||||||||
As shown in Exhibit 6-36, analysis of the National Transit Database reports for the top 10 agencies in urbanized areas with greater than 1 million in population shows that the growth in operating expenses is led by the cost of fringe benefits, which have been increasing at a rate of 2.3 percent per year above inflation (constant dollars) since 2002. By comparison, average salaries at these 10 agencies decreased at an inflation-adjusted rate of 0.9 percent per year in that period.
Exhibit 6-36 Urban Growth in Operating Costs-Top 10 Agencies, 2002—2012 (Constant Dollars), Directly Operated Services1 | ||||||||||||||
|---|---|---|---|---|---|---|---|---|---|---|---|---|---|---|
| Cost Component | Average Cost per Mile, Constant Dollars | % Increase | ||||||||||||
| 2002 | 2003 | 2004 | 2005 | 2006 | 2007 | 2008 | 2009 | 2010 | 2011 | 2012 | 2002—2012 | Average Annual | ||
| Salaries | $5.53 | $5.47 | $5.40 | $5.26 | $5.29 | $5.37 | $4.98 | $5.02 | $5.04 | $5.10 | $5.03 | -9% | -0.9% | |
| Fringe Benefits | $3.29 | $3.46 | $3.59 | $3.65 | $3.71 | $3.96 | $3.53 | $3.72 | $3.91 | $4.08 | $4.13 | 26% | 2.3% | |
| Labor Cost | $8.82 | $8.93 | $8.99 | $8.91 | $9.01 | $9.34 | $8.51 | $8.74 | $8.95 | $9.18 | $9.16 | 4% | 0.4% | |
1 Includes Metropolitan Transit Authority New York City, Chicago Transit Authority, Los Angeles County Metropolitan Transportation Authority, Washington Metropolitan Area Transit Authority, Massachusetts Bay Transportation Authority, Southeastern Pennsylvania Transportation Authority, New Jersey Transit Corporation, San Francisco Municipal Railway, Metropolitan Atlanta Rapid Transit Authority, and Maryland Transit Administration. Includes directly operated services only as labor data are not reported for purchased transportation services in the NTD. Source: National Transit Database. |
||||||||||||||
Operating expenditures per capacity-equivalent VRM are a better measure of comparing cost efficiency among modes than operating expenditures per VRM because they adjust for passenger-carrying capacities. As demonstrated in Exhibit 6-37, rail systems are more cost efficient in providing service than nonrail systems, once investment in rail infrastructure has been completed. Based on operating costs alone, heavy rail is the most efficient at providing transit service, and demand-response systems are the least efficient. Annual changes in operating expense per capacity-equivalent VRM are not comparable across modes because average capacities for all vehicle types are adjusted separately each year based on reported fleet averages.
Operating Expenditures per Passenger Mile
Operating expense per passenger mile is an indicator of the cost effectiveness of providing a transit service. It shows the relationship between service inputs as expressed by operating expenses and service consumption as measured in passenger miles traveled. Operating expenditures per passenger mile for all transit modes combined increased at an average annual rate of 0.7 percent between 2002 and 2012 (from $0.64 to $0.68). These data are shown in Exhibit 6-38.
Farebox Recovery Ratios
The farebox recovery ratio represents farebox revenues as a percentage of total transit operating costs. It measures users' contributions to the variable cost of providing transit services and is influenced by the number of riders, fare structure, and rider profile. Low regular fares, high availability and use of discounted fares, and high transfer rates tend to result in lower farebox recovery ratios. Farebox recovery ratios for 2004 to 2012 are provided in Exhibit 6-39. The average farebox recovery ratio over this period for all transit modes combined was 35.0 percent ; heavy rail had the highest average farebox recovery ratio at 61.1 percent . Farebox recovery ratios for total costs are not provided because capital investment costs are not evenly distributed across years. Rail modes have farebox recovery ratios for total costs that are significantly lower than for operating costs alone because of these modes' high level of capital costs.
Exhibit 6-39 Urban Farebox Recovery Ratio by Mode, 2004—20121 | |||||||
|---|---|---|---|---|---|---|---|
| Year | Fixed-Route Bus | Heavy Rail | Commuter Rail | Light Rail | Demand Response | Other2 | Total |
| 2004 | 27.9% | 61.3% | 47.0% | 26.2% | 9.6% | 36.2% | 35.5% |
| 2005 | 27.6% | 58.4% | 47.2% | 25.4% | 9.5% | 12.6% | 34.8% |
| 2006 | 26.6% | 60.9% | 49.4% | 27.4% | 9.3% | 34.3% | 34.8% |
| 2007 | 26.6% | 56.8% | 49.5% | 26.6% | 8.2% | 35.3% | 34.0% |
| 2008 | 26.3% | 59.4% | 50.3% | 29.3% | 7.5% | 32.7% | 34.1% |
| 2009 | 26.7% | 60.2% | 47.9% | 28.0% | 7.8% | 34.9% | 34.2% |
| 2010 | 26.7% | 62.3% | 48.5% | 27.5% | 7.9% | 37.0% | 34.7% |
| 2011 | 27.9% | 66.0% | 52.0% | 28.9% | 7.3% | 37.9% | 36.5% |
| 2012 | 28.2% | 64.6% | 51.8% | 29.0% | 7.7% | 40.4% | 36.6% |
| Average | 27.2% | 61.1% | 49.3% | 27.6% | 8.3% | 33.5% | 35.0% |
1 Note that the ratios presented in this exhibit were calculated differently from the ratios presented in the 2008 C&P Report; therefore, they are not totally comparable. The ratios presented here were calculated using data from NTD data table 26, "Fares per Passenger and Recovery Ratio" (available at www.ntdprogram.gov/ntdprogram/data.htm). 2 Includes monorail/automated guideway, Alaska railroad, cable car, ferryboat, inclined plane, Público, trolleybus, and vanpool. Source: National Transit Database. |
|||||||
Rural Transit
The Federal government has contributed to the funding of transit in rural areas (i.e., areas with populations less than 50,000) since 1978. These rural areas are estimated to account for approximately 36 percent of the U.S. population and 38 percent of the transit-dependent population.
Funding for rural transit is currently provided through Section 5311, the Rural Formula Grant Program. Rural transit funding increased substantially with passage of the Transportation Equity Act for the 21st Century (TEA-21) and continued to increase under the Safe, Accountable, Flexible, Efficient Transportation Equity Act: A Legacy for Users (SAFETEA-LU). Federal funding for rural transit was $240 million in the last year of TEA-21, Fiscal Year 2004, and reached $569 million in the last year of SAFETEA-LU, Fiscal Year 2012. States may transfer additional funds to rural transit from highway projects or formula transit funds for small urbanized areas.
Exhibit 6-40 Rural Transit Funding Sources for Capital Expenditures, 2012
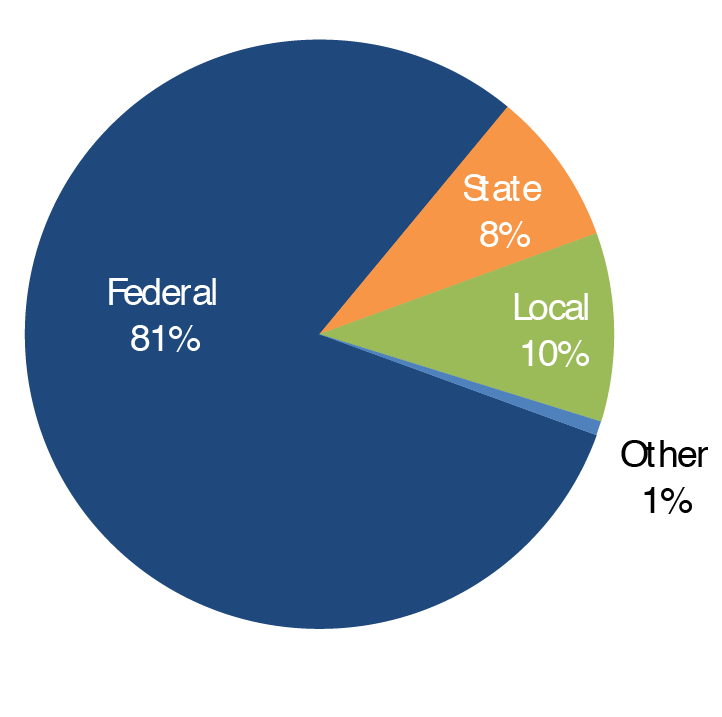
Source: National Transit Database.
Federal funds constitute the bulk of capital funds applied to rural transit. As shown in Exhibit 6-40, Federal funds accounted for 80 percent of rural transit capital budgets. This amount of funding is a historic record and was due to funds being made available from the Recovery Act, which accounted for 30 percent of the total capital investment. The two main sources of non-Recovery Act Federal funds are the FTA Capital Program (Section 5309) and Urbanized Area Formula Funds (49 U.S.C. Section 5311). These two sources combined contributed 38.3 percent of non-Recovery Act funds. The other 11.7 percent originated from other FTA programs and Federal sources.
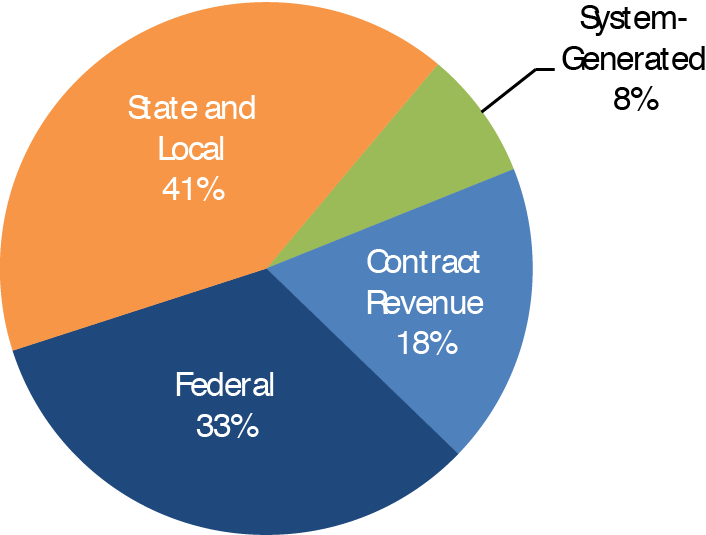
As shown in Exhibit 6-41, 33 percent of rural transit authorities' operating budgets come from Federal funds. State and local governments cover 41 percent of their rural transit operating budgets through a combination of dedicated State and local taxes, appropriations from State general revenues, and allocations from other city and county funds. Contract revenue, defined as reimbursement from a private entity (profit or nonprofit) for the provision of transit service, accounts for 18 percent of operating budgets for rural transit. Fares accounted for only 8 percent , close to the average farebox recovery rate for demand-response service (which constitutes most of rural transit). In 2012, the total value of rural transit operating budgets reported to the National Transit Database was $1.37 billion.
Exhibit 6-41 Rural Transit Funding Sources for Operating Expenditures, 2012
Source: National Transit Database.