Previous Chapter « Table of Contents »
Research by Richards and Elms (10) in the late 1970s suggests that application of traditional seismic design procedures, such as the Mononobe-Okabe procedure, does not adequately capture the performance of gravity walls during seismic loading. The method proposed by Richards and Elms presents an alternative and rational method for selection of the horizontal seismic coefficient, kh. Using a Newmark-type displacement analysis, Richards and Elms developed equations for determination of kh that assume some permanent displacement of a wall (in this case, the rockery) is acceptable. Richards and Elms came to this conclusion after realizing that most seismic evaluations of retaining structures neglected inertial forces for the structure itself. When the mass of the structure is large, such as the case with rockeries, the results can be unconservative. However, they concluded it is impractical to size a retaining structure such that it has sufficient mass to prevent all movement during a seismic event, and, therefore, it makes more sense to design to a tolerable level of displacement.
Richards and Elms defined a permanent displacement, Δ , which the wall can tolerate without significant distress or failure. The value of Δ is typically assumed to be about 5% of the base width of the rockery. For a 3-m-tall rockery, this is about 75 mm. In comparison, AASHTO suggests Δ is equal to abut 250A (in mm) when using the AASHTO seismic design charts.(19) For A values of 0.3 and 0.4, this results values of Δ of 75 and 100 mm, respectively. The actual tolerable displacement should be selected by the Geotechnical Engineer based on the sensitivity of any improvements retained behind the rockery.
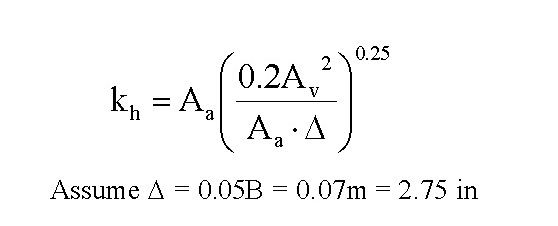
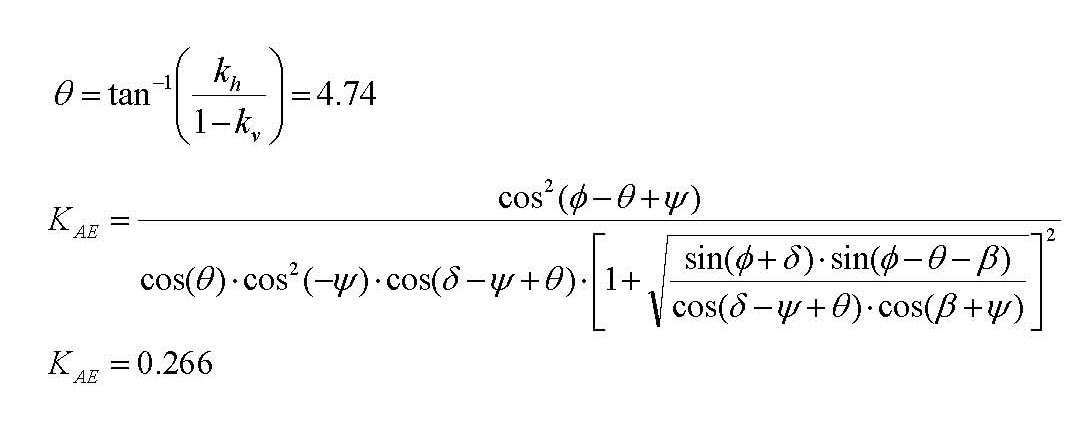
Once the tolerable displacement has been selected, the seismic coefficient is determined using the equation presented in Figure 77. The value of Δ must be input in inches. The values Aa and Av represent acceleration coefficients developed by the Applied Technology Council (ATC). (24) The values are presented on regional maps, and, therefore, should not be considered to be site- specific.
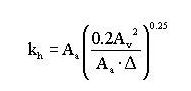
Figure 77. Equation. Determination of horizontal seismic coefficient, kh (Δ in inches).
Richards and Elms concluded the wall should be designed with sufficient weight to resist the total thrust (FAE) on the wall (static plus seismic) multiplied by an inertial coefficient (CIE). A later study by Whitman(11) concluded that if the actual weight of the wall is at least 10% greater than the weight required (that is, a factor of safety of 1.1), then there is a greater than 90% probability that Δ will not be exceeded. Higher factors of safety result in a greater confidence level. Figures 78, 79, and 80 present the equations required to calculate the factor of safety.
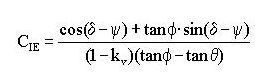
Figure 78. Equation. Computation of inertial thrust coefficient.
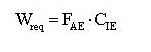
Figure 79. Equation. Computation of weight required to resist seismic forces.
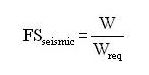
Figure 80. Equation. Seismic factor of safety with regard to wall movement.
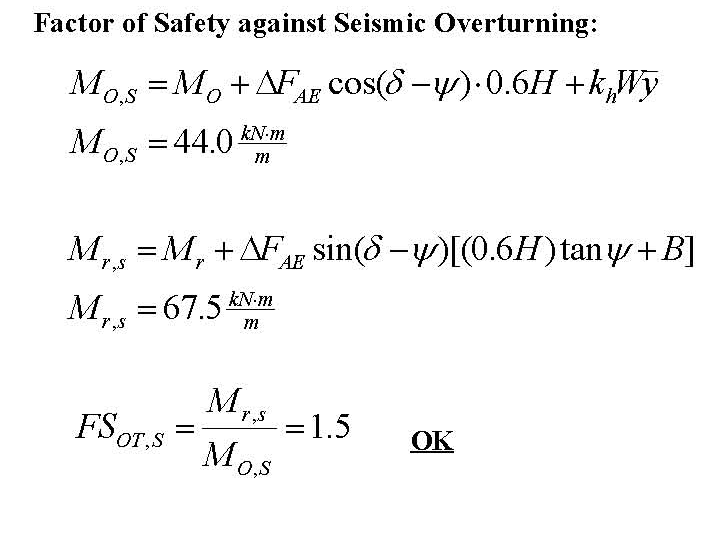
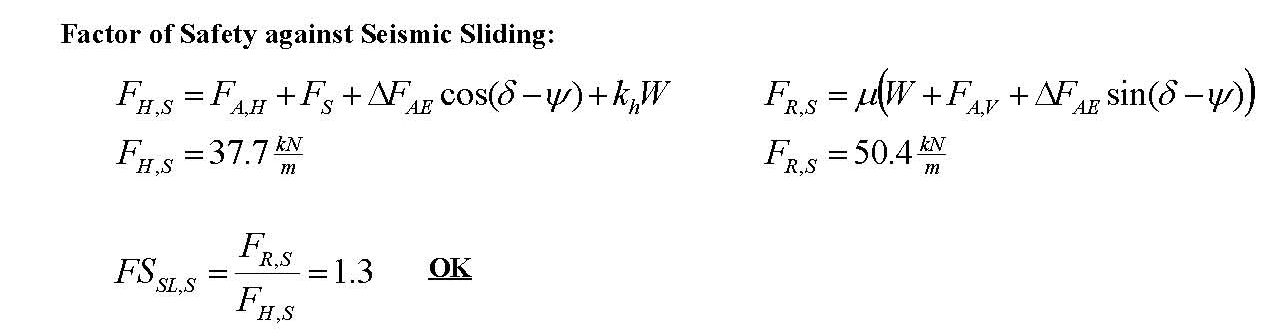
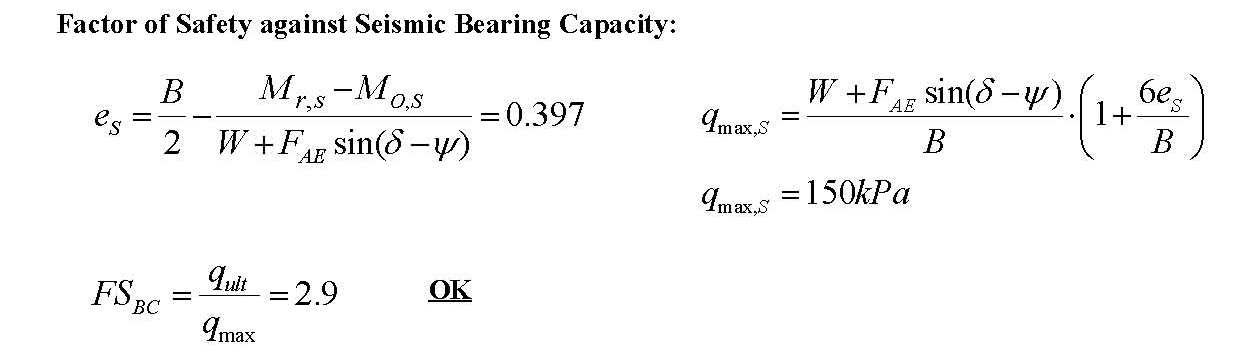
If FSseismic is greater than 1.1, there is a 90% probability that the wall displacement will not exceed Δ Δ , provided the level of ground shaking does not exceed the estimated values. The Geotechnical Engineer should also use the value of kh obtained from Figure 77 to check the factors of safety with respect to seismic overturning, sliding, and bearing capacity described in Chapter 4.
The Richards and Elms procedure provides a rational method for determination of kh and reasonable factors of safety for seismic conditions. However, the method relies on the values of Aa and Av from the ATC maps, which were developed in the late 1970s. These maps are still referenced by many designers and regulatory agencies, including the State of California Office of Statewide Health Planning and Development (OSHPD),(25) and are likely acceptable in areas of relatively low seismicity (UBC Seismic Zones 1, 2, and portions of 3). However, recent building codes have introduced near-source amplification factors to increase the PGA in seismically active areas near fault lines, a concept that is not captured by the older ATC maps. Therefore, the authors believe they may be insufficient in areas of higher seismicity.
The authors have developed a method that may prove to be a rational, feasible way to scale up the values of Aa and Av in areas of higher seismicity. The method consists of deriving new values of Aa and Av using a site-specific elastic response spectrum. If a site-specific response spectrum is not available, a design spectrum can be constructed utilizing methods proposed by Newmark and Hall, as described in Chopra.(26)
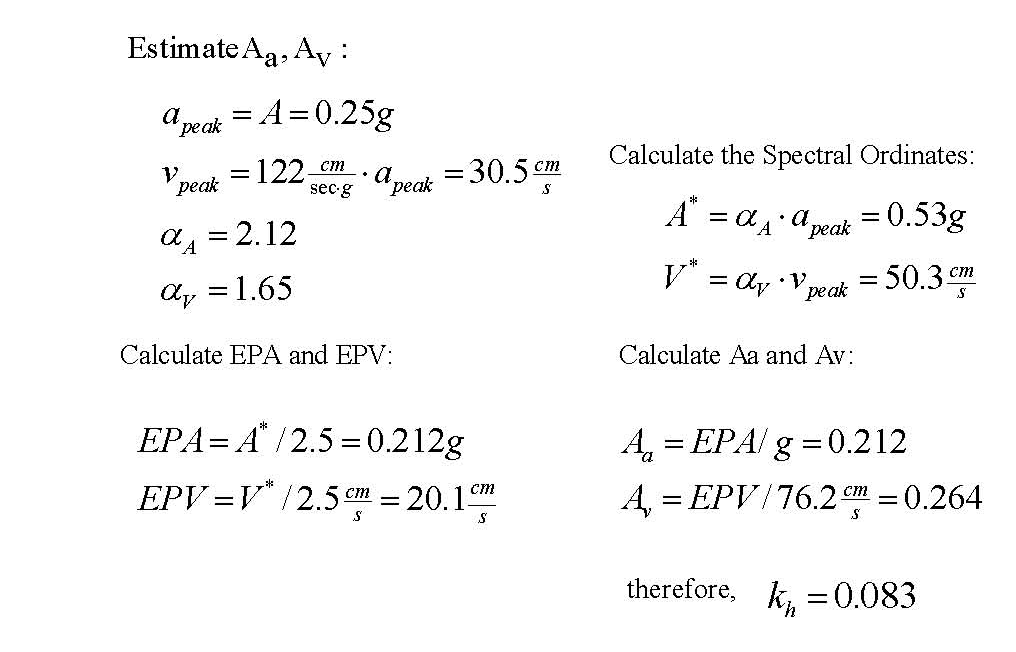
To develop the design spectrum, the peak ground acceleration (apeak, equivalent to PGA) should be obtained from the Geotechnical Engineer for a 10% probability of exceedance in 50 years.
This value is equivalent to the value of A on the AASHTO maps. The peak velocity is determined from the standard ratio proposed by Newmark and Hall:
Although not required, the peak displacement can also be determined utilizing the ratio (apeak)(dpeak)/(vpeak)2 = 6. The values for peak acceleration, peak velocity, and peak displacement are then multiplied by amplification factors developed by Newmark and Hall for 5% critical damping.(26) Newmark and Hall developed amplification factors for both a median spectrum and a median plus one standard deviation. Based on the authors' review of the ATC report, we believe the median values were originally used by ATC, and, therefore, the median values should be used for consistency. These amplification factors are αA = 2.12, αV = 1.65, and αD = 1.39.
Therefore:
Once the values of A* and V* have been determined, they can be used to determine the effective peak acceleration (EPA) and effective peak velocity (EPV). The EPA is defined as the average spectral acceleration over the period range 0.1 to 0.5 seconds divided by 2.5. The average spectral acceleration can be taken as equal to the value of A* computed above.
The EPV is defined as the average spectral velocity at a period of 1 second divided by 2.5. This value can be taken as equal to V* from the Newmark and Hall analysis.
The effective peak acceleration coefficient, Aa, is numerically equal to the EPA when expressed as a decimal fraction of gravity. The effective peak velocity-related acceleration coefficient, Av, is numerically equal to the EPV/76.2 when the EPV is expressed in cm/sec. For example, Av=0.2 when EPV = 15.24 cm/sec. In summary:
These values can then be used in the equation presented in Figure 77 for the determination of kh and the seismic design performed in accordance with the Richards and Elms procedure. This value can also be used to determine the factors of safety with respect to seismic overturning, sliding, and bearing capacity described in Chapter 4.
At the time this report was prepared, the authors had successfully completed substantial design work using the Richards and Elms method. However, the method scaling of Aa and Av , as described previously, has been used on very few designs, and has not been identified in the literature. Therefore, we recommend this scaling method be viewed as a preliminary design concept requiring further study.
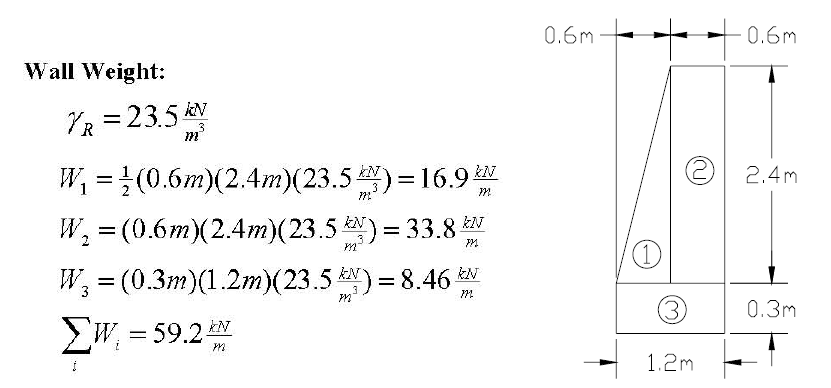
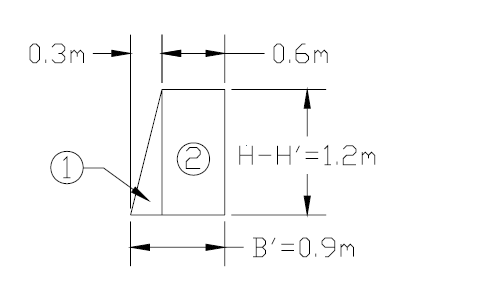
The following is a sample design problem illustrating the design procedure described in Chapter 4. The hypothetical design case involves construction of a 2400-mm-tall (8-ft-tall) rockery with level back slope and toe slopes. A standard AASHTO vehicle surcharge is assumed to act behind the rockery. In order to simplify the analysis for the example problem, a temporary concrete traffic barrier (K-rail) was used instead of a guardrail. In addition, the following assumptions were made:
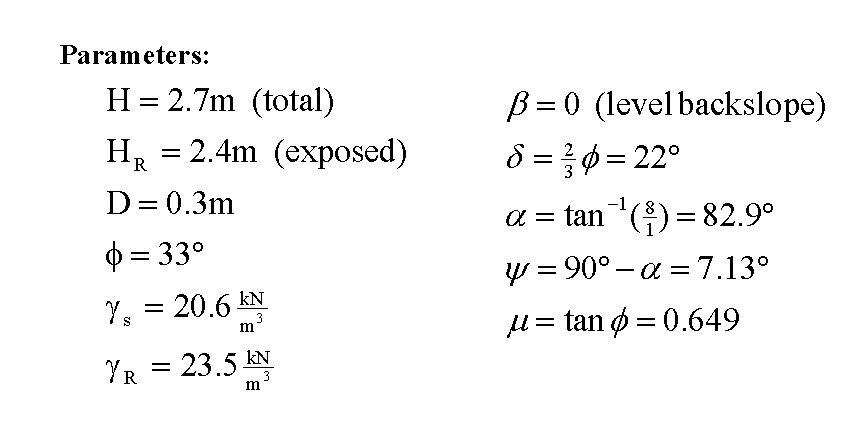
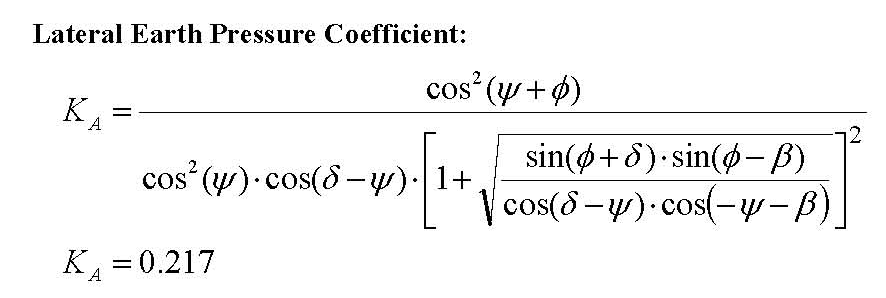
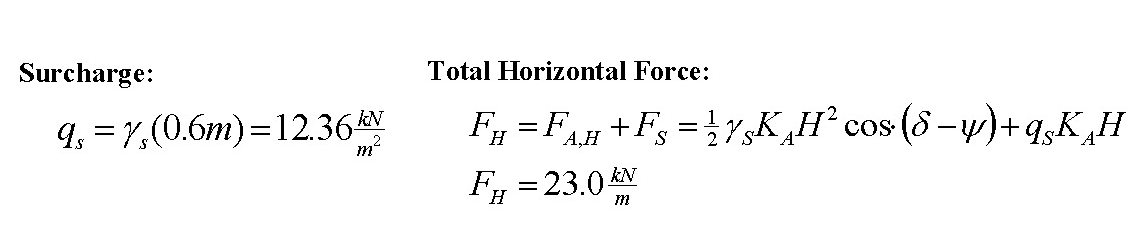
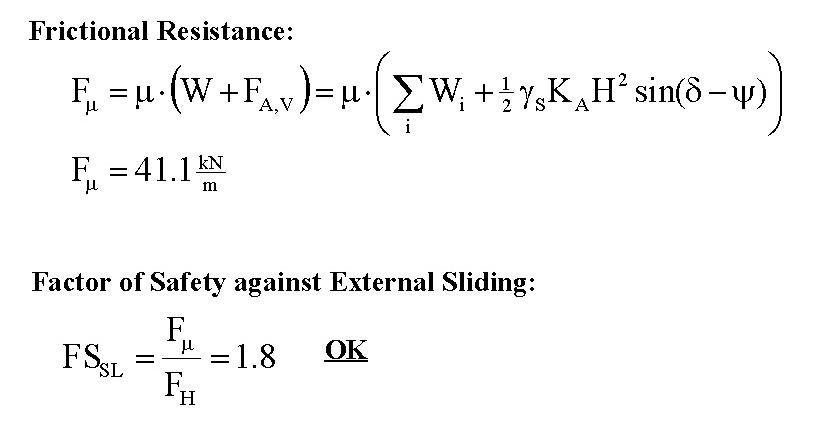
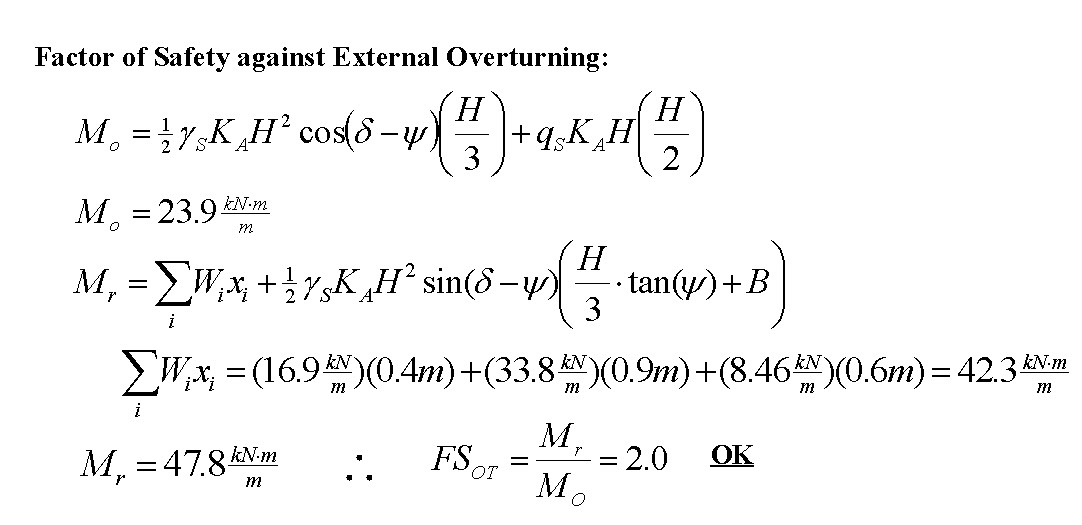
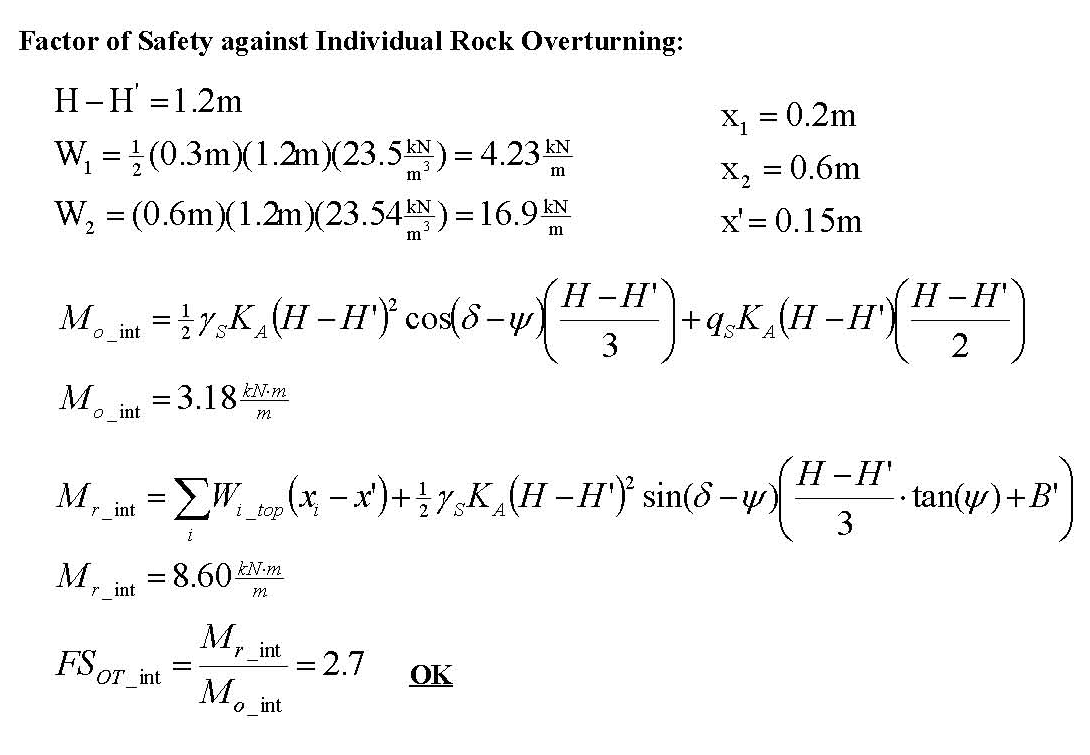
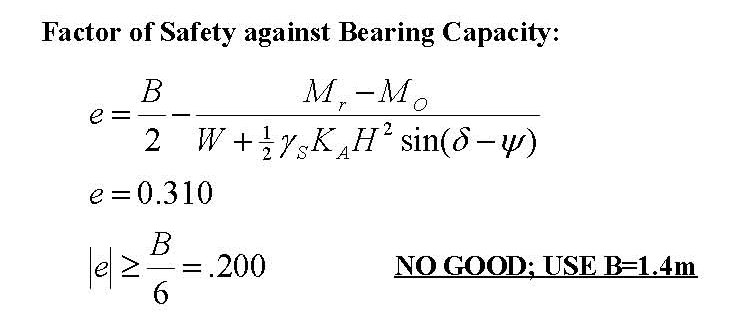
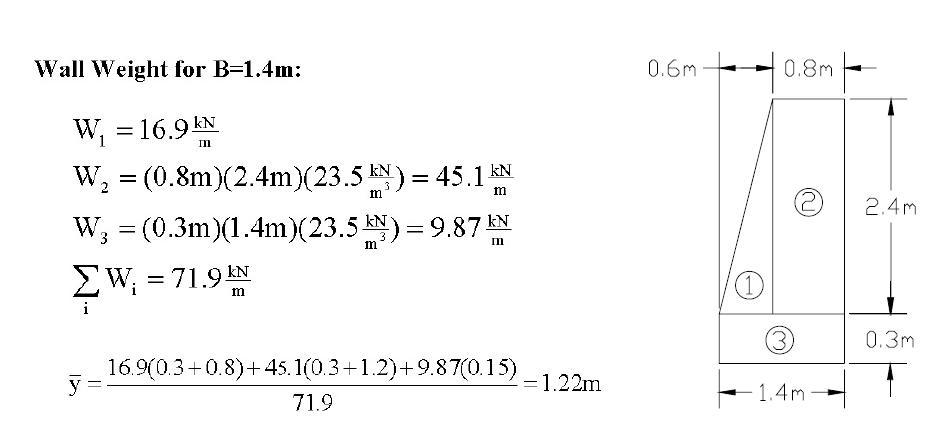
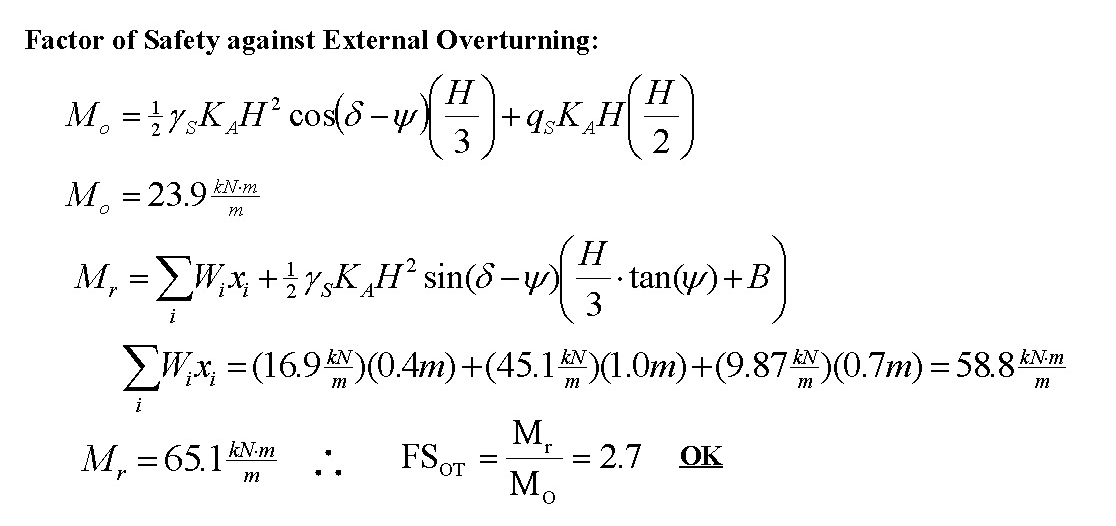
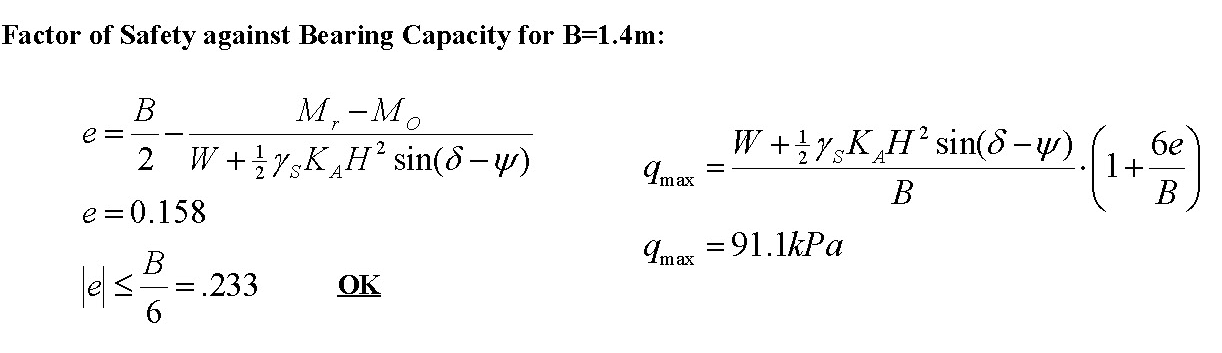
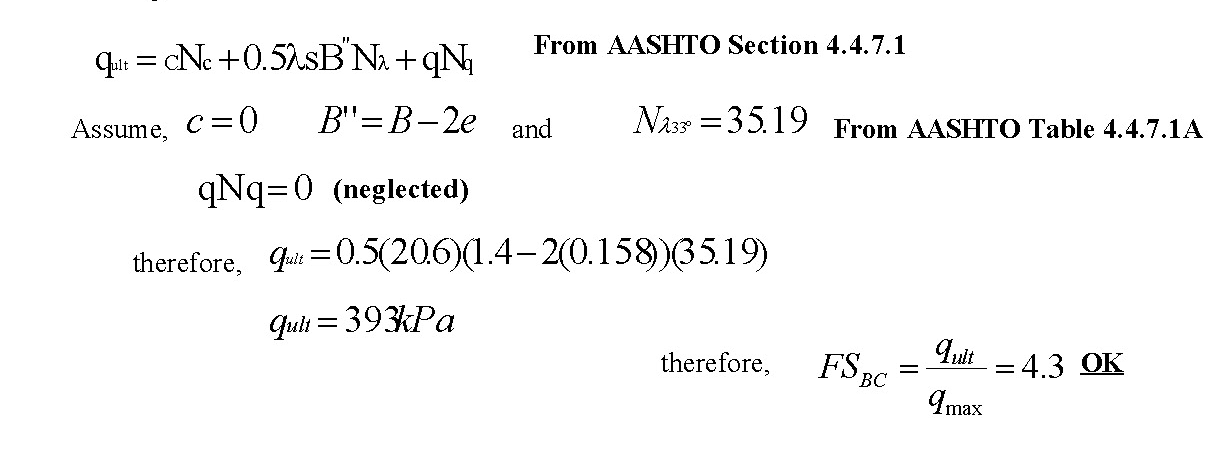
The design geometry and computation of the required base width and factors of safety follow:
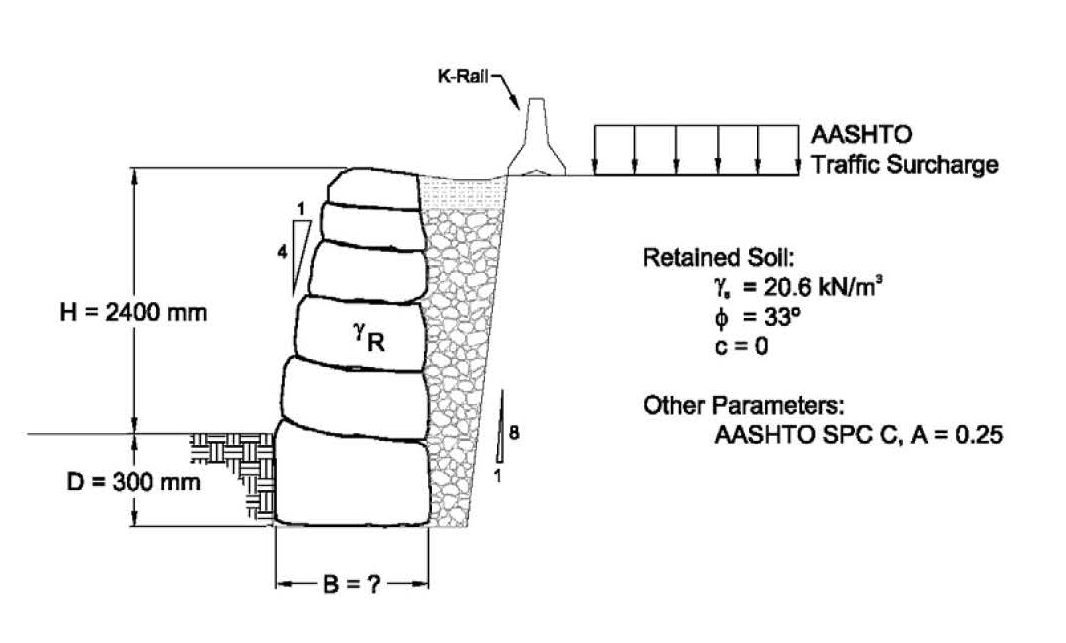
Figure 81. Graphic. Assumed Geometry for Example Problem - 2400 mm (8 ft) rockery retaining medium dense clayey sand and subjected to a vehicle surcharge.
View larger version of Figure 81.
Assume B = 1.2 m for initial analyses.
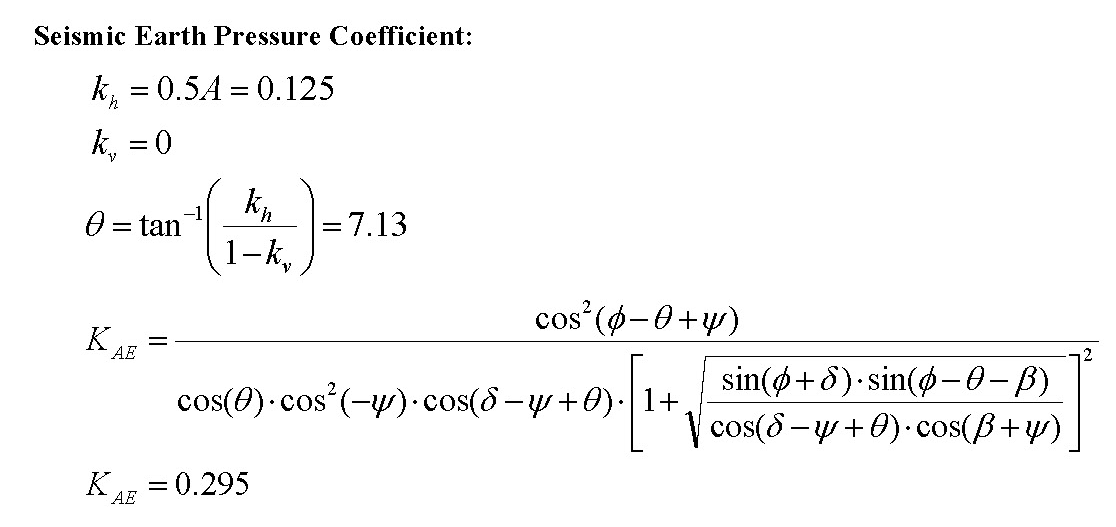
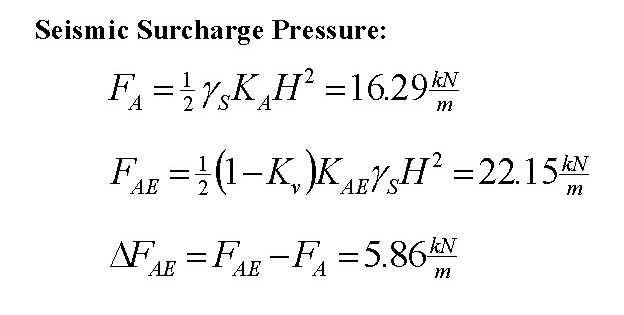
Check seismic stability using the alternate approach by Richards and Elms:
Recompute kh and KAE
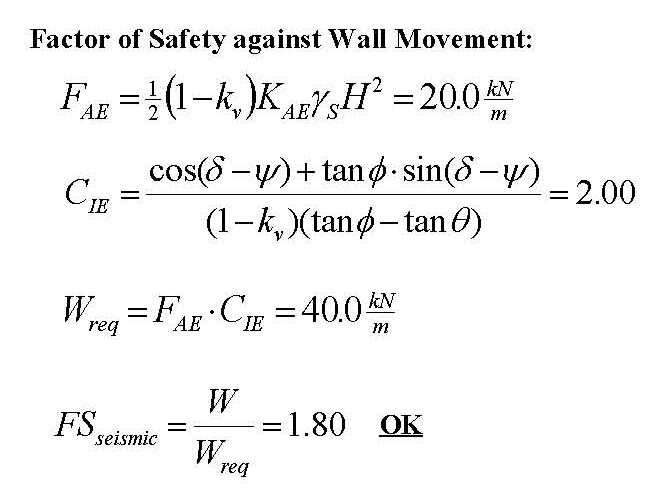
Therefore, since FSseismic > 1.1, there is at least a 90% probability that the observed movement following a design earthquake with the estimated level of shaking will be less than 70 mm (2.75 in). Because the factor of safety is actually much greater than 1.1, the probability that the observed movement will not exceeded 70 mm (2.75 in) is likely greater than 95%.
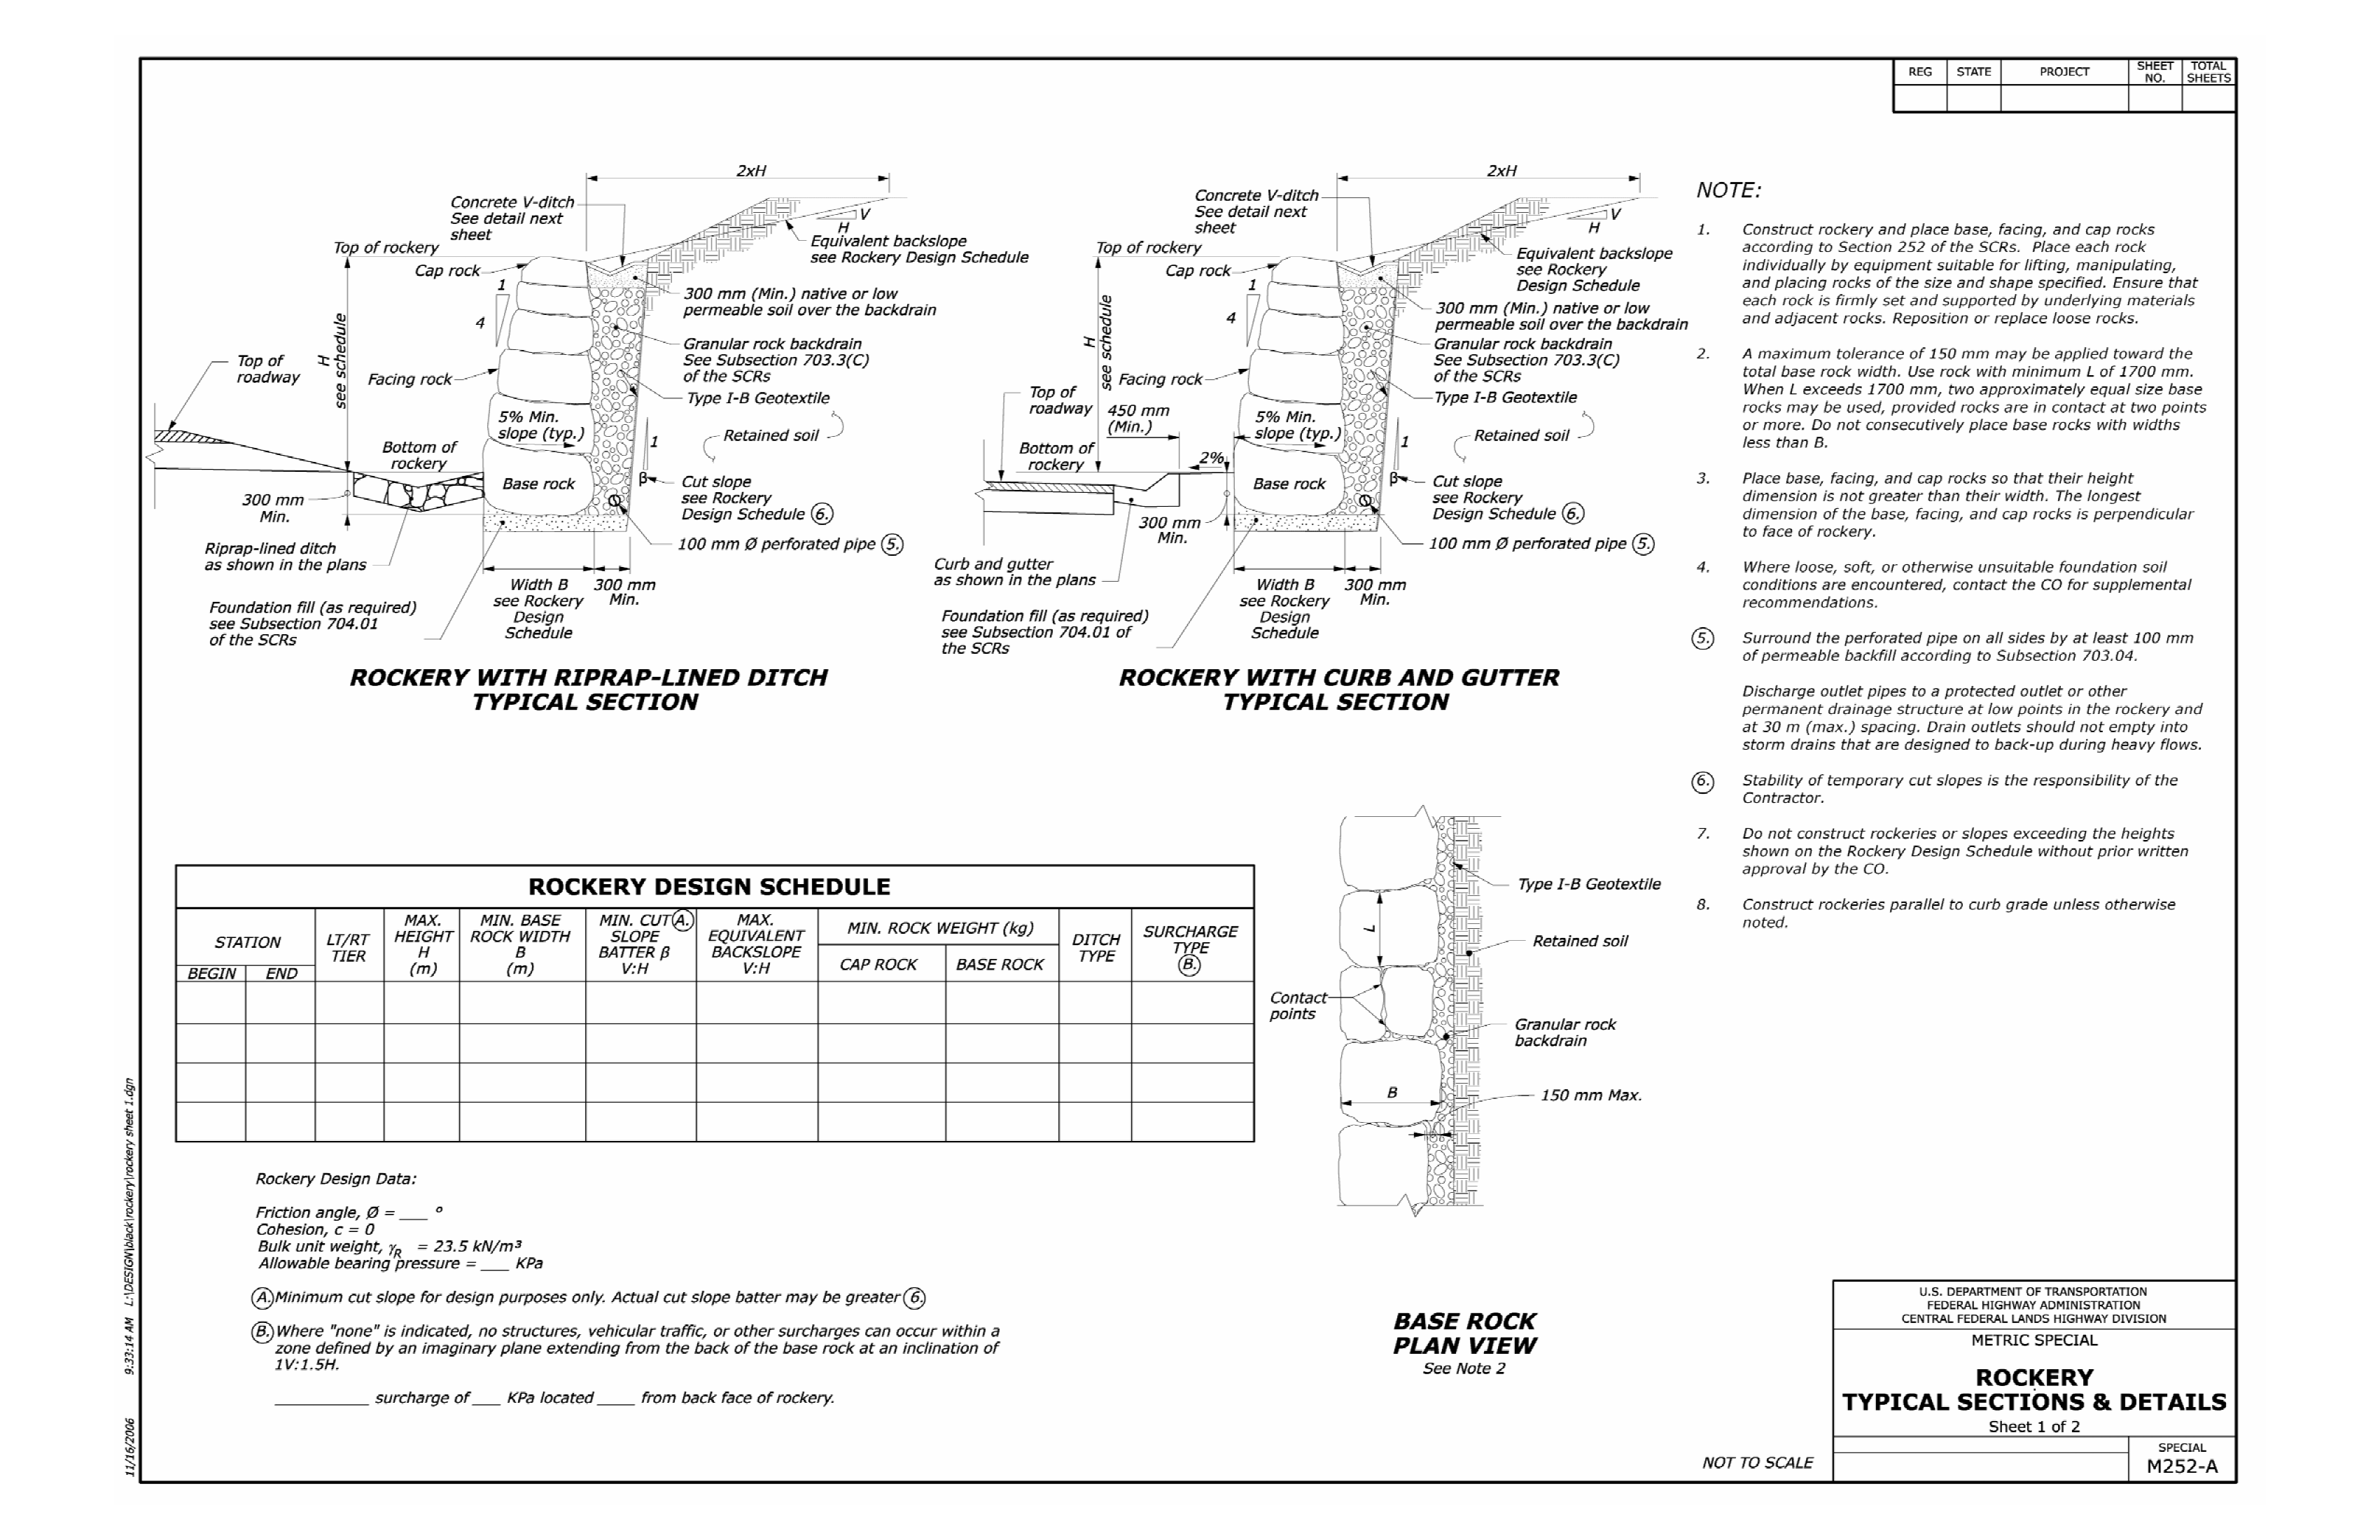
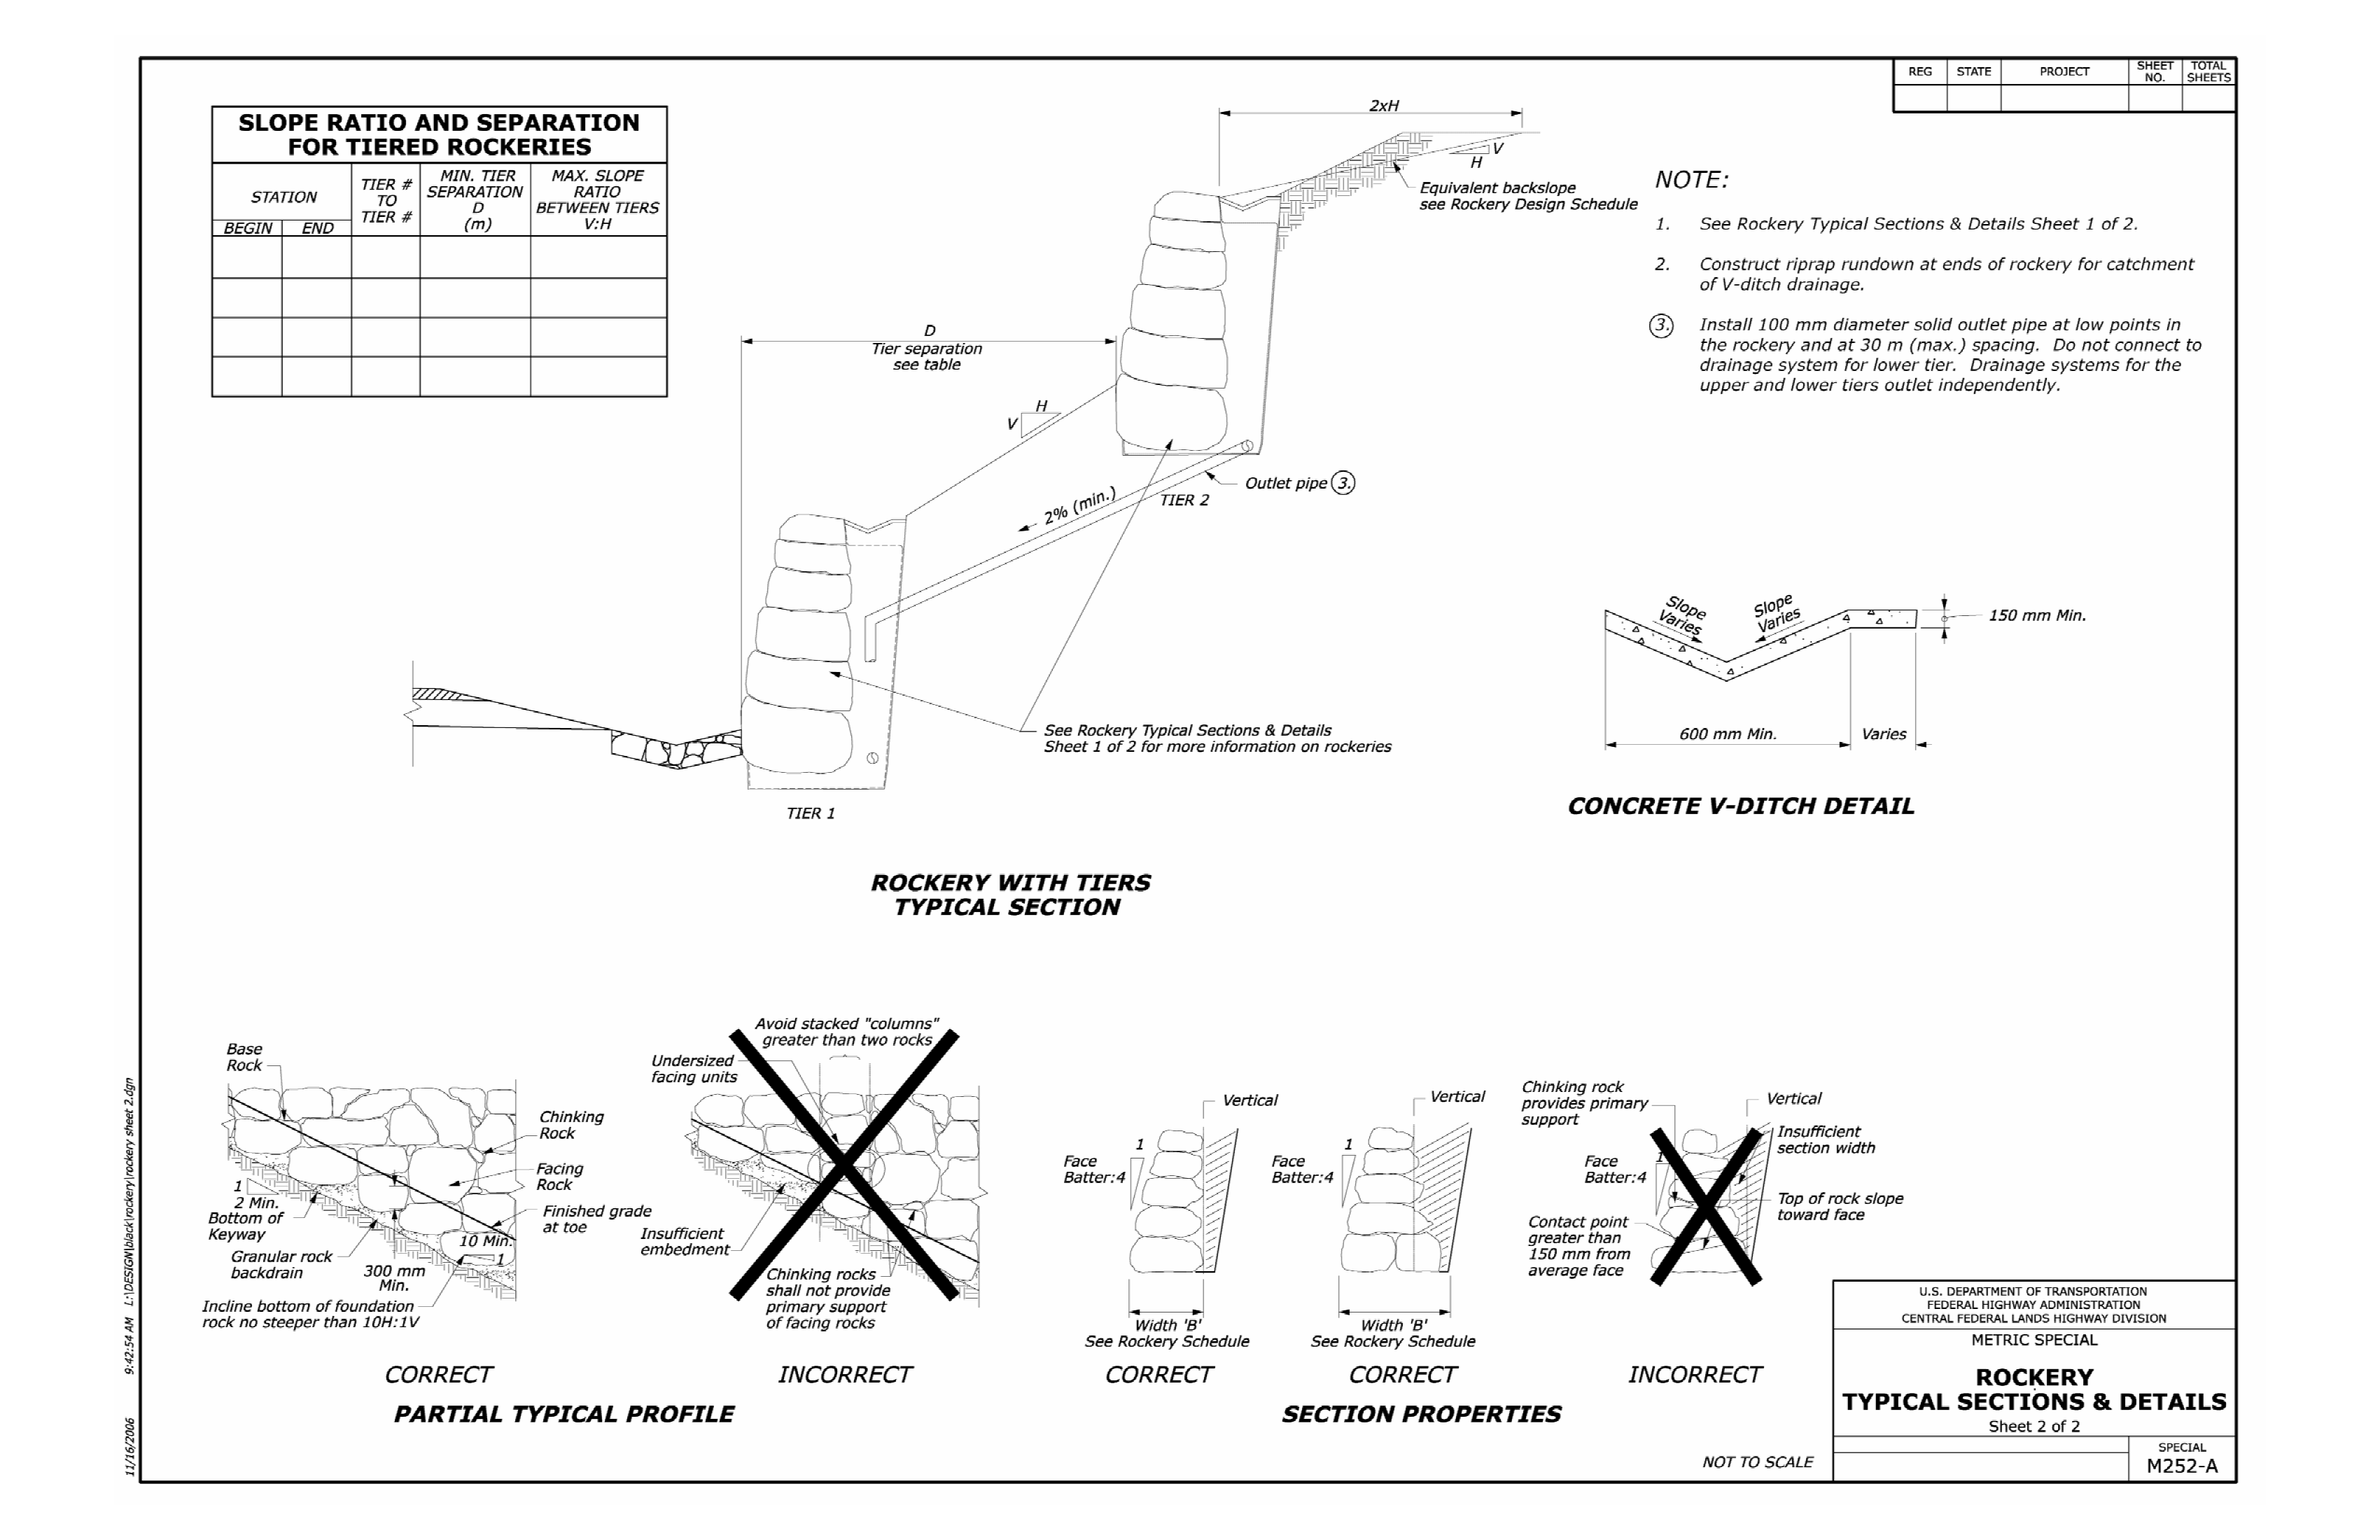
The following sample sections and details have been developed in conjunction with the FLH for use on FLH projects that will include rockery construction. The plans should be used in association with the design methods recommended in Chapter 4 and the guide specifications presented in Chapter 8.
Stay up to date
Sign up for announcements on grant opportunities, training, and webinars.